2. 5. BARBIERI E T A L . Protein Stabilization by Polymers During Lyophilization 91
poly(ethylene glycol) (PEG) and dextran. A number of these polymers, P E G in
particular, have been shown to be potent cryoprotectants, but they are also desirable
freeze-drying components because of their typically high glass transitions and
bulking properties (2). Coincidentally, the same polymeric materials are also
common constituents in aqueous two-phase extraction systems used for, among other
things, protein separation and purification.
A n interesting question is raised. Can phase separation occur during
lyophilization and, i f so, are there any consequences regarding protein stability? If
phase separation does occur, then a protein would be free to partition into either
phase. A t the very least, the composition of that phase may be very different than the
Downloaded by UNIV OF PITTSBURGH on August 19, 2010 | http://pubs.acs.org
original formulation. If the protein partitions into a phase deficient in stabilizing
excipients, then it would be expected that any stabilizing effects would be
Publication Date: August 1, 1997 | doi: 10.1021/bk-1997-0675.ch005
diminished.
In this chapter, we consider a system of hen egg-white ( H E W ) lysozyme with
P E G 3350 and dextran T70 in the context o f the theoretical framework developed by
Timasheff and co-workers (3-15) to describe the stabilization o f labile proteins in
aqueous solutions. The same theory has been effectively extrapolated to describe the
stabilization o f proteins during freezing (16). Structural data for recombinant
hemoglobin lyophilized in a similar PEG-dextran system has been examined, giving
experimental evidence o f the structural damage introduced by a phase split (77).
Phase Splitting and the Lyophilization Process
Liquid / liquid phase separation results when the repulsive interactions between
molecules overcome the entropie energy gain of mixing, and the energetically most
favorable state of the system becomes one where unlike molecules are separated.
This results in a physical "splif " of the system into two phases, with the large scale
separation being driven by density differences in the two phases. Phase splitting
during lyophilization can have dramatic effects on the state o f the components
involved. The systems considered here are two-polymer systems o f P E G and
dextran. While this is an unlikely combination for a protein formulation, it is an
attractive model to consider theoretically and experimentally, and can lead to
valuable insights into the effects of a phase split on a protein formulation. Indeed,
P E G s are known to form two-phase aqueous systems with salts as well as with other
polymers that are more common constituents in protein formulations, making phase
separation a true industrial concern.
Inspection of the lyophilization process reveals that phase splitting is a highly
likely possibility. While protein formulations typically do not start at concentrations
where phase separation will occur, the concentrating effects o f freezing can force
them into a two phase region. A s the temperature of a polymer/protein aqueous
electrolyte solution is lowered, the first major change is the formation o f ice at some
subzero temperature determined by the colligative properties o f the solution. This
often occurs after the sample has been supercooled to temperatures below the
equilibrium freezing point. A definite result of the bulk formation of pure ice is the
concentration o f components in the remaining liquid phase. A t some point during
In Therapeutic Protein and Peptide Formulation and Delivery; Shahrokh, Z., et al.;
ACS Symposium Series; American Chemical Society: Washington, DC, 1997.
3. 92 T H E R A P E U T I C PROTEIN AND PEPTIDE F O R M U L A T I O N AND D E L I V E R Y
W W
Downloaded by UNIV OF PITTSBURGH on August 19, 2010 | http://pubs.acs.org
C P C Ρ
Publication Date: August 1, 1997 | doi: 10.1021/bk-1997-0675.ch005
Figure 1. Tertiary phase diagram of a representative protein formulation
showing the concentrating effect of the freezing of pure ice. Components are:
W - water, C - co-solvent, Ρ - polymer. Diagram b) shows the freeze
concentration phenomenon with the occurrence of a phase split.
18
0 5 10 15 20 25 30
Dextran Concentration
(% wt/wt)
Figure 2. Phase diagram showing the two-phase region for a P E G 3350 /
dextran T70 system. Solid lines calculated using model of K i n g et al. (see
Appendix A ) . Triangles are experimental data points from Albertsson (22).
The dashed line represents the path of concentration that the non-ice
components o f an example aqueous system would follow during the freezing o f
pure ice. The two phase region lies above the binodial curve.
In Therapeutic Protein and Peptide Formulation and Delivery; Shahrokh, Z., et al.;
ACS Symposium Series; American Chemical Society: Washington, DC, 1997.
4. 5. BARBIERI E T A L . Protein Stabilization by Polymers During Lyophilization 93
this freeze-concentration, a liquid / liquid phase split may occur. This phenomenon
of freeze concentration with and without a phase split is shown in Figure 1.
Without a phase split, freeze-concentration would continue until the system is
cooled below the glass transition temperature of the cosolvent. A t this point, a glassy
phase would form and essentially fix the concentration o f the non-ice phase. If a
phase split occurs, the situation is more complex.
A s mentioned above, the protein may partition into either phase. The shape
of the two-phase region and its tie-lines as determined by thermodynamics would
dictate how much o f each phase exists and what the actual phase compositions are.
To complicate the situation, there may now be two different glass transition
Downloaded by UNIV OF PITTSBURGH on August 19, 2010 | http://pubs.acs.org
temperatures (18).
Figure 2 shows a phase diagram for P E G 3350 and dextran T70 calculated
Publication Date: August 1, 1997 | doi: 10.1021/bk-1997-0675.ch005
using the model and parameters presented by K i n g et al. (19) (see Appendix). A s
depicted by the dashed line, the path on which the non-ice fraction o f the system
travels during freeze concentration can easily cross into a two-phase region. The
calculated tie line indicates the composition of the two phases that are formed, one
which is enriched in dextran, and the other in P E G . Since such freeze concentration
w i l l arise during the freezing step o f lyophilization, it seems that this process would
be conducive to liquid / liquid phase-splitting, even i f the initial formulation is far
from the two-phase region.
Mechanism of Protection
The mechanism used to describe the phenomenon of protein stabilization i n solution
by excipients is detailed elsewhere in the literature (3-15). The following is a brief
overview to set the stage for consideration of phase separation during lyophilization.
Consider a multicomponent system. Component 1 is given as the solvent. Water is
typical, although a pseudo solvent such as an aqueous buffer solution may also be
considered component 1. The latter is actually more common as many proteins are
solvated in the presence of buffer salts. The protein is denoted as component 2.
Component 3 is taken to be the excipient, or cosolvent, o f the system.
There are three thermodynamic quantities that are used to describe the
stabilization o f proteins by excipients. The one o f interest for the purposes o f this
discussion is called the transfer free energy. It is the change i n free energy o f the
protein (μ2) on transfer from pure water (pseudo solvent) to a cosolvent system.
Mathematically it can be expressed as
ΑμΙ = μΙ-μΙ (!)
The superscript Ν denotes the native conformation of the protein (a D superscript
denotes the denatured, or unfolded, state). Subscripts 2,c, and w denote component 2
(protein), cosolvent system, and pure water system, respectively.
Figure 3 depicts a typical free energy diagram for a protein and a
cryoprotectant cosolvent. A s shown in Figure 3, the transfer free energy for a
cryoprotectant w i l l , in general, be positive. The quantity, AGdenaturation, determines the
relative amounts o f protein in the native and denatured forms at equilibrium. A
larger AGdenaturation would correspond to a more stable protein ~ relatively more
protein in the native state than the denatured state. Since, for a cryoprotectant,
In Therapeutic Protein and Peptide Formulation and Delivery; Shahrokh, Z., et al.;
ACS Symposium Series; American Chemical Society: Washington, DC, 1997.
5. 94 T H E R A P E U T I C PROTEIN AND PEPTIDE F O R M U L A T I O N AND D E L I V E R Y
Downloaded by UNIV OF PITTSBURGH on August 19, 2010 | http://pubs.acs.org
Publication Date: August 1, 1997 | doi: 10.1021/bk-1997-0675.ch005
Water Cosolvent
Figure 3. Energy schematic depicting the effects of a typical protein stabilizer.
The transfer free energy for a protein into a stabilizing cosolvent w i l l be
positive for both the native and denatured forms. The denatured form w i l l have
a larger transfer free energy than the native form, resulting in a larger
AGj , , t j in the cosolvent system. Thus, more protein w i l l be in the native
L nu uru l( n
state than the denatured state in the presence of the cosolvent, concurring a
relative stability. Symbols are described in the text. Adapted from (14). A t
low temperatures, P E G is excluded from protein surfaces, acting as a stabilizer
as shown here (23,24). It should be noted, however, that at high temperatures,
P E G can bind to proteins, acting as a dénaturant (12,25), in which case this
figure is no longer valid.
In Therapeutic Protein and Peptide Formulation and Delivery; Shahrokh, Z., et al.;
ACS Symposium Series; American Chemical Society: Washington, DC, 1997.
6. 5. BARBIERI E T A L . Protein Stabilization by Polymers During Lyophilization 95
Δμ^ /Γ > Δ μ ^ , AGdenaturation will be larger in the cosolvent system than i n the pure
Γ
water system, i.e. a relative stabilization has been conferred to the protein.
It has been demonstrated that excipients which are preferentially excluded
from the surface of the protein, such as polymeric materials, w i l l confer stability to
proteins through the above mechanism (3-J5) . Globular proteins are assumed to
form a compact native structure in solution. A n increase in surface area upon
unfolding is given as a physical rationale for the larger transfer free energy for the
denatured state than for the native state (72). From this argument it would seem that
the transfer free energy is a natural yardstick to measure the cryoprotectant
effectiveness of an excipient. A larger transfer free energy should then correspond to
Downloaded by UNIV OF PITTSBURGH on August 19, 2010 | http://pubs.acs.org
a better protectant.
Publication Date: August 1, 1997 | doi: 10.1021/bk-1997-0675.ch005
Chemical Potential Relief Valve?
From the mechanism outlined above, it seems than a large transfer free energy is
desirable in stabilizing a protein. If adding more and more o f a polymeric excipient
w i l l increase the transfer free energy, then it is probably a good idea to add as much
polymer as practical. Figure 4 shows the transfer free energy for lysozyme as a
function of P E G concentration. Transfer free energies as a function o f polymer
concentration are calculated using a model presented by K i n g et al. (19) (see
Appendix). Indeed, the transfer free energy does increase with increasing polymer
concentration. Adding increasing quantities of polymer, however, w i l l make phase
separation even more likely.
W i l l a phase separation act as a chemical potential relief valve? Phase splits
occur because the separation of unlike molecules leads to a lower free energy system
than the single phase system. Thus, the possibility of a phase split raises a question
of diminishing returns; in essence the phase split acts as a chemical potential "relief
valve" in the protein stabilizing system. There is a possibility that some protection --
increased transfer free energy -- may even be lost. A t the very least, subsequent
addition of excipient w i l l not provide the same increase in protection.
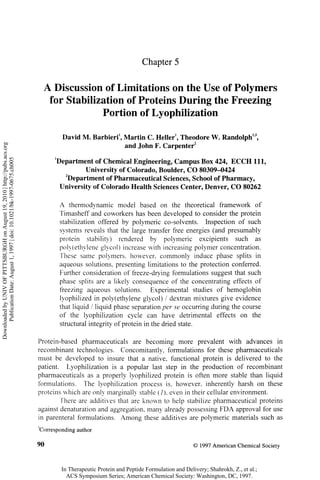
Figure 5 shows the transfer free energy of lysozyme in a PEG-dextran system
with and without a phase split, calculated using the model presented by K i n g et al.
(19). Indeed, there is an attenuation of transfer free energy, and presumably protein
protection, realized after a phase split occurs. The occurrence o f such an attenuation
of protection has large implications in the design o f a freeze drying formulation.
There is clearly a limit in the amount of "protection" as represented by the
preferential exclusion principle that can be gained by the addition of a polymeric
excipient when a phase split can occur. Also, i f the phase split results in a protein-
rich phase with minimal excipient (protein partitions away from intended stabilizer),
then the excipient would not be a ai liable to protect the protein during subsequent
drying. Finally, the advent of a phase separation per se can have detrimental effects
on protein structural stability as we will see in the following sections.
In Therapeutic Protein and Peptide Formulation and Delivery; Shahrokh, Z., et al.;
ACS Symposium Series; American Chemical Society: Washington, DC, 1997.
7. 96 T H E R A P E U T I C PROTEIN AND PEPTIDE F O R M U L A T I O N AND D E L I V E R Y
Downloaded by UNIV OF PITTSBURGH on August 19, 2010 | http://pubs.acs.org
4
Publication Date: August 1, 1997 | doi: 10.1021/bk-1997-0675.ch005
0 1 2 3 4 5 6 7
PEG Concentration
(% wt./wt.)
Figure 4. Calculated transfer free energy of hen egg-white lysozyme as a
function of P E G 3350 concentration. Transfer free energy can be considered a
measure of the protectant effectiveness of an excipient. Details o f calculations
can be found in Appendix B .
In Therapeutic Protein and Peptide Formulation and Delivery; Shahrokh, Z., et al.;
ACS Symposium Series; American Chemical Society: Washington, DC, 1997.
8. BARBIERI E T A L . Protein Stabilization by Polymers During Lyophilization
Downloaded by UNIV OF PITTSBURGH on August 19, 2010 | http://pubs.acs.org
Publication Date: August 1, 1997 | doi: 10.1021/bk-1997-0675.ch005
6 7 8 9 10
Dextran Concentration
(% wt./wt.)
Figure 5. Calculated transfer free energy of lysozyme in a P E G 3350 / dextran
T70 system with (dashed line) and without (solid line) the onset o f a phase split.
P E G concentration is maintained constant at 7%. Details of calculations can be
found in Appendix B .
In Therapeutic Protein and Peptide Formulation and Delivery; Shahrokh, Z., et al.;
ACS Symposium Series; American Chemical Society: Washington, DC, 1997.
9. 98 T H E R A P E U T I C PROTEIN AND PEPTIDE F O R M U L A T I O N AND D E L I V E R Y
Structural Information
Fourier Transform Infrared Spectroscopy. Fourier transform infrared (FTIR)
spectroscopy has proven an essential tool in the study of protein stabilization
primarily because it allows the study to be performed in any state (i.e., aqueous,
frozen, dried, or even insoluble aggregate). Dong et al. (20) have recently published
a review on the use of FTIR for the study of protein stability during lyophilization
which offers an excellent introduction to the technique. While the vibrational spectra
of protein molecules exhibit a number of characteristic frequency bands, the amide I
1
band (1700-1600 cm" ) has seen the widest use in assessing protein structure. This
Downloaded by UNIV OF PITTSBURGH on August 19, 2010 | http://pubs.acs.org
band is due primarily to the C = 0 stretching vibrations of the peptide linkages that
make up the backbone structure of proteins, and is thus sensitive to small variations
Publication Date: August 1, 1997 | doi: 10.1021/bk-1997-0675.ch005
in molecular geometry. Each type of secondary structure (α-helix, β-sheet, etc.), in
principle, gives rise to a different C = 0 stretching frequency in the amide I region of
the IR spectrum, although, because of the broad bandwidth of these components, the
amide I absorbance usually appears as a single composite signal. Mathematical
band-narrowing techniques have been developed to allow the resolution o f
underlying amide I peaks and thus qualitative and often quantitative information
about the protein's secondary structure. O f the techniques developed, we have found
the second derivative method of analysis most useful primarily because it is not
dependent on the subjective input of arbitrary parameters (see (20) for a thorough
description and comparison of band narrowing techniques).
Experimental Methods. Lyophilization experiments were performed on samples of
recombinant hemoglobin (Somatogen. Inc., Boulder. C O ) to determine the effects o f
polymers on the retention of native structure in the dried state. A l l samples were
buffered in 5 m M phosphate. p H 7.4. and contained 150 m M N a C l . Sample volumes
of 1 m L were aliquoted in 5 m L vials. Freeze drying was performed using a F T S
Systems microprocessor controlled tray dryer with the following conservative cycle:
freezing with shelf temperature set at -50°C for 120 minutes; primary drying with
shelf temperature at -20°C and vacuum set at 60 m Τ for 1000 minutes; secondary
drying steps of 0 ° C . 60 mT for 120 minutes. 10°C, 60 mT for 120 minutes, and
25°C. 60 mT for 120 minutes. Dried cakes were solid plugs with no apparent melt-
back. F T I R spectra of aqueous and dried samples were collected using a Nicolet
Magna Model 550 spectrometer equipped with a d T G S detector. Aqueous solutions
were placed into a liquid cell (Beckman FH-01) in which CaF2 windows are
separated by a 6 μηι spacer. For dried samples, K B r pellets o f approximately 1-5 mg
of lyophilized protein mixture and 200 mg K B r were pressed and placed immediately
in the IR sample chamber in a magnetic sample holder. Spectra o f amorphous two
phase systems were taken on ground and well mixed cakes, and thus are
representative of a combination of material in the two phases. A 256-scan
1
interferogram was acquired in single beam mode with a 4 cm" resolution. Buffer
and water vapor components were subtracted using Nicolet software. A seven-point
smoothing was performed on the second derivative spectra to remove possible white
noise, and a baseline correction was performed over the amide I region. A l l spectra
1 1
were normalized by their total area between 1700 cm" and 1600 cm" to allow direct
comparison.
In Therapeutic Protein and Peptide Formulation and Delivery; Shahrokh, Z., et al.;
ACS Symposium Series; American Chemical Society: Washington, DC, 1997.
10. 5. BARBIERI E T A L . Protein Stabilization by Polymers During Lyophilization 99
Results: Lyophilization Studies. Figure 6 shows the amide I region o f the second
derivative F T I R spectra of hemoglobin both in solution and lyophilized i n the
presence o f both P E G 3350 and dextran T500. Hemoglobin is primarily an α-helix
protein (87% by x-ray crystallography (21)); this is reflected in the dominant α-helix
1
IR band near 1656 cm" seen in the spectrum of hemoglobin in solution, which is
considered the native secondary structure. Clearly, there is a loss o f intensity o f this
α-helix band in the spectrum of hemoglobin lyophilized in buffer alone, indicating a
loss of native structure, or a destabilization, that results from freeze drying. Spectra
of samples lyophilized with increasing levels of P E G , however, show a progressive
return in native structure (increase in α-helix content). This result is congruent with
Downloaded by UNIV OF PITTSBURGH on August 19, 2010 | http://pubs.acs.org
the native state transfer free energy calculations shown in Figure 4. That is,
increasing polymer concentration confers added stability to the protein. This general
Publication Date: August 1, 1997 | doi: 10.1021/bk-1997-0675.ch005
trend is not true with all polymers, however, at least not to the same extent. While
the spectra of samples containing dextran (figure 6b) show some stabilizing effects
on hemoglobin's structure, the effect is not as dramatic as that seen with P E G .
A s was mentioned earlier, aqueous P E G / dextran mixtures w i l l undergo a
phase split at appropriate concentrations. Systems were chosen from known phase
diagrams (22) to ascertain experimentally the effects that a phase split occurring
during lyophilization has on hemoglobin structural stability. Figure 7 shows the a -
helix band depth of the second derivative F T I R spectra o f hemoglobin samples
lyophilized in various P E G /dextran mixtures. Since the α-helix band is considered
the primary indicator of native structure in these hemoglobin experiments, results
have been focused on this band. Thus, the liquid control is considered the native " a -
helix band depth" or α-helix content. Mixtures of 7% P E G / 7% dextran undergo a
definite phase split at room temperature. The P E G rich (top) phase is approximately
10% P E G / 0.2%) dextran, while the dextran rich (bottom) phase is 20%> dextran / 2%>
P E G . Hemoglobin partitions in this system such that the hemoglobin concentration
in the dextran rich phase is about three times that in the P E G rich phase. Protein at
the concentrations used, however, has little effect on the P E G / dextran phase
diagram (22). Lyophilized samples at this concentration are clearly two phase before
freezing and drying. A s can be seen by the α-helix band depth in Figure 7, the
system offers some protection over lyophilizing in buffer alone. The 5 > P E G / 5%
%
dextran system sits nearly on the two phase boundary at 0°C and thus also undergoes
a phase separation prior to freezing. The α-helix content in the dried state is nearly
identical to the 7% system. Concentrations of 4% P E G / 4% dextran, however, are
well below the two phase boundary even at 0°C. Phase separation occurring in this
sample (as is evident in the scanning electron microscopy of the dried cake, data not
shown) happens as a result of freeze concentration during the lyophilization cycle.
The IR spectrum of the dried state hemoglobin in the 4% P E G / 4% dextran system
reveals a clear decrease in α-helix content over hemoglobin freeze dried i n buffer
alone. This result indicates that there is a detrimental effect on the protein as a result
of the phase split occurring during the course of the lyophilization cycle. When a
phase separation occurs, one phase nucleates as dispersed droplets in a continuum of
the other phase. A t the sub-zero temperatures where this would occur during
freezing o f a lyophilization sample, high viscosity w i l l hinder the kinetics o f the
macroscopic phase separation, that is the migration and coalescence o f the dispersed
In Therapeutic Protein and Peptide Formulation and Delivery; Shahrokh, Z., et al.;
ACS Symposium Series; American Chemical Society: Washington, DC, 1997.
11. Downloaded by UNIV OF PITTSBURGH on August 19, 2010 | http://pubs.acs.org
Publication Date: August 1, 1997 | doi: 10.1021/bk-1997-0675.ch005
0.00
-0.02
-0.04
-0.06
-0.08
1700 1680 1660 1640 1620 1600 1700 1680 1660 1640
wavenumber (crrf^) wavenumber (cm"^)
Figure 6. A m i d e I region o f the second derivative F T I R spectra o f hemoglobin
in solution and lyophilized in various concentrations of: a) P E G 3350, and b)
dextran T500. Solid curve - hemoglobin i n liquid solution, Dotted curve - dried
ACS Symposium Series; American Chemical Society: Washington, DC, 1997.
In Therapeutic Protein and Peptide Formulation and Delivery; Shahrokh, Z., et al.;
state hemoglobin lyophilized in buffer alone, dashed curve - dried state
hemoglobin lyophilized with 5% polymer, dash-dot-dot curve - dried state
hemoglobin lyophilized with 10% polymer.
12. 5. BARBIERI E T A L . Protein Stabilization by Polymers During Lyophilization 101
Downloaded by UNIV OF PITTSBURGH on August 19, 2010 | http://pubs.acs.org
Publication Date: August 1, 1997 | doi: 10.1021/bk-1997-0675.ch005
-0.07 ϊ 1 t 1 1 ι-
Α Β C D Ε
1
Figure 7. α-helix peak depth (-1656 cm" ) from second derivative F T I R
spectra o f dried state hemoglobin. A - hemoglobin in solution (native state
reference). Β - lyophilized with 7% P E G 3350 / 7% dextran T500. C -
lyophilized with 5% P E G / 5% dextran. D - lyophilized in buffer only. Ε -
lyophilized in 4% P E G / 4% dextran. Modified from (7 7).
drops. When the sample reaches a glass transition, the dispersed phase is locked
from further separation, leaving an enormous excess o f interfacial area. We
speculate that this increase in interfacial surface and the added stresses it presents are
responsible for the observed protein damage.
Conclusions
While polymeric excipients are desirable stabilizers in protein formulations due to
their typically large transfer free energies, there are definite limitations. Excipients
such as poly(ethylene glycol) confer increasing transfer free energies with increases
in concentration. These same polymers, however, are often incompatible with other
formulation components at high concentrations and can cause a phase split to occur.
A t the very least, the onset of a phase split reduces the effectiveness o f the stabilizer
by providing a chemical potential "relief valve." Further, because o f the large
concentrating effects o f freezing pure ice out o f solution during lyophilization, phase
splits can occur at relatively low initial polymer concentrations. It has been
demonstrated experimentally that phase separation per se occurring during the
lyophilization cycle can actually have detrimental effects on the structural stability o f
a protein.
In Therapeutic Protein and Peptide Formulation and Delivery; Shahrokh, Z., et al.;
ACS Symposium Series; American Chemical Society: Washington, DC, 1997.
13. 102 T H E R A P E U T I C PROTEIN AND PEPTIDE F O R M U L A T I O N AND D E L I V E R Y
Appendix A.
K i n g . Blanch, and Prausnitz in (19) present a thermodynamic model for the
prediction of aqueous phase separations. It is based on a osmotic virial expansion
truncated after the second-virial-coefficient term. Chemical potentials of polymer (2)
and polymer (3) as a function of molality are given by:
Δ μ = RT(n
2 + a^nu + a m.) r (2)
Δ μ , = R T( In m~ + a, w + a m ) 3 3 23 2 (3)
Downloaded by UNIV OF PITTSBURGH on August 19, 2010 | http://pubs.acs.org
where m, is the molal concentration of polymer /, and a„ is the interaction coefficient,
which can be related to traditional second virial coefficients, A,„ obtainable by low-
Publication Date: August 1, 1997 | doi: 10.1021/bk-1997-0675.ch005
angle light scattering, by:
2A„ = L O O O - ^ r (4a)
(.v/ r 2
2A,=1.000-^r (4b)
2^=1,000-^ (4c)
23
M M 2 3
Here. M, is the molecular weight. The chemical potential for water (1) can then be
calculated from the Gibbs-Duhem relation:
Δμ, = -RTV^jyn^ 3
2 2
+ m + - ^ -(w ) + - ^ ( w )2
2
3
2
+a m m j
23 2 3 (5)
where V andp/ are the molal volume and density o f water (or pseudo-solvent),
respectively. A phase diagram can be determined with these equations, the
appropriate mass balance equations, and the following conditions for equilibrium:
μ, = μ, (6a)
μ - μ
2 2 (6a)
μ = μ";
3 (6a)
Appendix Β.
For calculation of protein chemical potentials and transfer free energies, the
more detailed model of Haynes, et al. (26) was used. This mathematical model
describes the protein's chemical potential as a function o f cosolvent concentration,
enabling the transfer free energy to be obtained:
A ^ ^ f f e l dm, (7)
where m, is the molality of compound /, Τ is the temperature, and Ρ is the pressure.
Details of the model (as described for aqueous two-phase partitioning
calculations) are given elsewhere (26), but an overview is given here:
The modified Helmholtz energy is first divided into ideal and excess parts as
shown i n equation (4)
In Therapeutic Protein and Peptide Formulation and Delivery; Shahrokh, Z., et al.;
ACS Symposium Series; American Chemical Society: Washington, DC, 1997.
14. 5. BARBIERI E T A L . Protein Stabilization by Polymers During Lyophilization 103
A =A +A Hl ex (8)
The chemical potential of any species in the system is simply given by its partial
derivative of A ':
dA
(9)
d η,
where «,· is the number of moles of species j. The chemical potential can
similarly be divided up into its ideal and excess parts which correspond to the ideal
and excess parts of A
Downloaded by UNIV OF PITTSBURGH on August 19, 2010 | http://pubs.acs.org
94 (10)
μ, = μ...../ + μ
dn,
Publication Date: August 1, 1997 | doi: 10.1021/bk-1997-0675.ch005
/μ„,/7 (/*/,0),7·,ί/
(
After transformation from the modified Helmholtz framework (independent
variables mo,n ^ T,V) to the Gibbs (experimental) framework (independent
](j h
variables η,Τ,Ρ), the final expression for the chemical potential o f species i is given
as (27)
f m λ
μ,- = μ. •/?7Ίηφ, + /?7ΐ (11)
θ
Here μ ; is the standard state chemical potential of species /', R is the universal
gas constant, Γ is the absolute temperature, φ, is the volume fraction o f species /, V*
is the partial molar volume of species /', n, is the number o f moles o f species j , and
Ρ EX is the excess pressure.
The first three terms on the right-hand side of equation (11) comprise the well-
defined ideal part o f the chemical potential. The excess pressure term arises on
transformation from the A ' framework to the Gibbs framework, and is given as
'3A'"
P. = -
r
(12).
dV
Mo,",,,,,'/'
The last term is the excess chemical potential as defined in equation (10):
dA
μ;,.- ' (13).
The excess Helmholtz free energy A ' is considered to be composed o f five
ex
contributions:
A'„ (14)
where A ' h (hard-sphere) is the contribution to the excess modified Helmholtz free
eXt s
energy from combining hard spheres of unequal sizes in a continuum:
In Therapeutic Protein and Peptide Formulation and Delivery; Shahrokh, Z., et al.;
ACS Symposium Series; American Chemical Society: Washington, DC, 1997.
15. 104 T H E R A P E U T I C PROTEIN AND PEPTIDE F O R M U L A T I O N AND D E L I V E R Y
4·ν,//.ν - As Ad (14a)
= - ^ Σ Λ | 1 η ( ΐ - ξ , ) - ^ Σ ^
RTV f
In 1
V
-Σφ.J
/*0
6kTV
π ι-ς, (ς,) 2
^ ' (ι-ξ )
3
2
Downloaded by UNIV OF PITTSBURGH on August 19, 2010 | http://pubs.acs.org
θ
where F is the solvent partial molar volume, ξ, = Ρξ„, = ^ with
Publication Date: August 1, 1997 | doi: 10.1021/bk-1997-0675.ch005
Η
w=0, 1. 2. or 3. and c/, is the hard-sphere diameter of species /.
A 'cx.na (non-additive) is a first-order correction to the hard-sphere term accounting
for penetration of protein macroions into polymers:
Α.. „, = A„- A,
n
V /*0 1*0 / j k
where σ,, is the actual closest distance of approach o f components i and j and
the pair correlation function g,j for additive hard spheres is taken from Grundke and
Henderson (28):
3ξ d.d, 1 E;
2
(14c)
2 + — —
ι-ς, 2 ( ι - ξ , ) 1 d„ j 20-ξ,)Ί
A ' , (ion charging) is a contribution from charging neutral spheres in a
ex lc
dielectric continuum,
2
_ N e Av γ» n^]
A.,,, -Y- (14d)
ε d,
where TV^v is Avogadro's number, ε is the permittivity, and z,- is the charge on
species /.
^4 ex.cc (charge-charge) accounts for charge-charge interactions:
(14e)
r i + ί/,Γ 2Δ J 3π
2 2 2
κ ^ Ρ,0 + ^ Γ ) " ( ζ , - nd;P n 12Δ)
2
4Γ =-
7 7
In Therapeutic Protein and Peptide Formulation and Delivery; Shahrokh, Z., et al.;
ACS Symposium Series; American Chemical Society: Washington, DC, 1997.
16. 5. BARBIERI E T A L . Protein Stabilization by Polymers During Lyophilization 105
Δ = 1- — Σ Ρ / ^ / ' κ 2 = z
P/ / " a n c
* Ρ/ i sm e n u m D e r
density o f solute
i.
Finally, A ' (virial expansion) takes short-range interactions between solutes
ex<ve
into account and is calculated from an osmotic virial expansion truncated at the
second term:
4,„. = Κ Τ Ν , Χ Χ π , ^ β * ( μ „ , Γ ) (14f)
1*0 *
β* y is the residual second osmotic virial coefficient, which can be calculated
Downloaded by UNIV OF PITTSBURGH on August 19, 2010 | http://pubs.acs.org
from the second osmotic virial coefficient B by: l}
Publication Date: August 1, 1997 | doi: 10.1021/bk-1997-0675.ch005
MW MW I I 2ncl
β, = B u - '- - 1 0 0 0 V- (15a)
" 1000/V . /h 3
or from the solute-solute specific interaction coefficient βί] by
3
β 2πσ
>L
β, = - ^ - - 1 0 0 0 (15b)
' 2N Av 3
More detailed explanations of each o f the expressions for each o f the
aforementioned contributions to A ' are given by Haynes et al, (26).
ex
Application o f the above framework to a specific system requires several
parameters. They include: hard-sphere diameters of each solute, solvent molar
volume, solute partial molar volumes at infinite dilution, ion charges, solvent
dielectric constant, and osmotic second virial coefficient data. W i t h the exception of
the osmotic virial coefficient (required for the A ' term), these parameters are eXtVe
available in the literature or would be routinely measured for a new protein system;
required light scattering experiments for the osmotic virial coefficients are relatively
straightforward.
Salt parameters are readily available in the literature (29). For application to a
particular system, polymer and protein parameters would have to be determined. The
charges of proteins can be determined from acid-base titration (30-35). Hard-sphere
diameters o f polymers can be regressed from differential solvent vapor pressure data
(36) and protein diameters can be determined from the method o f T y n and Gusek
(37) . Distances o f closest approach are taken as the arithmetic average o f species
diameters. Protein and polymer partial molar volumes can be regressed from density
measurements (38) or estimated from correlations (39). Osmotic second virial
coefficients can be regressed from low-angle laser-light scattering ( L A L L S )
measurements combined with Raleigh theory (40,41). For the examples presented
here, we used the data found in Tables I-IV, which were obtained from data compiled
by Haynes, et al., (26).
In Therapeutic Protein and Peptide Formulation and Delivery; Shahrokh, Z., et al.;
ACS Symposium Series; American Chemical Society: Washington, DC, 1997.
17. 106 T H E R A P E U T I C PROTEIN AND PEPTIDE F O R M U L A T I O N AND D E L I V E R Y
Table I. Hard sphere diameters dg
Diameter, À
Lysozyme 30.4
Dextran T70 46.8
PEG3350 24.6
K +
3.04
H P0 2 4
4.44
HPO4 2
3.82
Downloaded by UNIV OF PITTSBURGH on August 19, 2010 | http://pubs.acs.org
S O U R C E : Adapted from ref. 26
Publication Date: August 1, 1997 | doi: 10.1021/bk-1997-0675.ch005
Table II. Distance of closest approach, σ^, À.
+
Lysozyme DextranT70 P E G K H P 0 " HPO4 "
2 4
2
3350
Lvsozvme 30.4
Dextran T-70 24.4 33.6
PEG3350 24.6 22.9
K" 16.7 17.6 13.2 3.04
H P0 "
2 4
17.4 18.4 13.8 3.74 4.44
HPO4 " 2
17.1 18.6 13.8 3.43 4.13 3.82
For charged species, there is assumed to be no intermolecular penetration, and
may be obtained from Table as (d +d],)/2. Other values of ay were obtained (26)
u
from vapor-pressure osmometry data.
4 2
Table III. Cross osmotic second virial coefficients B xlO (ml/g ) for various l}
polymer and protein pairs in aqueous potassium phosphate buffer. 75 m M , p H
7.0.
Lysozyme Dextran T70 PEG3350
Lysozyme 4.1
Dextran T70 2.3 4.0
PEG3350 3.35* 36.3
interpolated between data at 50 m M potassium phosphate and 100 m M potassium
phosphate.
S O U R C E : Values are from L A L L S data tabulated in (26).
Table IV. Salt-Polymer Specific Interaction Coefficients β;| (kg/mol).
Lysozyme Dextran T70 PEG3350
ΚΗ Ρ0 2 4 1.63 .68 2.67
K2HPO4 1.47 .48 1.93
S O U R C E : Values taken from (26).
In Therapeutic Protein and Peptide Formulation and Delivery; Shahrokh, Z., et al.;
ACS Symposium Series; American Chemical Society: Washington, DC, 1997.