Download to read offline
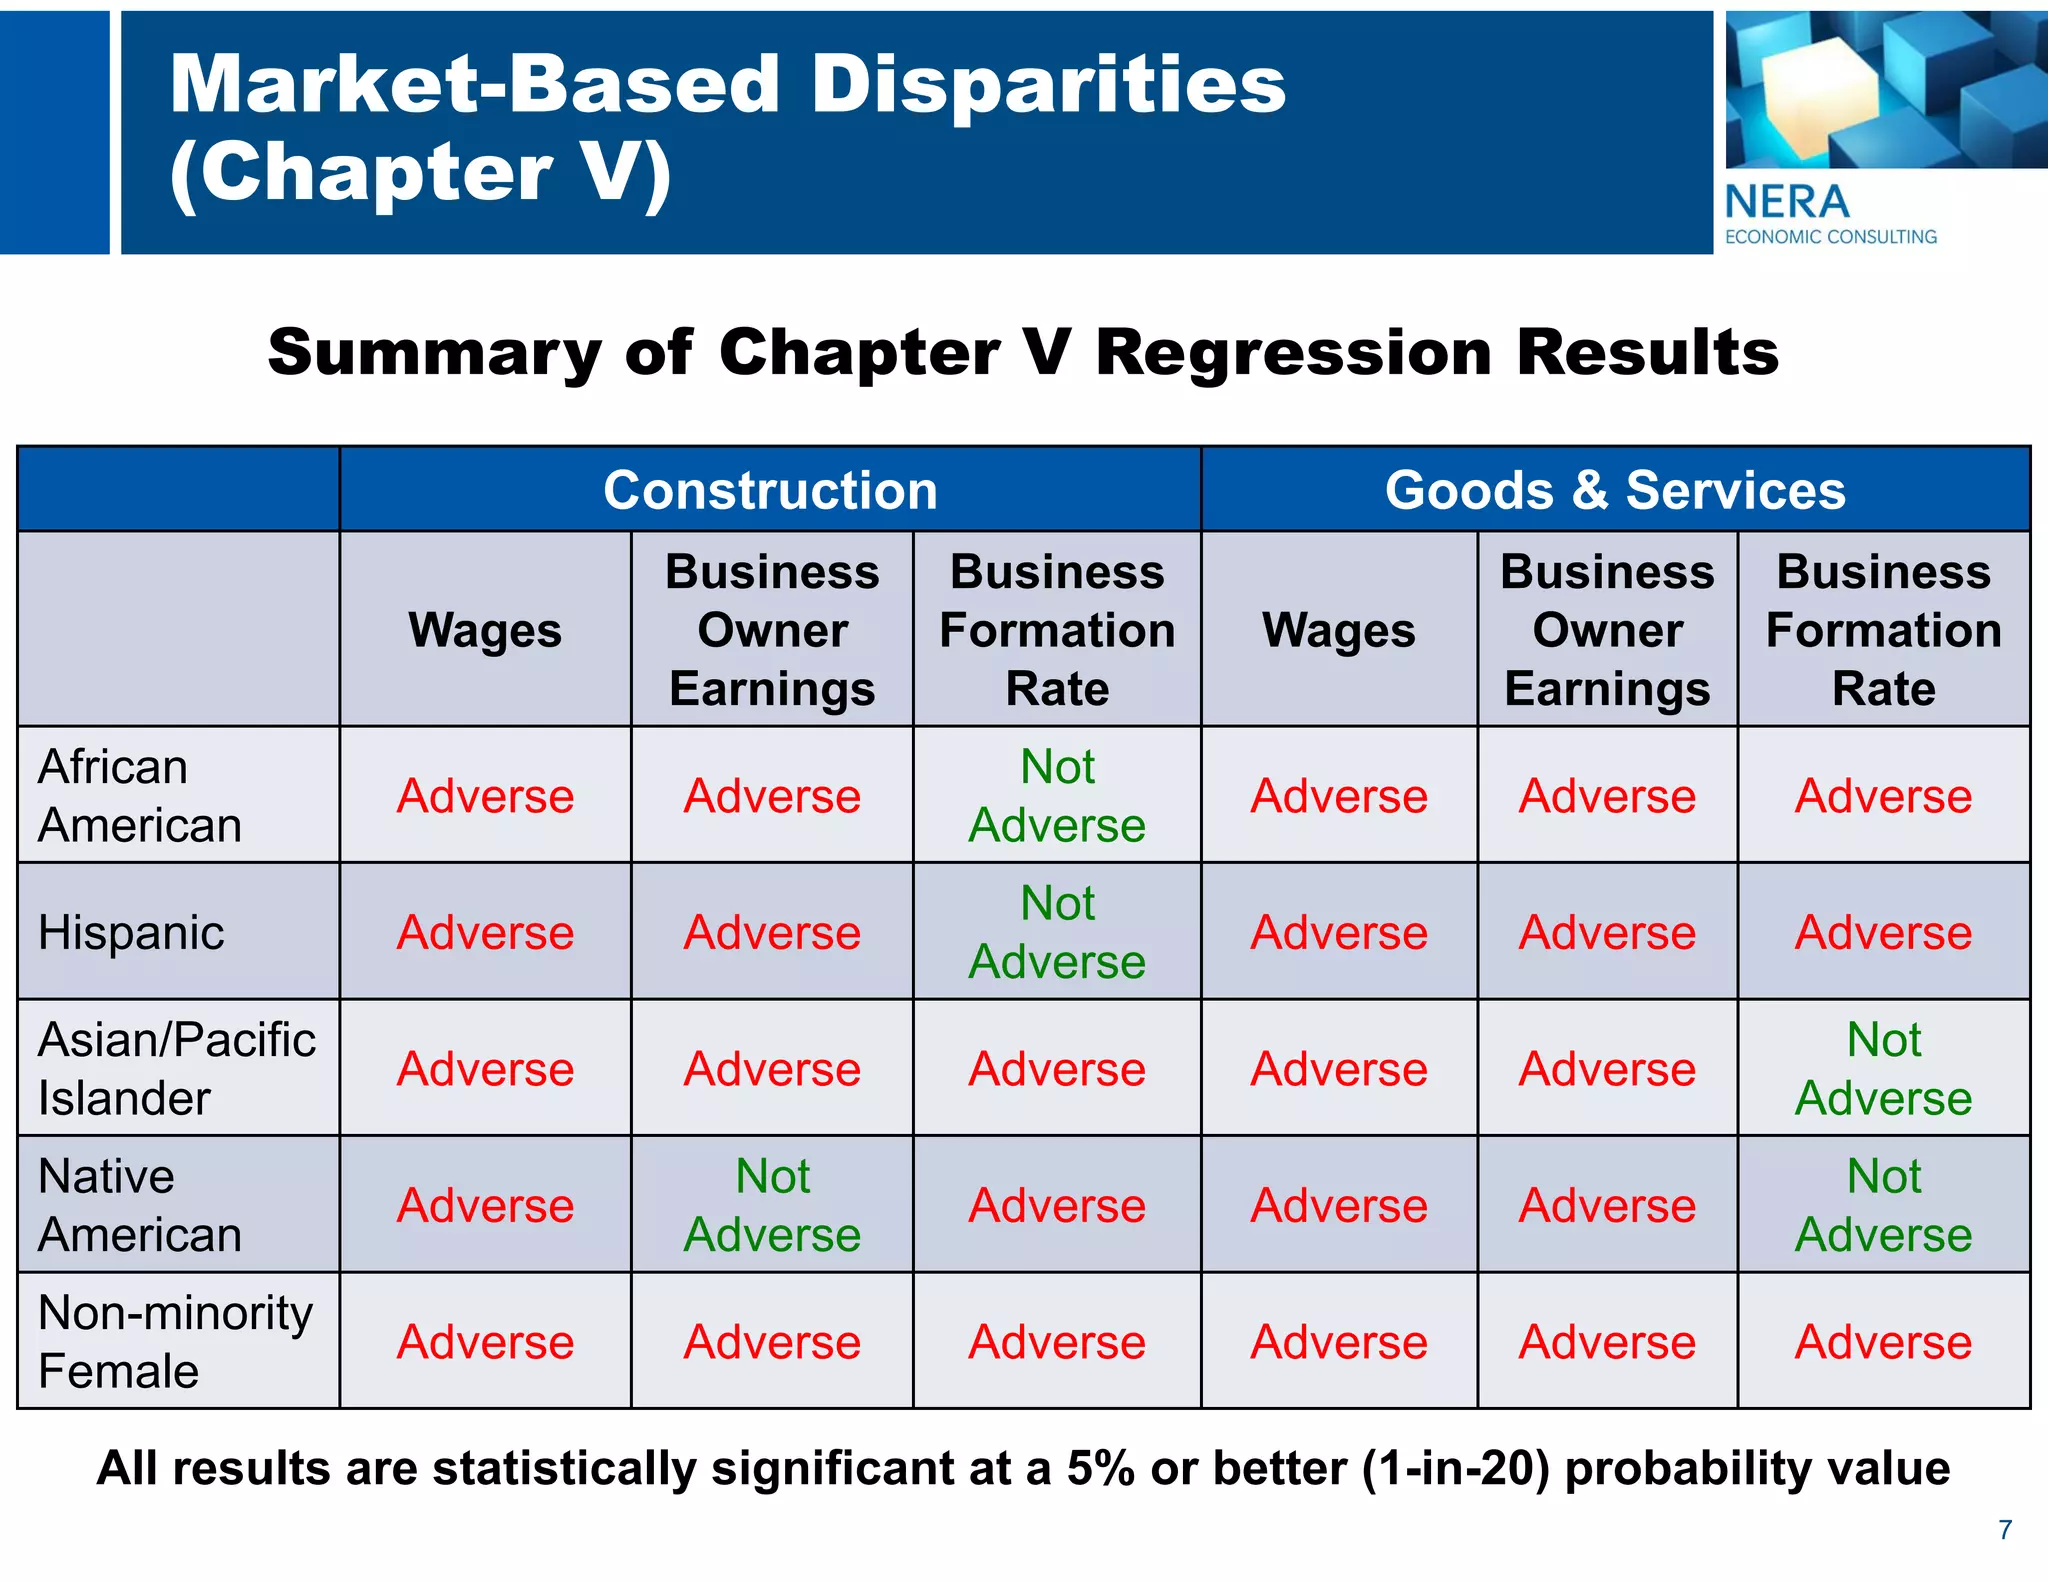

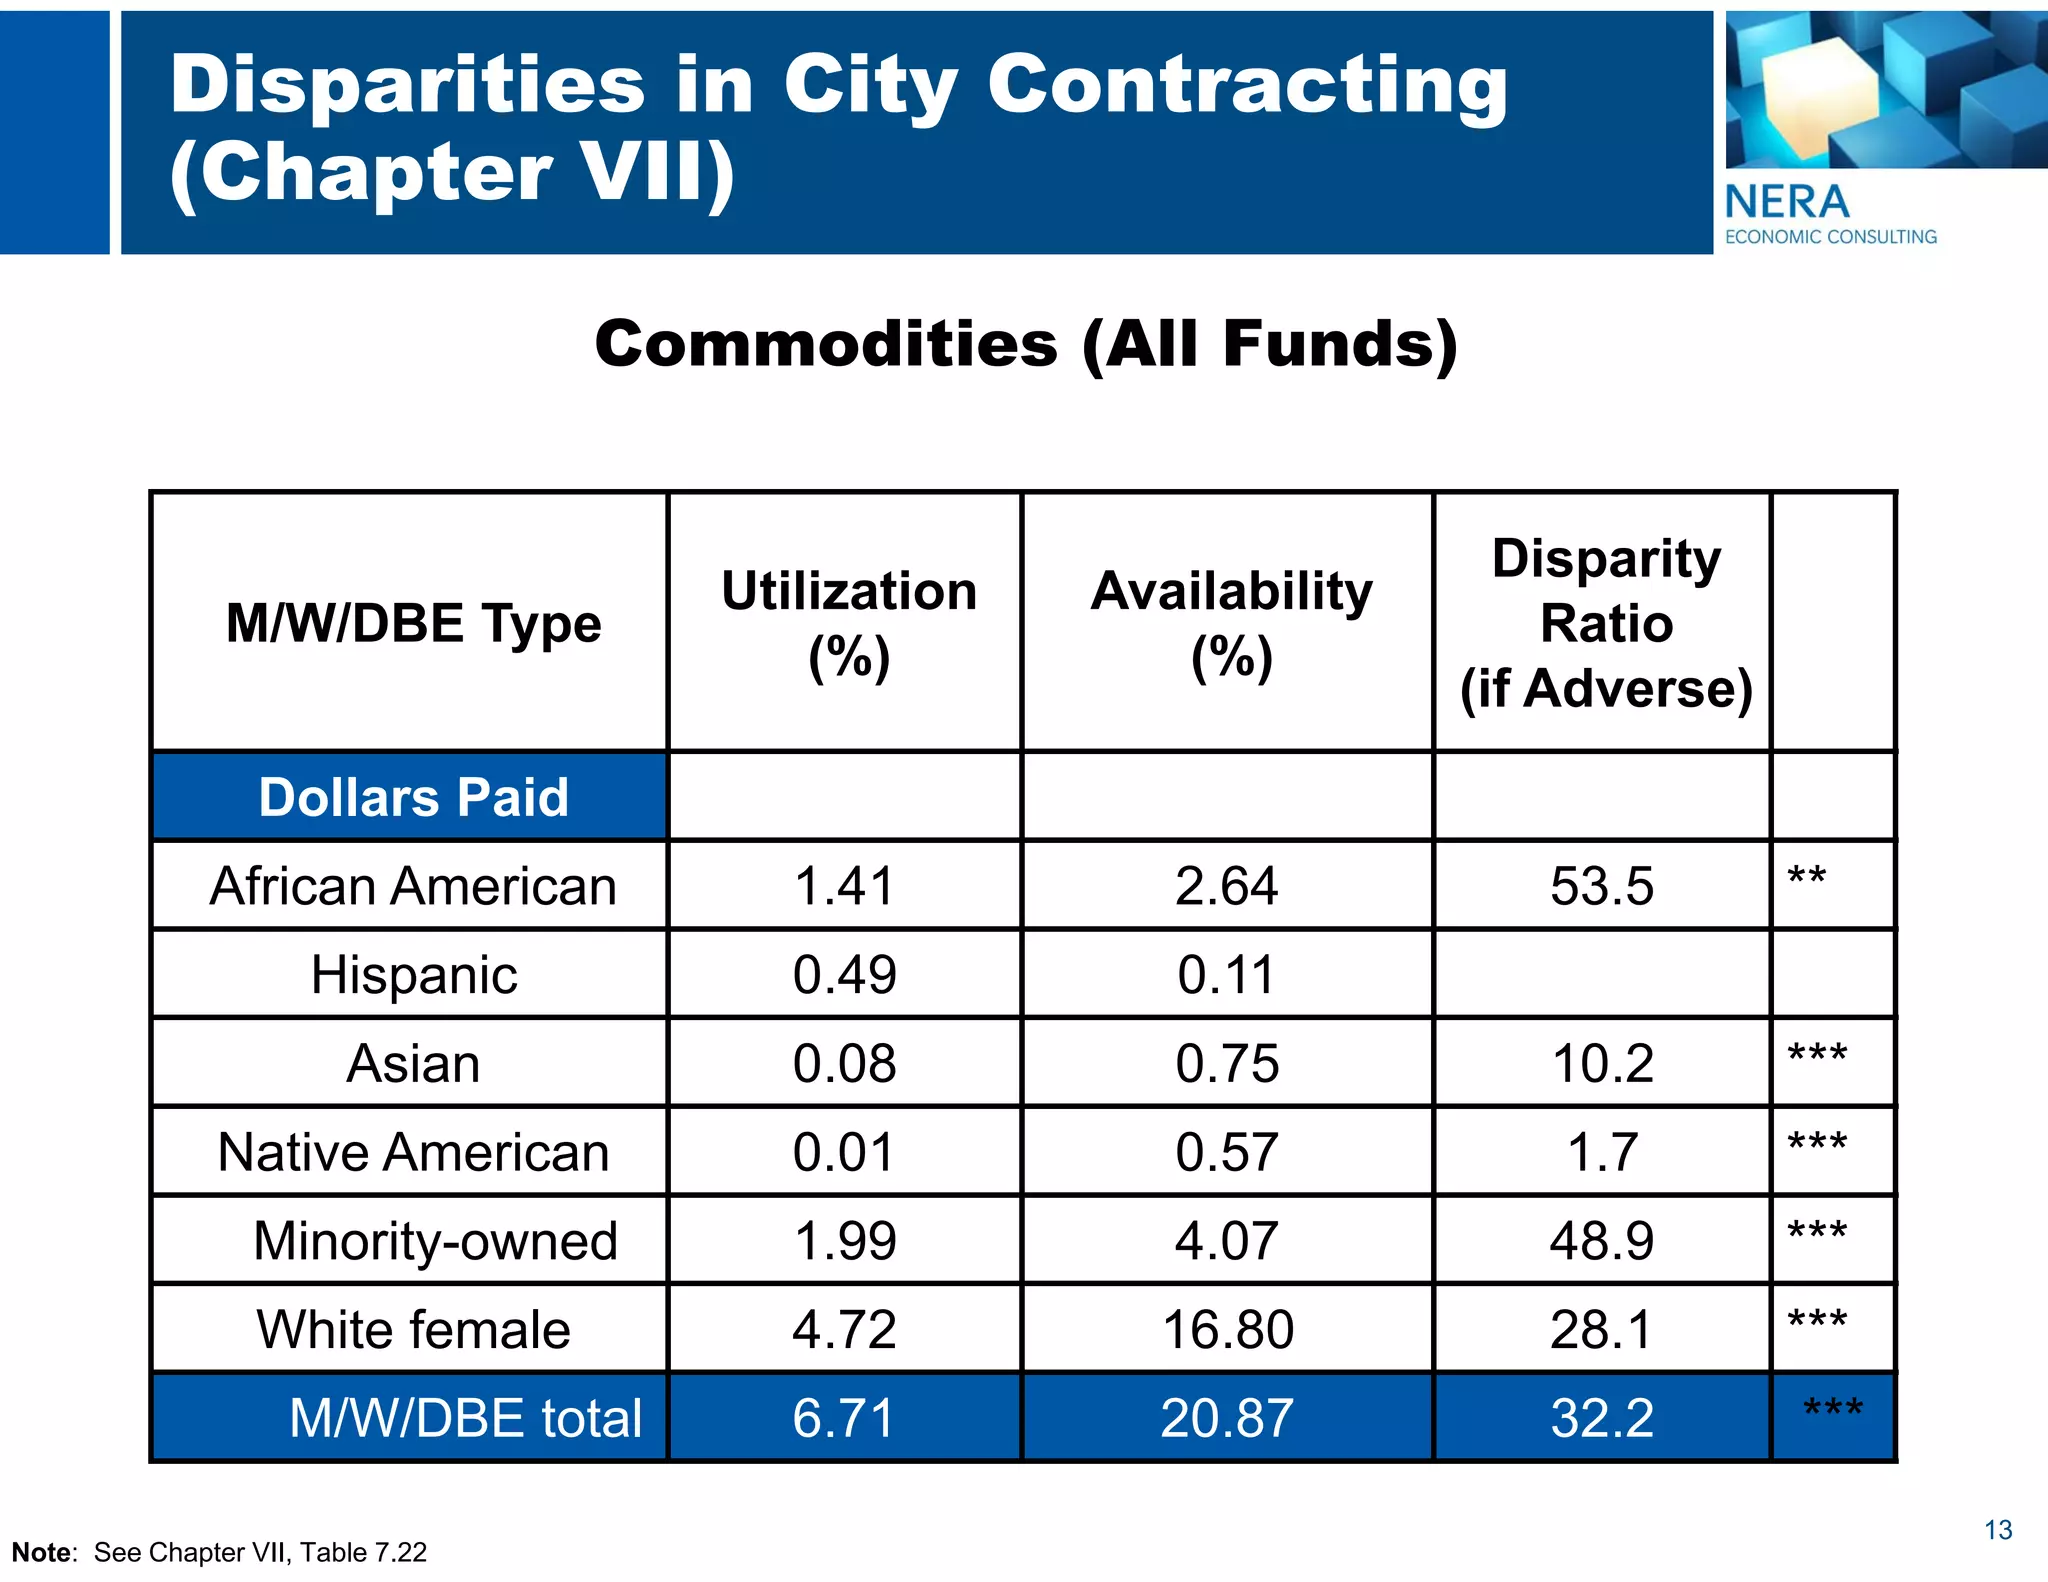
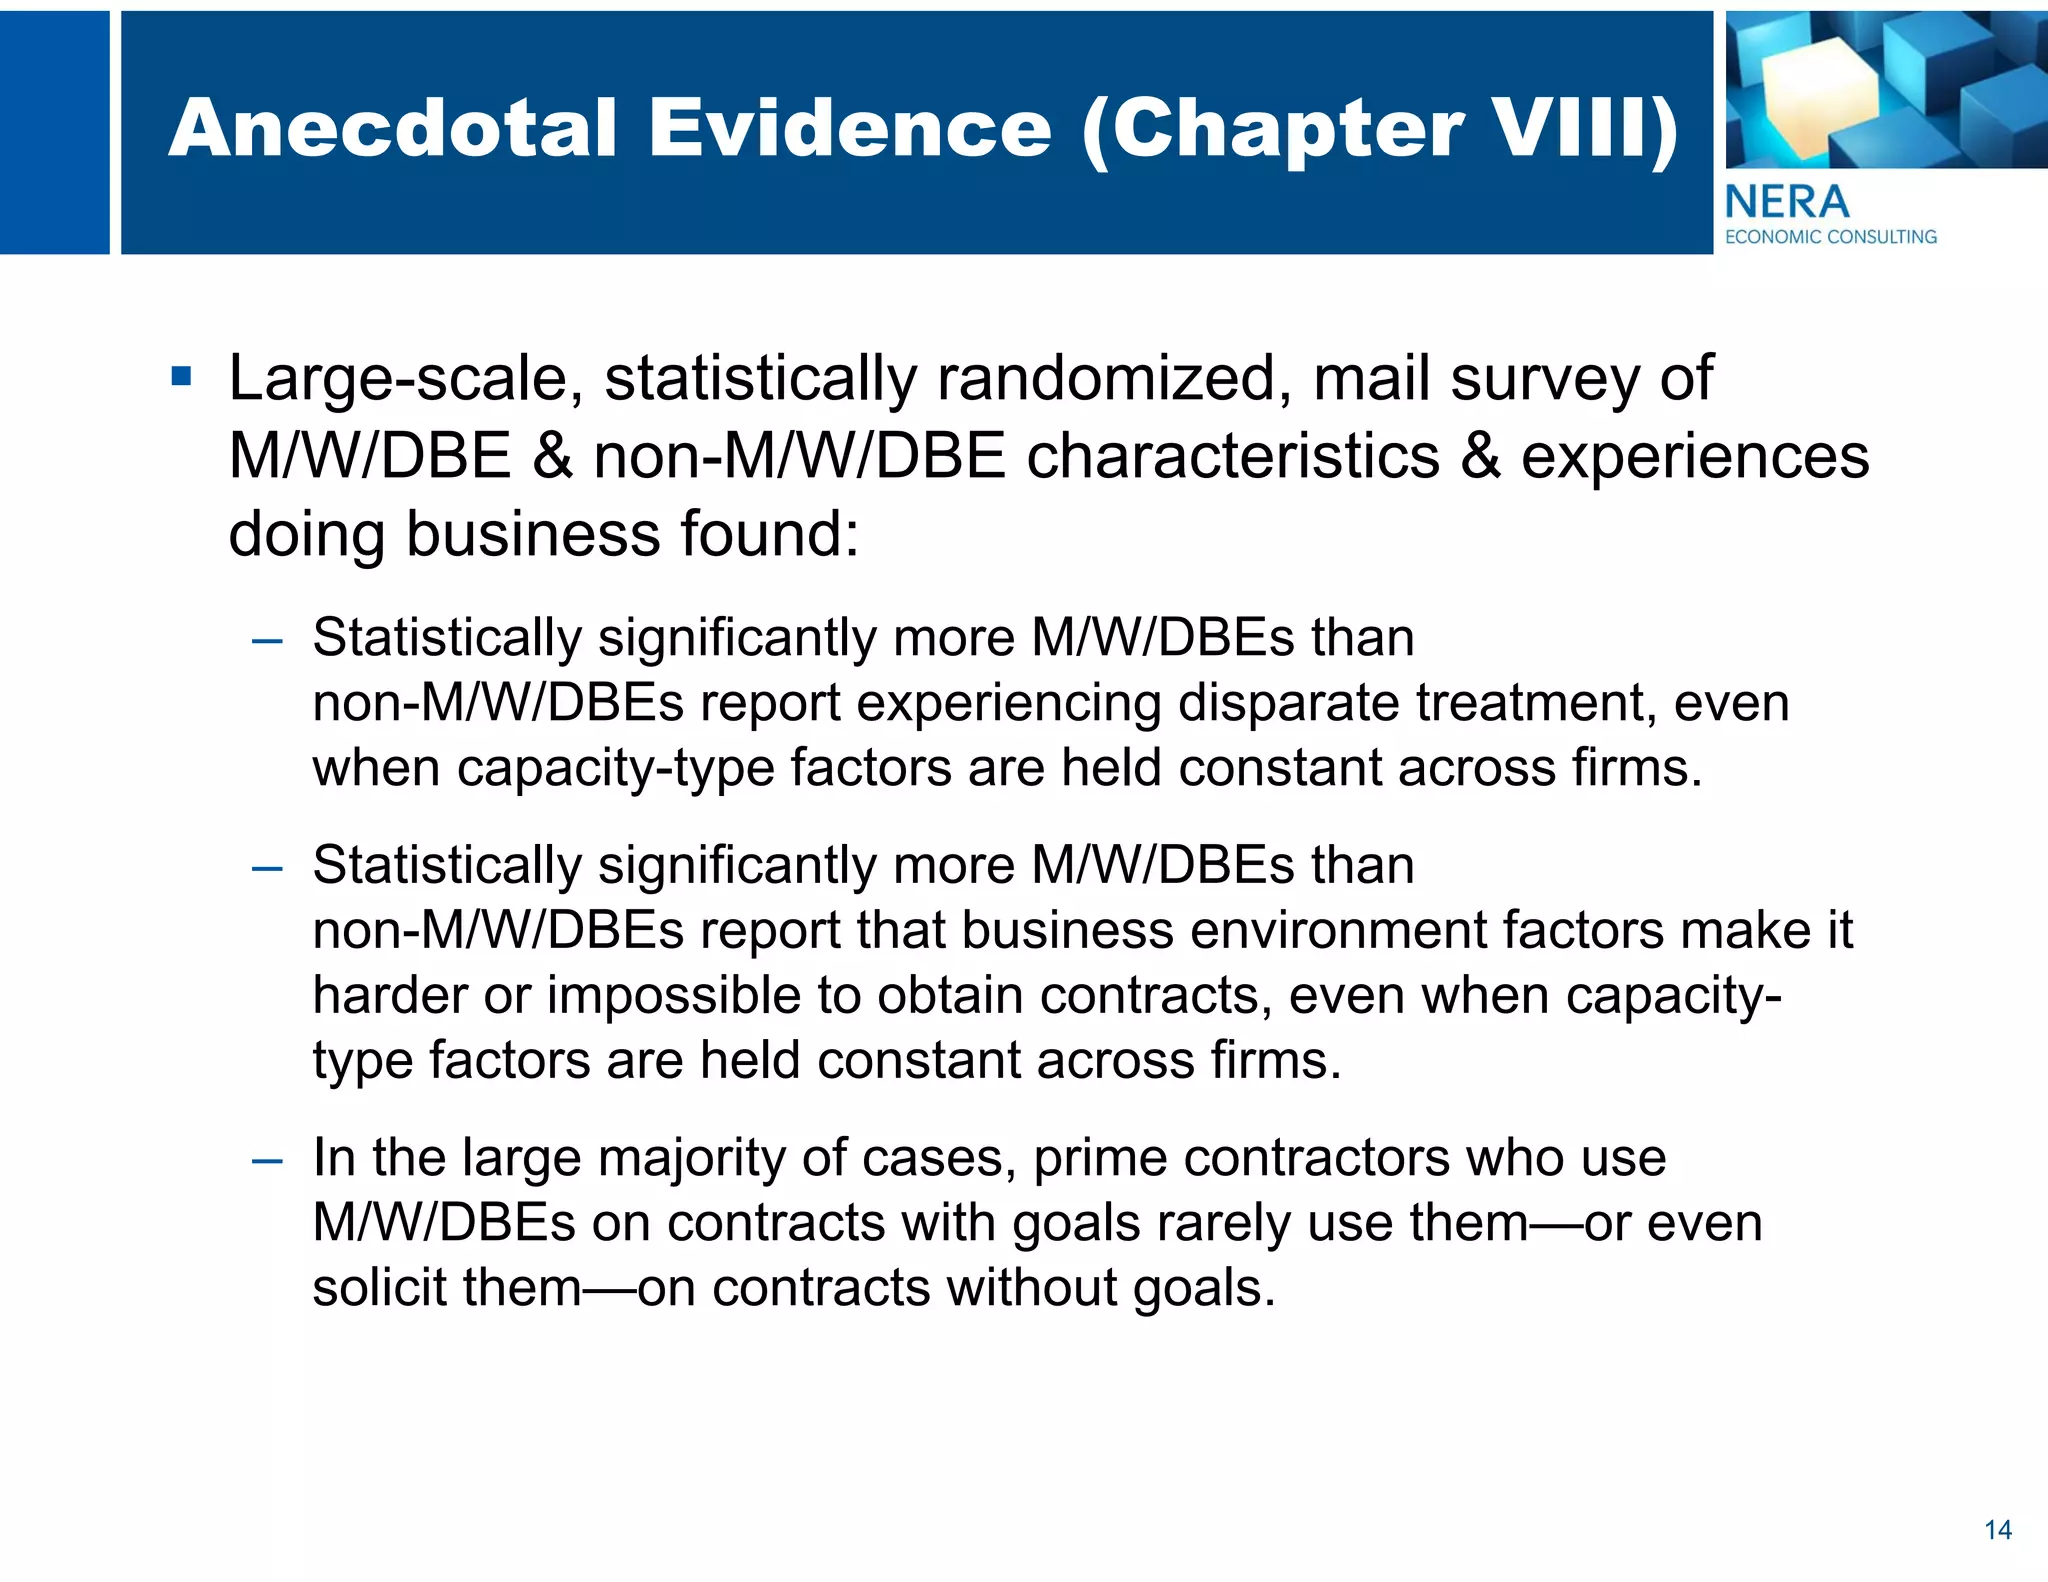
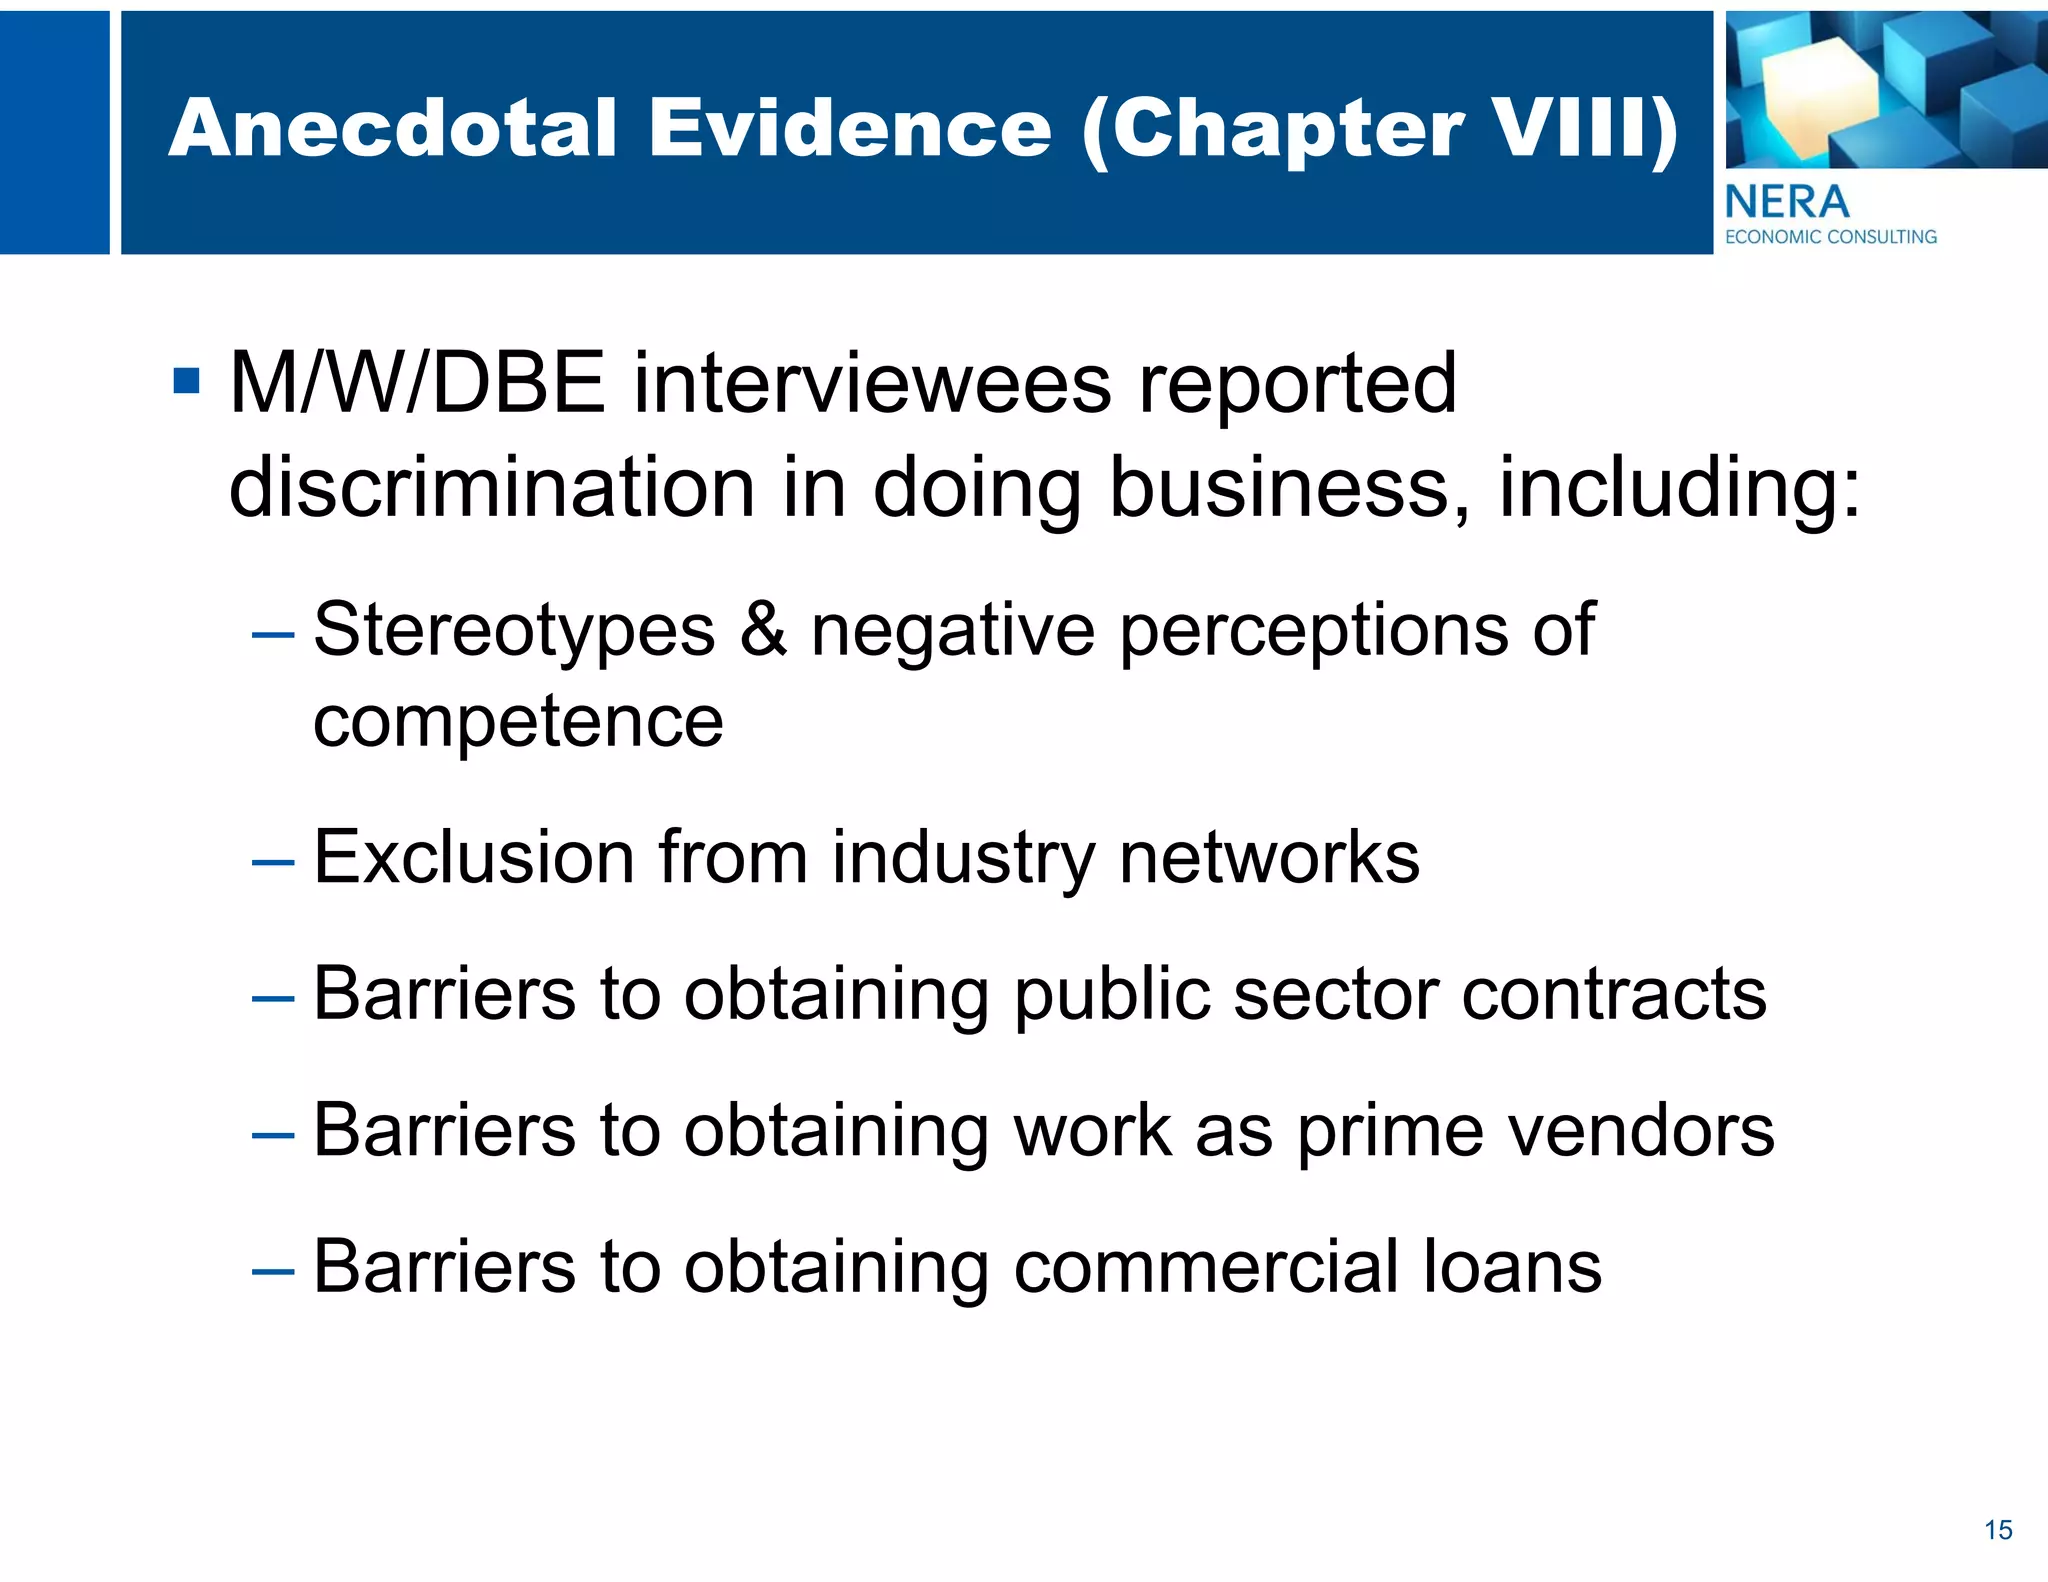


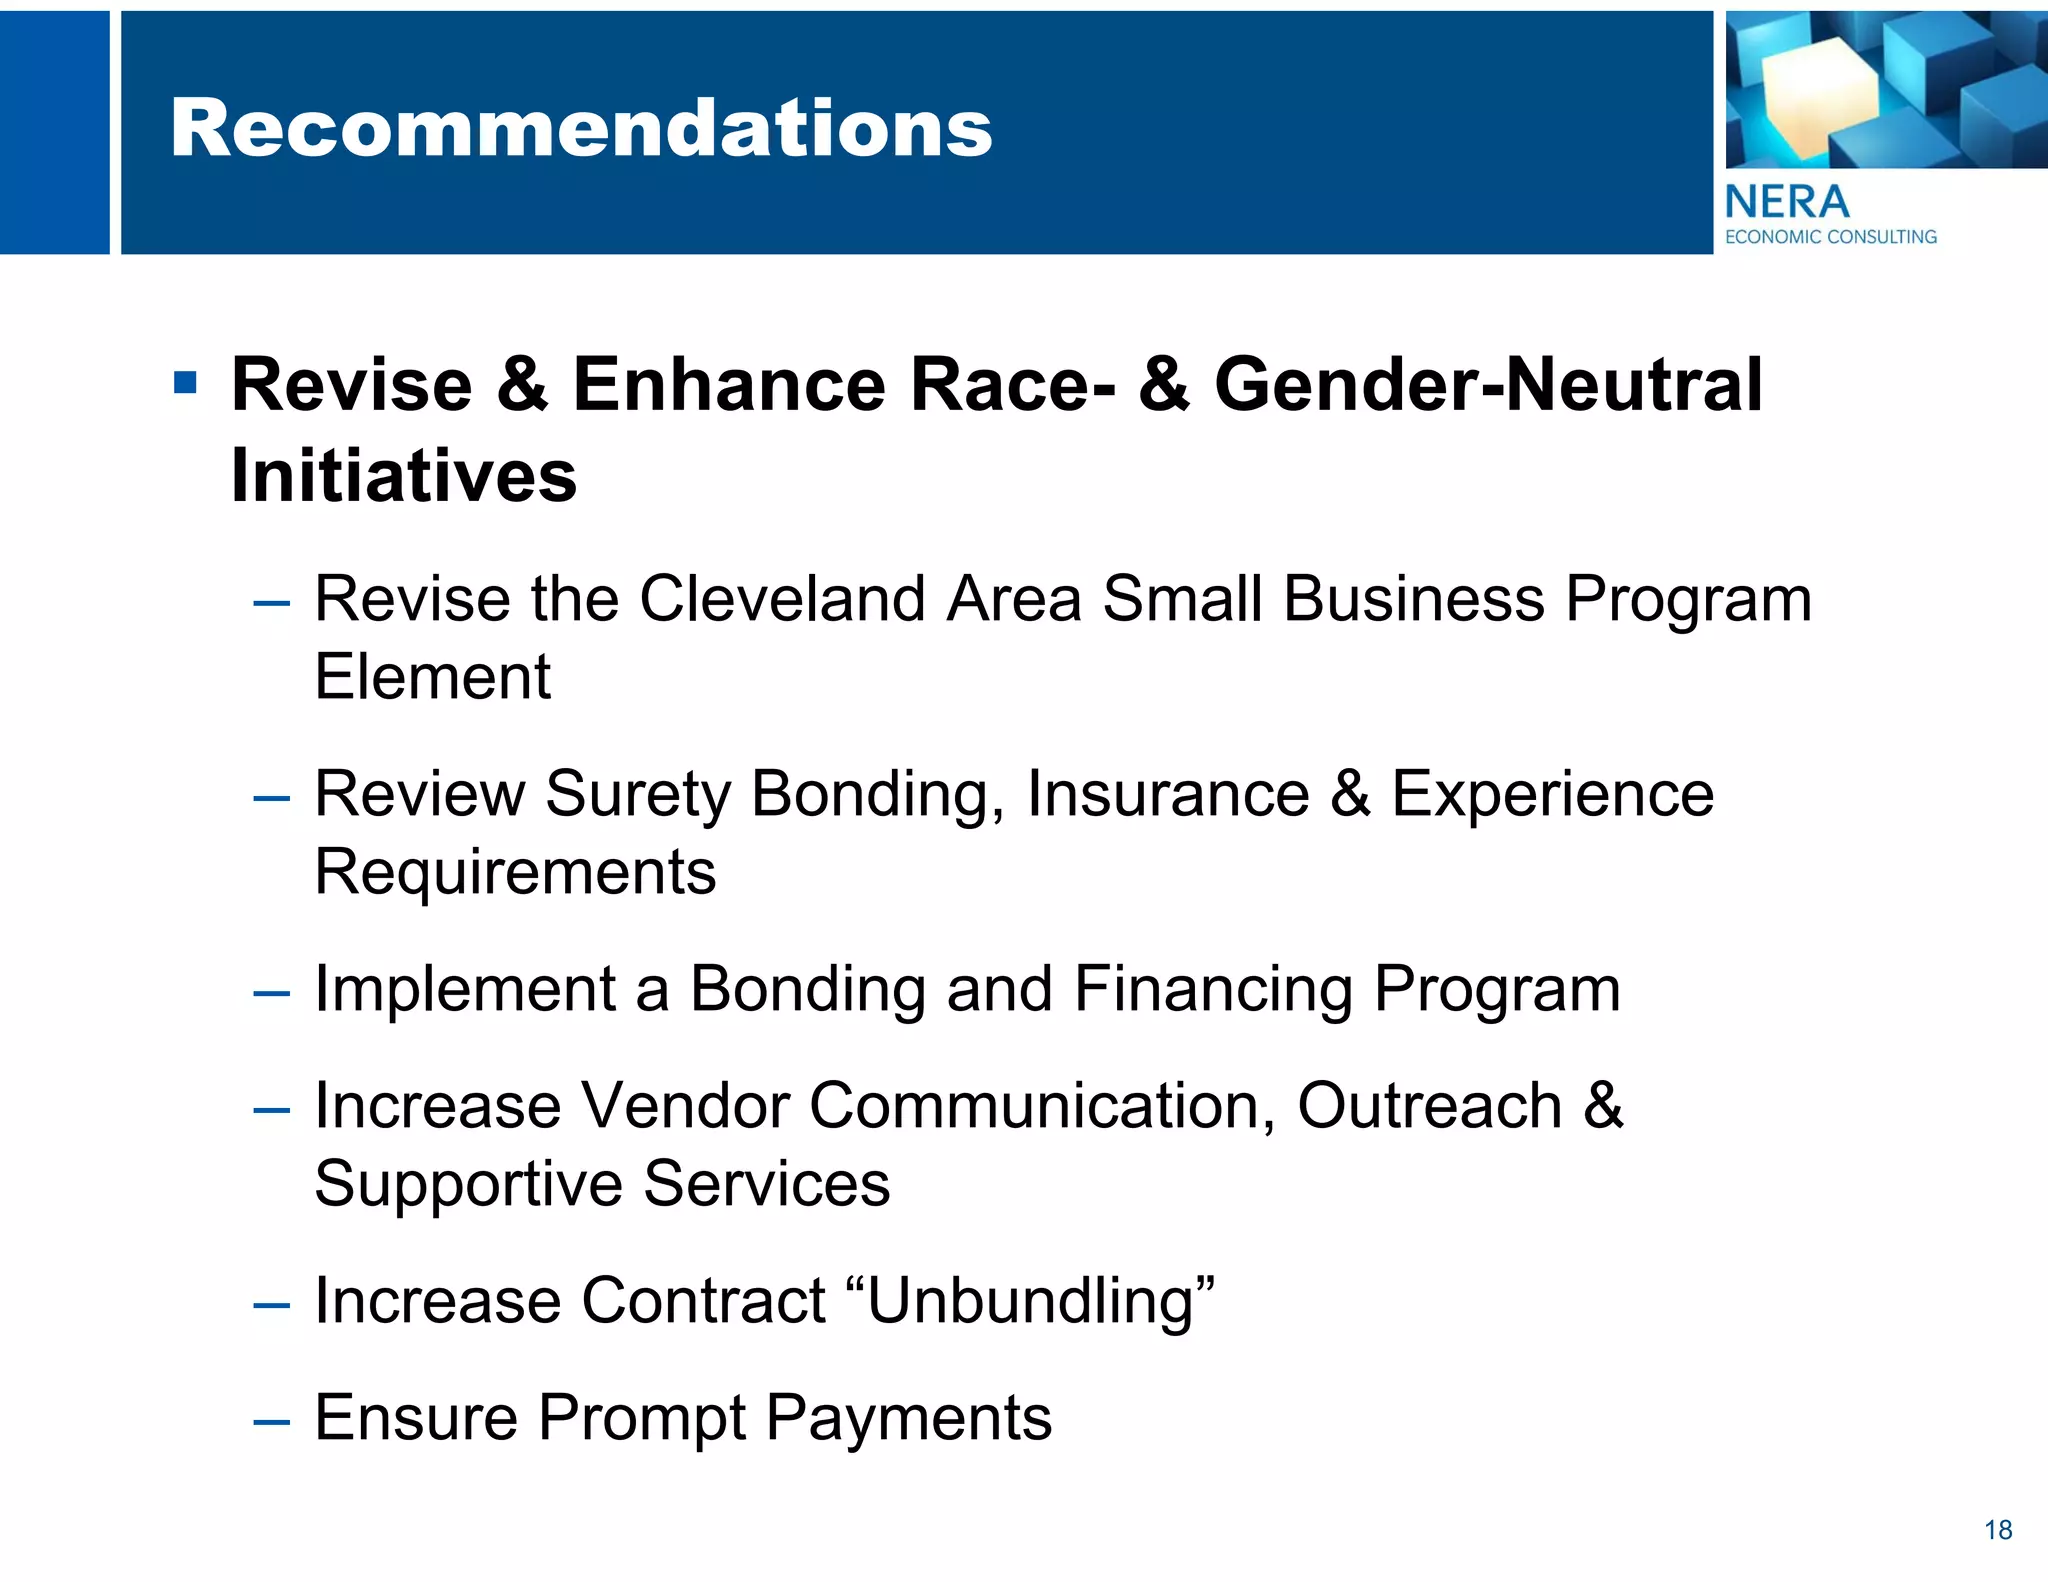

This disparity study examined contracting data and market conditions in Cleveland to determine if there is evidence of discrimination against minority- and women-owned firms. The study found disparities in many areas, including lower utilization rates, wages, business earnings, and loan approval rates. It provided recommendations to enhance current race- and gender-neutral initiatives and adopt new narrowly tailored race- and gender-conscious policies.


