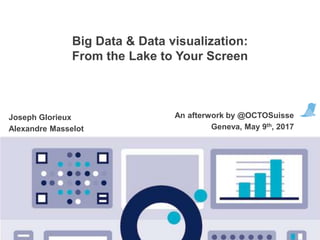
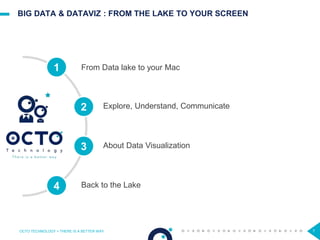
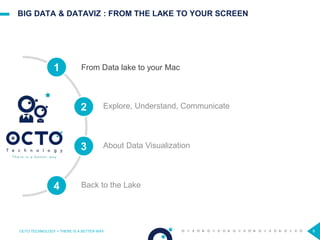

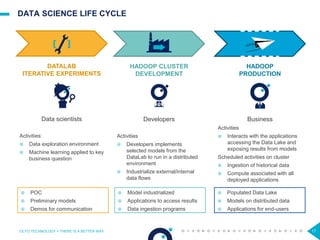
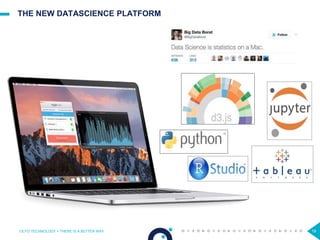
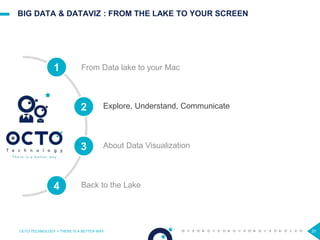
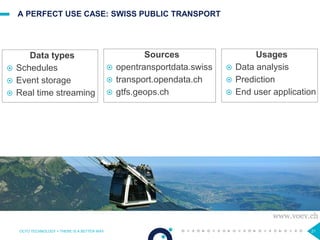
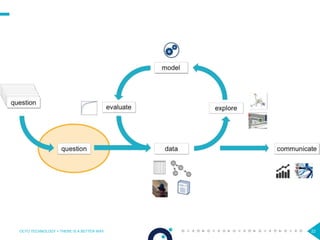

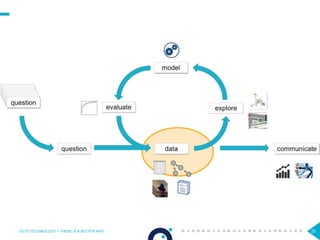
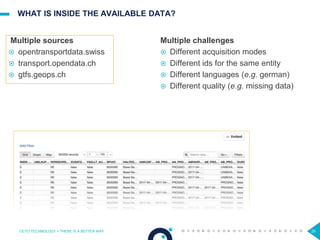
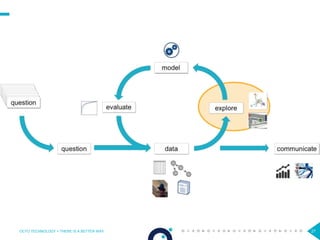
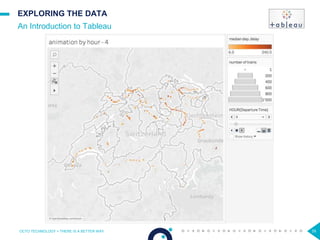
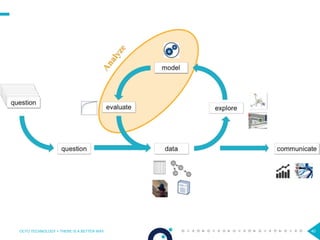
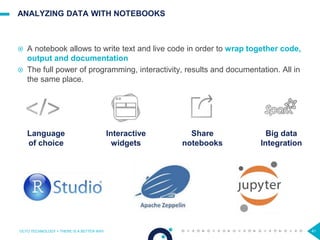
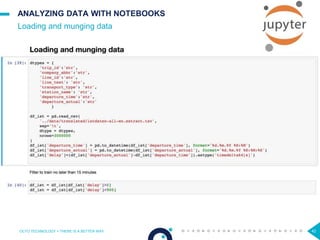
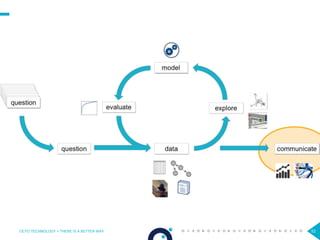
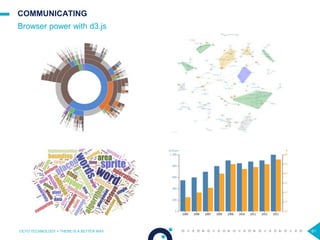
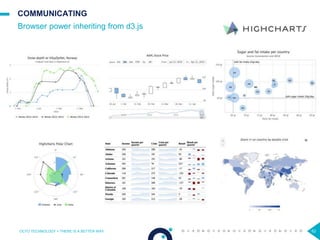
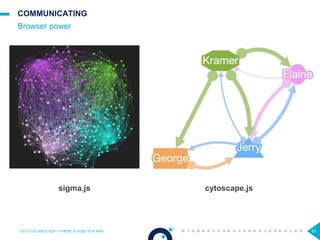
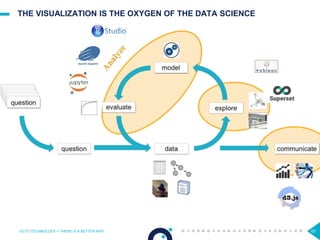
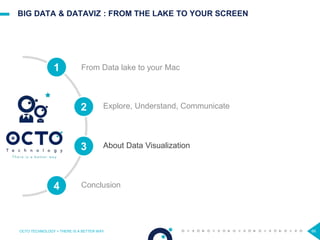
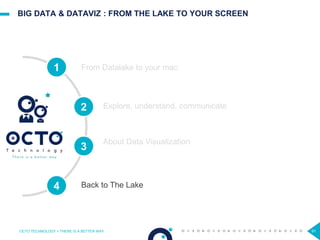


This document discusses a presentation on big data and data visualization from lake to screen. It covers exploring data in a data lake using tools like Tableau and Jupyter notebooks. Models can be built to predict things like train delays. Visualizations are then created using technologies like D3.js to communicate insights from the data and models. The goal is to extract value from large, raw data sources through the entire data science process from exploration to communication.