This document summarizes best practices in cycling from leading European cities and around the world. It describes policies that have increased bicycle usage and presents methods for evaluating cycling infrastructure and policies. The document provides indicators for benchmarking cities' cycling levels and suggestions for assessment methodologies. It aims to help increase cycling in the BICY project region in Central Europe. Key topics covered include cycling infrastructure design, legal and policy barriers, public transportation integration, education, and the diversity of bicycles and cyclists that need to be accommodated.
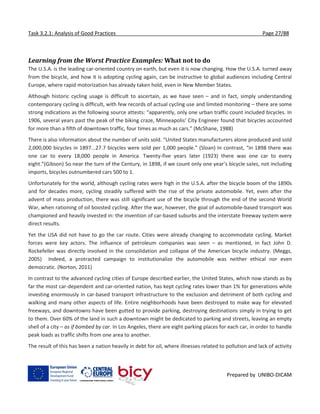
![Task 3.2.1: Analysis of Good Practices Page 29/88
Prepared by UNIBO-DICAM
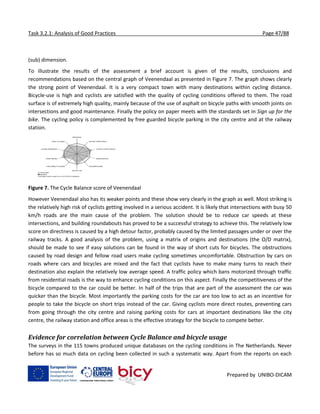
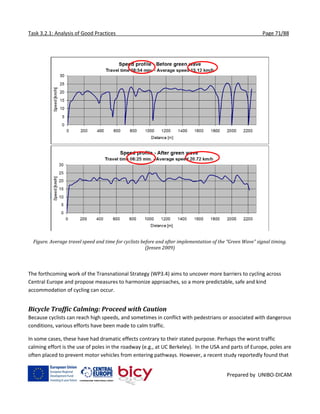
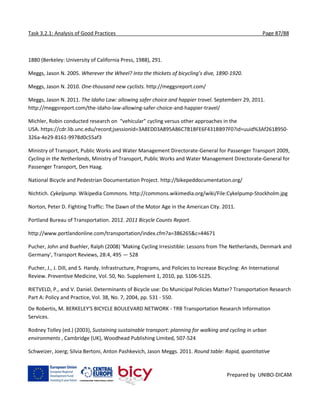
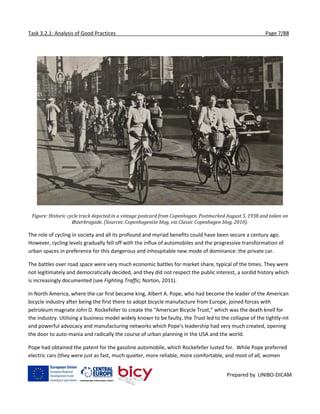
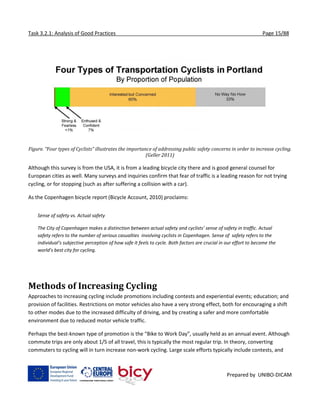
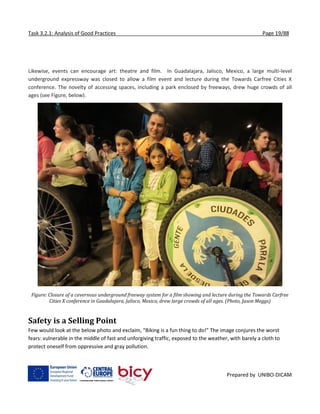
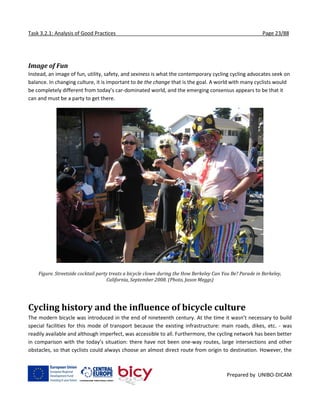
Source: Cycling in the Netherlands 2009 [3]
Figure 2. Bicycle share in all journeys in some other European countries
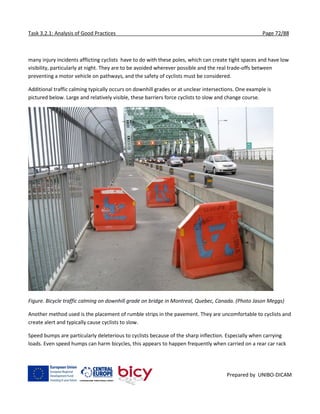
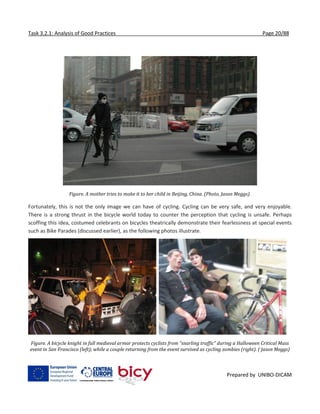
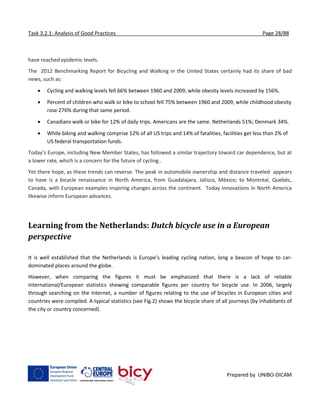
Some statistics claim that the Netherlands is the only European nation with more bicycles than people (Figure
3). On average, the Dutch own 1.11 bicycles per person and the number of bicycles sold in the Netherlands is
also high: 1.2 million bicycles in 2005, for 16 million residents. In absolute terms, more bicycles are only sold in
various European countries with considerably higher populations: 4.9 million bicycles in Germany (for 82 million
inhabitants), 3.2 million bicycles sold in France and 2.5 million in Great Britain (both 60 million inhabitants).](https://image.slidesharecdn.com/7cc5dcb1-c239-48a7-97f3-a23c5bcf5901-151208213534-lva1-app6892/85/BICY-Best-Practices-in-Bicycle-Planning-29-320.jpg)
![Task 3.2.1: Analysis of Good Practices Page 30/88
Prepared by UNIBO-DICAM
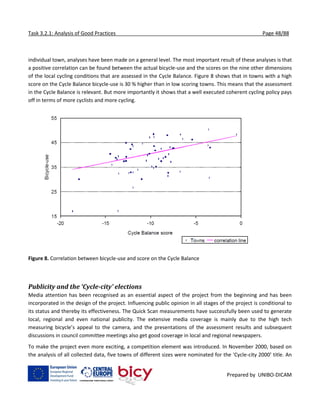
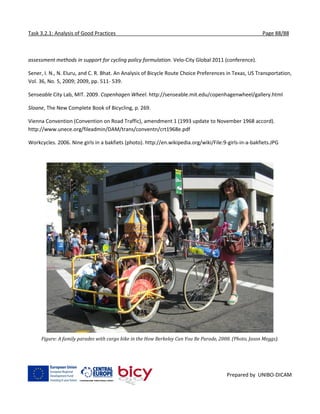
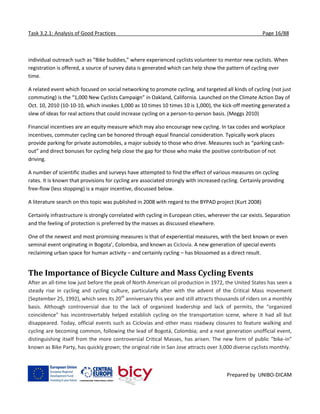
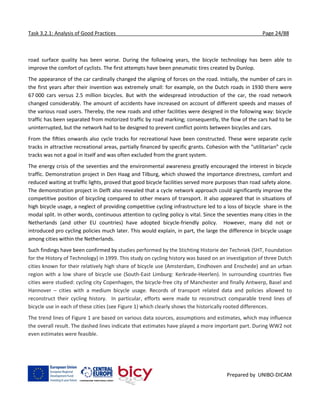
Source: Cycling in the Netherlands 2009 [3]
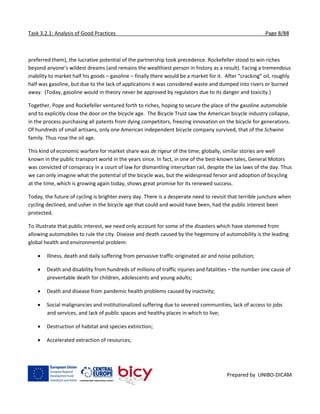
Figure 3. Bicycle ownership in a number of European countries in 2004
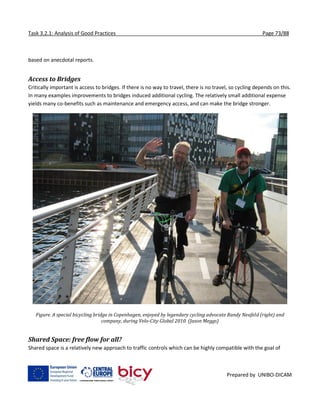
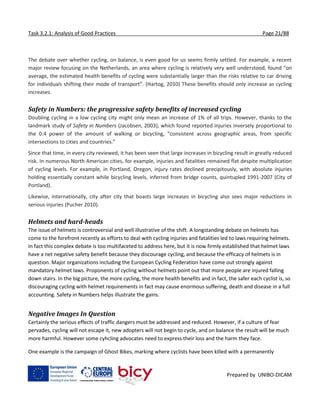
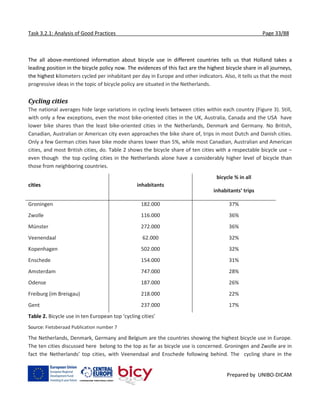
Averaging over the entire population of each country, the European Conference of the Ministers of Transport
(2004) estimated that per capita cycling per day ranges from 0.1 km in Spain, Greece and Portugal to 2.5 km in
the Netherlands (Figure 4). Denmark (1.6 km) and Germany (0.9 km) immediately follow the Netherlands in
distance cycled per inhabitant. The USA and the UK are both at the low end of the spectrum, averaging 0.1 km
and 0.2 km of cycling per person per day, respectively.](https://image.slidesharecdn.com/7cc5dcb1-c239-48a7-97f3-a23c5bcf5901-151208213534-lva1-app6892/85/BICY-Best-Practices-in-Bicycle-Planning-30-320.jpg)
![Task 3.2.1: Analysis of Good Practices Page 31/88
Prepared by UNIBO-DICAM
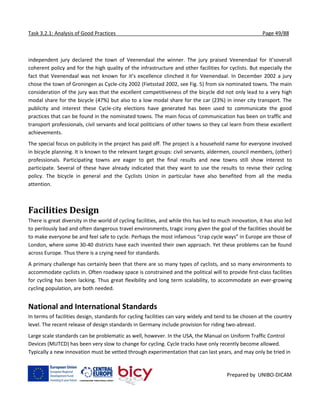
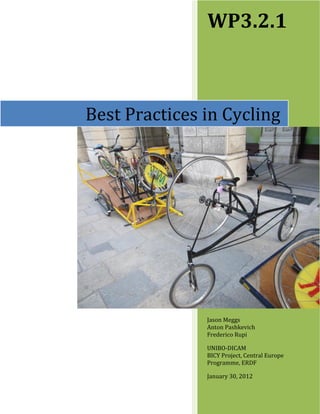
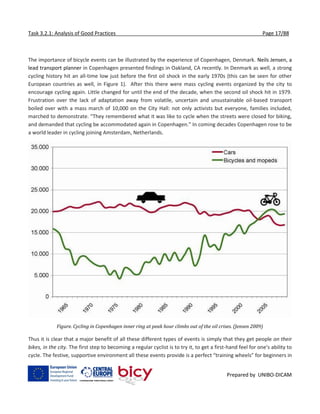
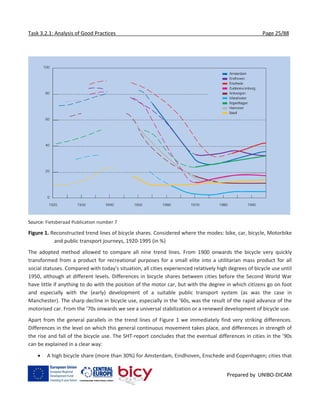
Source: Pucher, John and Buehler, Ralph (2008) [1]
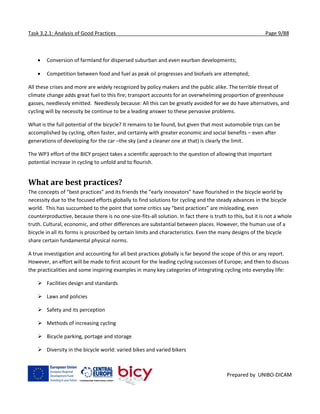
Figure 4. Kilometers cycled per inhabitant per day in Europe and the USA
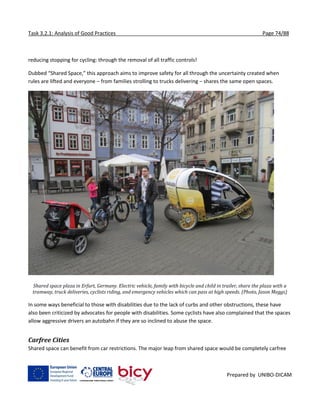
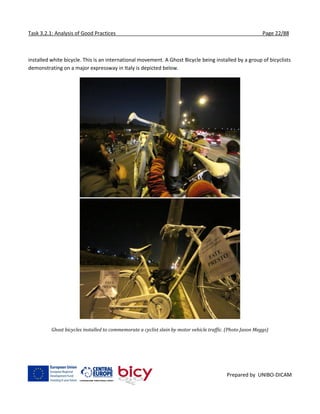
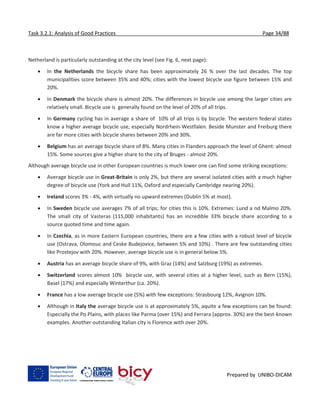
Analysis of national aggregate data for the past few decades confirms a rebound in cycling in the Netherlands,
Denmark and Germany since the 1970s. As shown in Figure 5, average daily kilometres cycled per inhabitant
rose in all three countries from 1978 to 2005: from 0.6 to 1.0 in Germany, from 1.3 to 1.6 in Denmark and from
1.7 to 2.5 in the Netherlands. In both the Netherlands and Denmark, the strongest growth in cycling was from
the mid-1970s until the early 1990s. By comparison, average daily kilometers cycled in the UK have fallen almost
continuously since 1978, declining by a third: from 0.3 to 0.2.](https://image.slidesharecdn.com/7cc5dcb1-c239-48a7-97f3-a23c5bcf5901-151208213534-lva1-app6892/85/BICY-Best-Practices-in-Bicycle-Planning-31-320.jpg)
![Task 3.2.1: Analysis of Good Practices Page 32/88
Prepared by UNIBO-DICAM
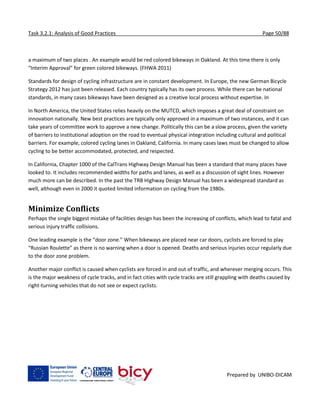
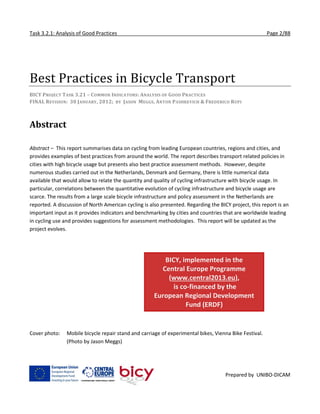
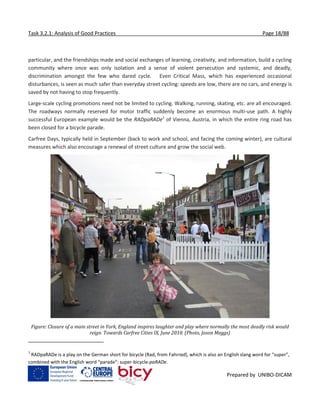
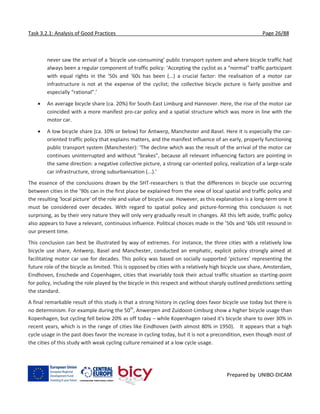
Source: Pucher, John and Buehler, Ralph (2008) [1]
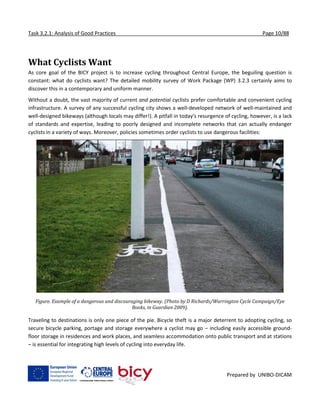
Figure 5. Trend in kilometers cycled per inhabitant per day in the Netherlands, Denmark, Germany and the UK
(1978–2005).
As all the graphs showed us, the country of the highest bicycle use in the world is the Netherland. Table 1
presents the data about the development of passenger kilometers by bicycles and by car in the Netherlands.
However, the numbers of deceased cyclists and car occupants are reduced with increase of the amount of
passenger kilometers which is indicated the good road safety policy during these years.
Table 1. Number of passenger kilometers and number of deceased cyclists and car occupants in 1980 and 2001
1980 2001 2005
Passenger km by bicycles 9,9 billion 13,1 billion 14,4 billion
Passenger km by car 107,1 billion 141,6 billion 148,8 billion
No. of deceased cyclists 426 195 181
No. of deceased car occupants 910 477 371](https://image.slidesharecdn.com/7cc5dcb1-c239-48a7-97f3-a23c5bcf5901-151208213534-lva1-app6892/85/BICY-Best-Practices-in-Bicycle-Planning-32-320.jpg)
![Task 3.2.1: Analysis of Good Practices Page 35/88
Prepared by UNIBO-DICAM
Source: Pucher, John and Buehler, Ralph (2008) [1]
Figure 6. Bike share of trips in selected cities in the Netherlands, Denmark, Germany, the UK, Canada, the USA
and Australia (2000–2005). Note: UK data are for counties.](https://image.slidesharecdn.com/7cc5dcb1-c239-48a7-97f3-a23c5bcf5901-151208213534-lva1-app6892/85/BICY-Best-Practices-in-Bicycle-Planning-35-320.jpg)

![Task 3.2.1: Analysis of Good Practices Page 41/88
Prepared by UNIBO-DICAM
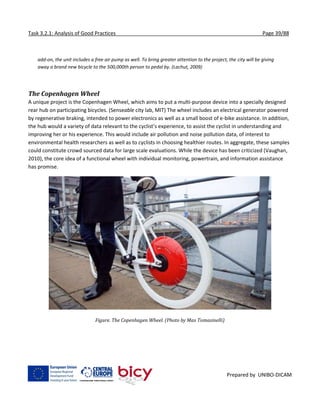
In the BYPAD Manual, the rankings are defined:
Level 0: no cycling
Level 1: Ad-hoc approach
Level 2: Isolated approach
Level 3: System oriented approach
Level 4: Integrated approach
Rankings may be given as integers (with a fraction, e.g., 3.75) so are not limited to only five outcomes per
category/question.
A graphical representation of averages for many BYPAD-evaluated cities is provided below (Figure).
Figure. Official BYPAD Audit rankings for numerous cities. [2]
The Cycle Balance Evaluation Method
History and Aims](https://image.slidesharecdn.com/7cc5dcb1-c239-48a7-97f3-a23c5bcf5901-151208213534-lva1-app6892/85/BICY-Best-Practices-in-Bicycle-Planning-41-320.jpg)
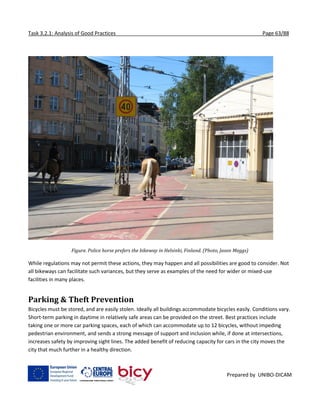
![Task 3.2.1: Analysis of Good Practices Page 42/88
Prepared by UNIBO-DICAM
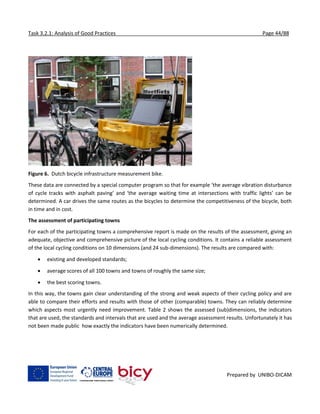
The Dutch Cyclists’ Union (Fietsersbond) asserts the interests of cyclists in the Netherlands and is dedicated to
achieve more and better conditions for cycling. It strives to make the bicycle more competitive with other
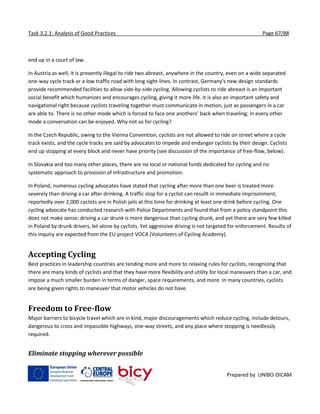
modes of transport over short distances. In terms of time, as well as in terms of safety and comfort. Their main
measures of cycling infrastructure are: directness, attractiveness, comfort, safety of route and a coherent cycling
network. [5]
As a result of the high bicycle-use, Dutch government, private organisations and companies invest a lot of time
and money in support of cycling. There are for example over 20 000 km of bicycle lane and bicycle path along
Dutch roads and the capacity of bicycle parking facilities at railway stations alone is almost 300 000. Strangely
enough the effectiveness and efficiency of all these efforts have never been assessed in a quantitative fashion.
In order to fill this gap, the Fietsersbond developed the Cycle Balance (Fietsbalans). This benchmarking project is
funded by the Ministry of Transport, Public Works and Water Management. Impartial assessment of local cycling
conditions is used as strategy to improve local cycling policies. [5]
The project, which started in the summer of 1999, has two main objectives:
The primary objective of the project is to stimulate local authorities to adopt a (still) better cycling
policy, using benchmarking techniques. The aim of benchmarking is to learn from others by comparing
the performance of one town to that of others and look for best practices.
The secondary objective of the project is to enhance the position and strength of the local Fietsersbond
branches. As most decisions that influence cycling conditions are made on a local level, it is important
that the Fietsersbond local branches are recognized by local councils and civil servants as knowledgeable
and influential partners that represent the interests of cyclists. Therefore, the Cycle Balance is used to
establish a cooperative environment in which discussion is based on facts rather than emotions.
By 2002 the project has been executed in 115 towns which include all Dutch towns with over 100 000
inhabitants and cover almost 50 % of all Dutch cyclists.
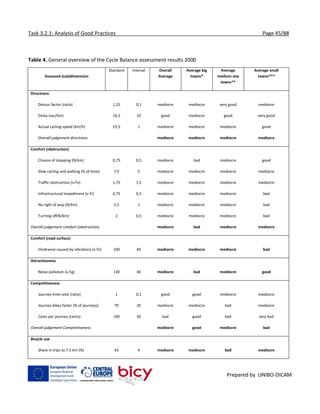
The four surveys of the Cycle Balance
The Cycle Balance assesses ten different dimensions (and 24 sub-dimensions) of the local conditions for cyclists
(Table 3). These dimensions provide a good mixture of policy results, policy effects and policy process.](https://image.slidesharecdn.com/7cc5dcb1-c239-48a7-97f3-a23c5bcf5901-151208213534-lva1-app6892/85/BICY-Best-Practices-in-Bicycle-Planning-42-320.jpg)