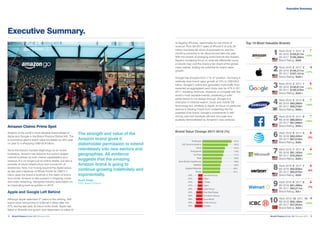
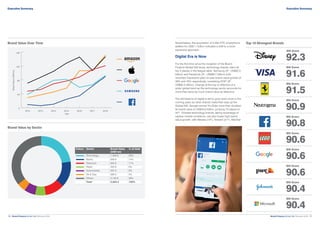
Amazon overtook Apple and Google to become the world's most valuable brand, with its brand value increasing 42% to $150.8 billion. Although Apple held onto second place, its future looks uncertain as it has become overly reliant on iPhone sales. Google dropped to third as its 10% brand value growth was relatively slow, and it lacks the scale and audacity of Amazon's new ventures. Overall, technology brands continue to dominate the ranking, comprising over half of the top 10 most valuable brands.


![Brand Finance Global 500 February 2018 7.Brand Finance Global 500 February 20186.
Definitions.
Definitions.
Brand Value
+ Enterprise Value
The value of the entire enterprise, made
up of multiple branded businesses.
Where a company has a purely mono-
branded architecture, the ‘enterprise value’
is the same as ‘branded business value’.
+ Branded Business Value
The value of a single branded business
operating under the subject brand.
A brand should be viewed in the context of
the business in which it operates. Brand
Finance always conducts a branded
business valuation as part of any brand
valuation. We evaluate the full brand value
chain in order to understand the links
between marketing investment, brand-
tracking data, and stakeholder behaviour.
+ Brand Contribution
The overall uplift in shareholder value
that the business derives from owning
the brand rather than operating a
generic brand.
The brand values contained in our league
tables are those of the potentially
transferable brand assets only, making
‘brand contribution’ a wider concept. An
assessment of overall ‘brand contribution’ to
a business provides additional insights to
help optimise performance.
+ Brand Value
The value of the trade mark and
associated marketing IP within the
branded business.
Brand Finance helped to craft the
internationally recognised standard on
Brand Valuation – ISO 10668. It defines
brand as a marketing-related intangible
asset including, but not limited to, names,
terms, signs, symbols, logos, and designs,
intended to identify goods, services or
entities, creating distinctive images and
associations in the minds of stakeholders,
thereby generating economic benefits.
[Alphabet Inc.]
[Google]
Brand
Value
[Google]
[Google]
Enterprise Value
Branded Business
V
alue
Brand Contrib
ution
BrandStrengthIndex
Widely recognised factors deployed by marketers to create brand loyalty and
market share.
Marketing Investment
• A brand that has high Marketing Investment but low Stakeholder Equity may be on a
path to growth. This high investment is likely to lead to future performance in Stakeholder
Equity which would in turn lead to better Business Performance in the future.
• However, high Marketing Investment over an extended period with little improvement in
Stakeholder Equity would imply that the brand is unable to shape customers’ preference.
Stakeholder Equity
• The same is true for Stakeholder Equity. If a company has high Stakeholder Equity, it is
likely that Business Performance will improve in the future.
• However, if the brand’s poor Business Performance persists, it would suggest that the
brand is inefficient compared to its competitors in transferring stakeholder sentiment
to a volume or price premium.
Business Performance
• Finally, if a brand has a strong Business Performance but scores poorly on Stakeholder
Equity, it would imply that, in the future, the brand’s ability to drive value will diminish.
• However, if it is able to sustain these higher outputs, it shows that the brand is
particularly efficient at creating value from sentiment compared to its competitors.
Marketing
Investment
Perceptions of the brand among different stakeholder groups, with customers
being the most important.
Quantitative market and financial measures representing the success of the
brand in achieving price and volume premium.
Stakeholder
Equity
Business
Performance
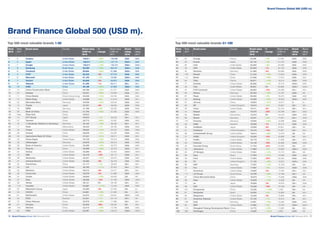
Brand Strength
Brand Strength is the efficacy of a brand’s
performance on intangible measures, relative to its
competitors.
In order to determine the strength of a brand, we look at
Marketing Investment, Stakeholder Equity, and the impact
of those on Business Performance.
Each brand is assigned a Brand Strength Index (BSI)
score out of 100, which feeds into the brand value
calculation. Based on the score, each brand is assigned a
corresponding rating up to AAA+ in a format similar to a
credit rating.
Analysing the three brand strength measures helps inform
managers of a brand’s potential for future success.
Investment
Equity
Performance](https://image.slidesharecdn.com/bfglobal2018500websitelockedfinalspread-180201174724/85/Bf-global2018-500_website_locked_final_spread-4-320.jpg)