Downloaded 13 times
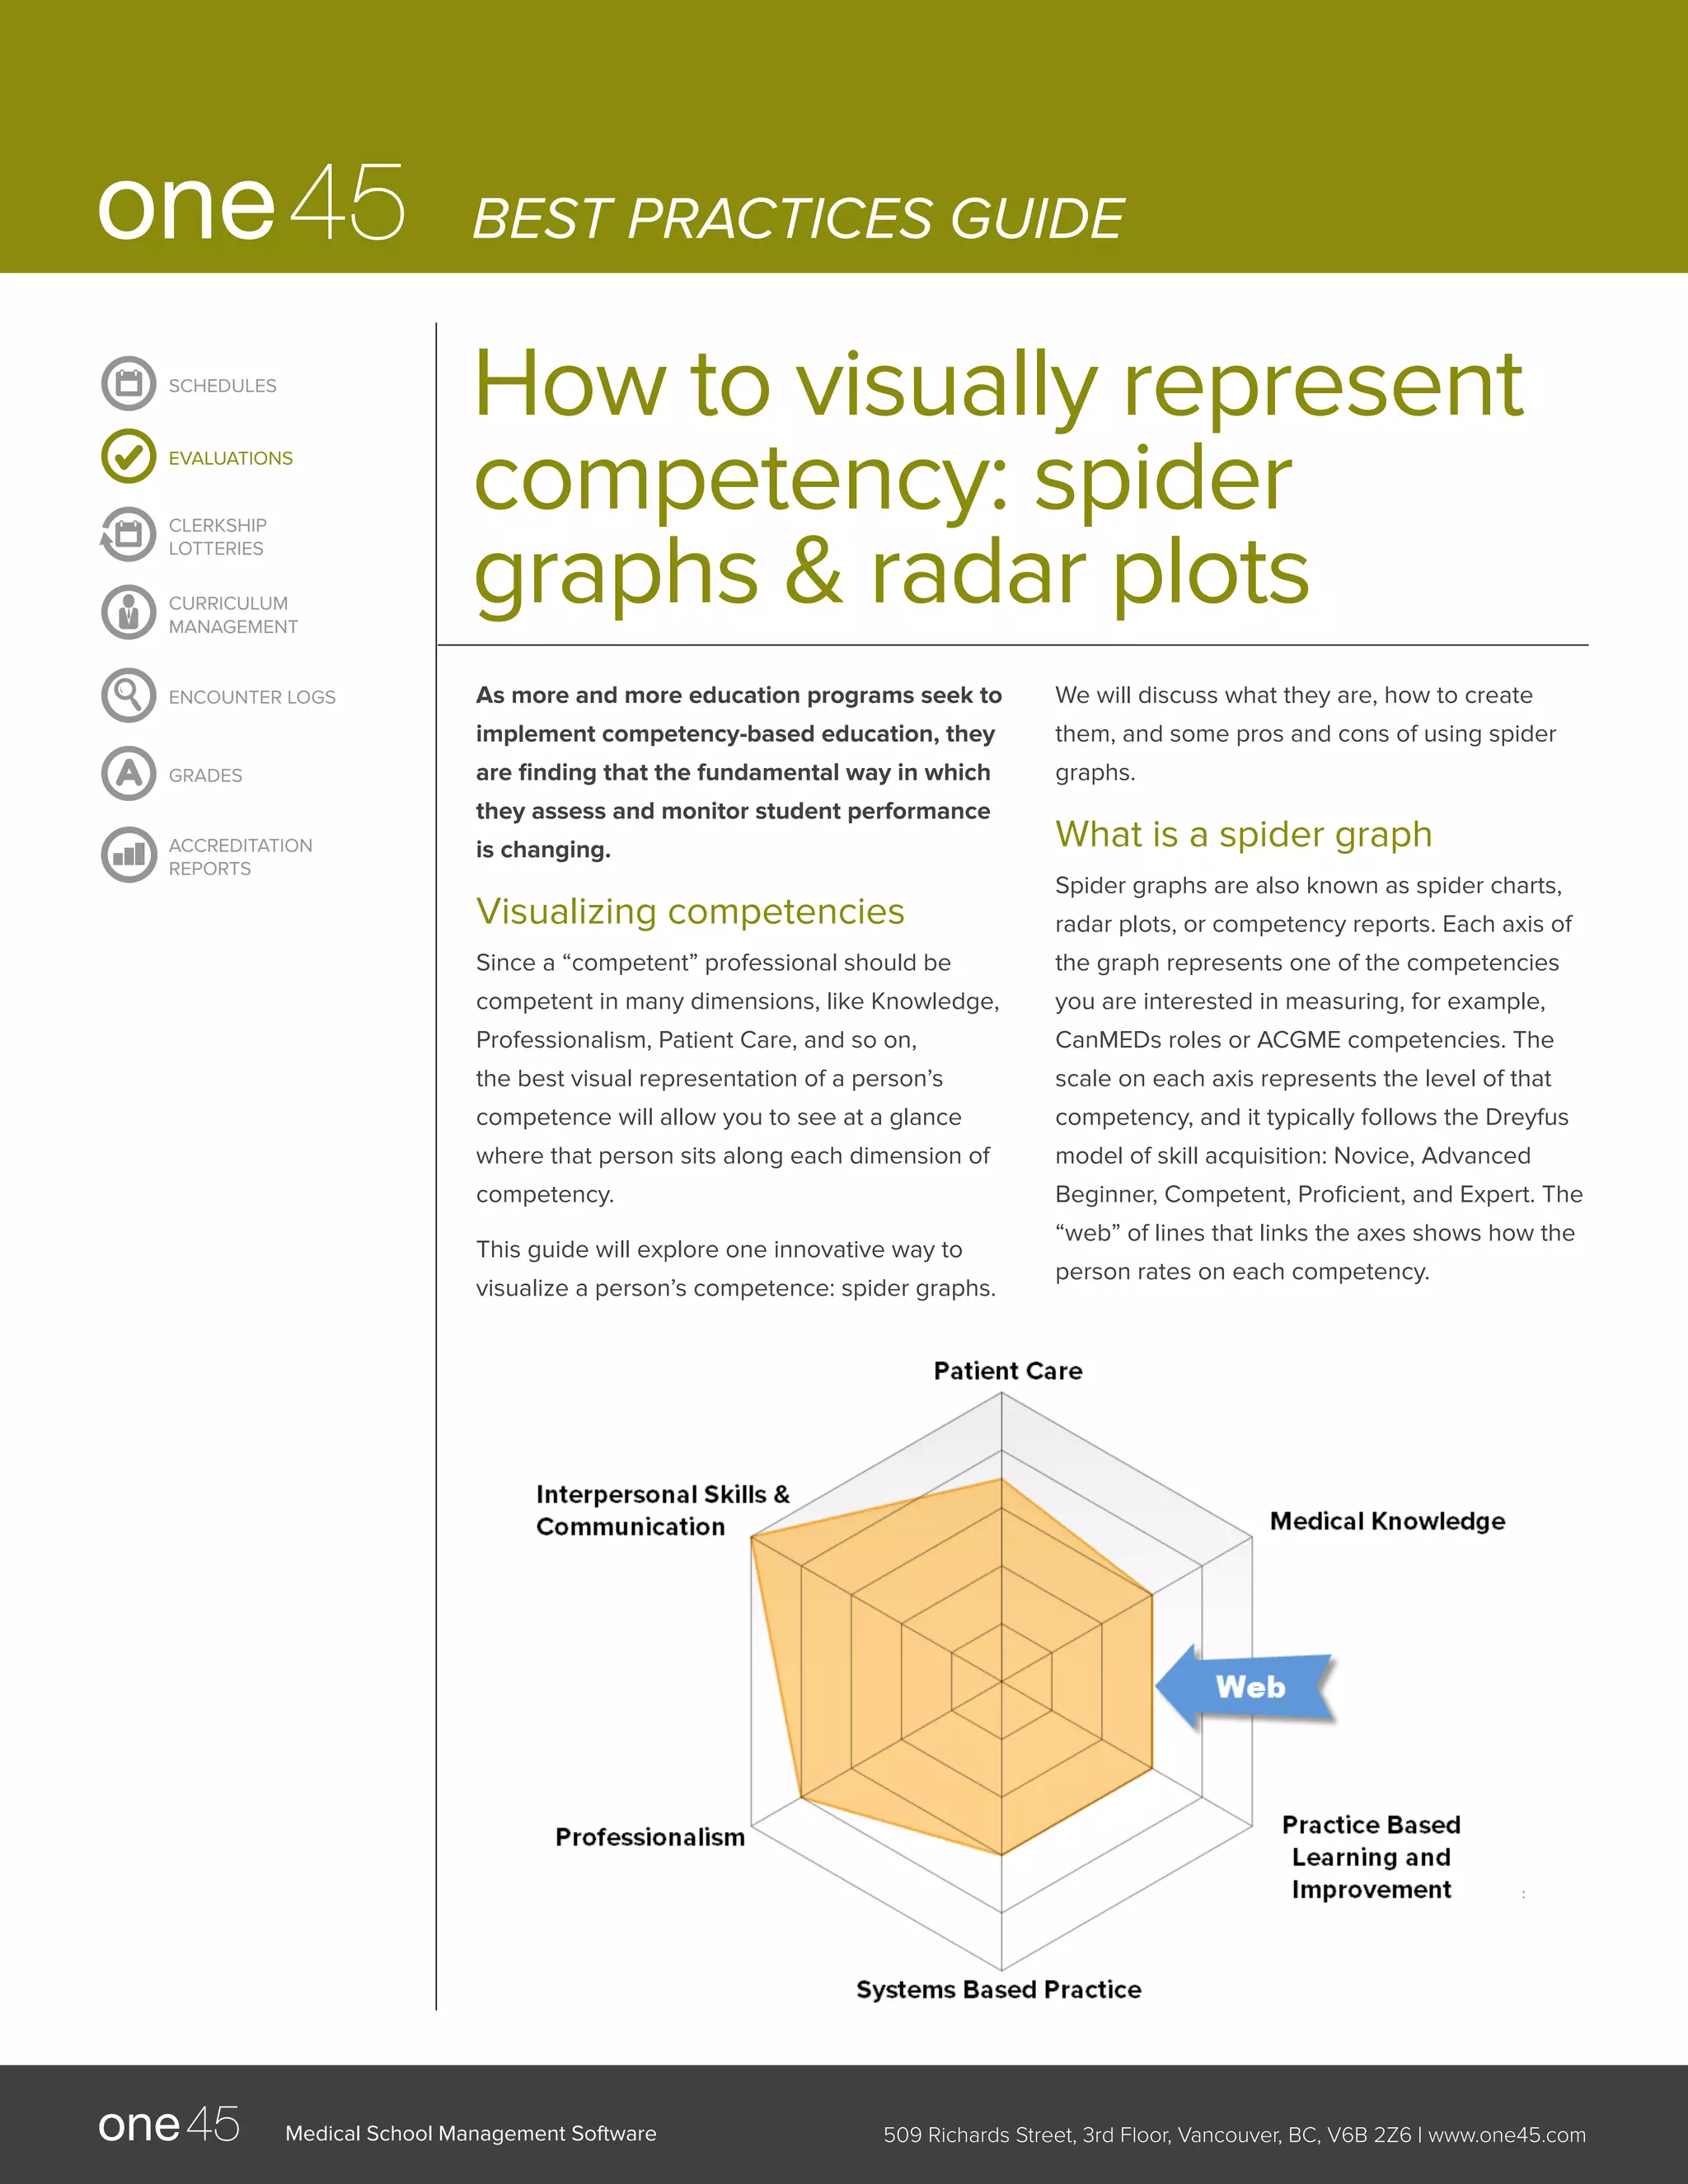
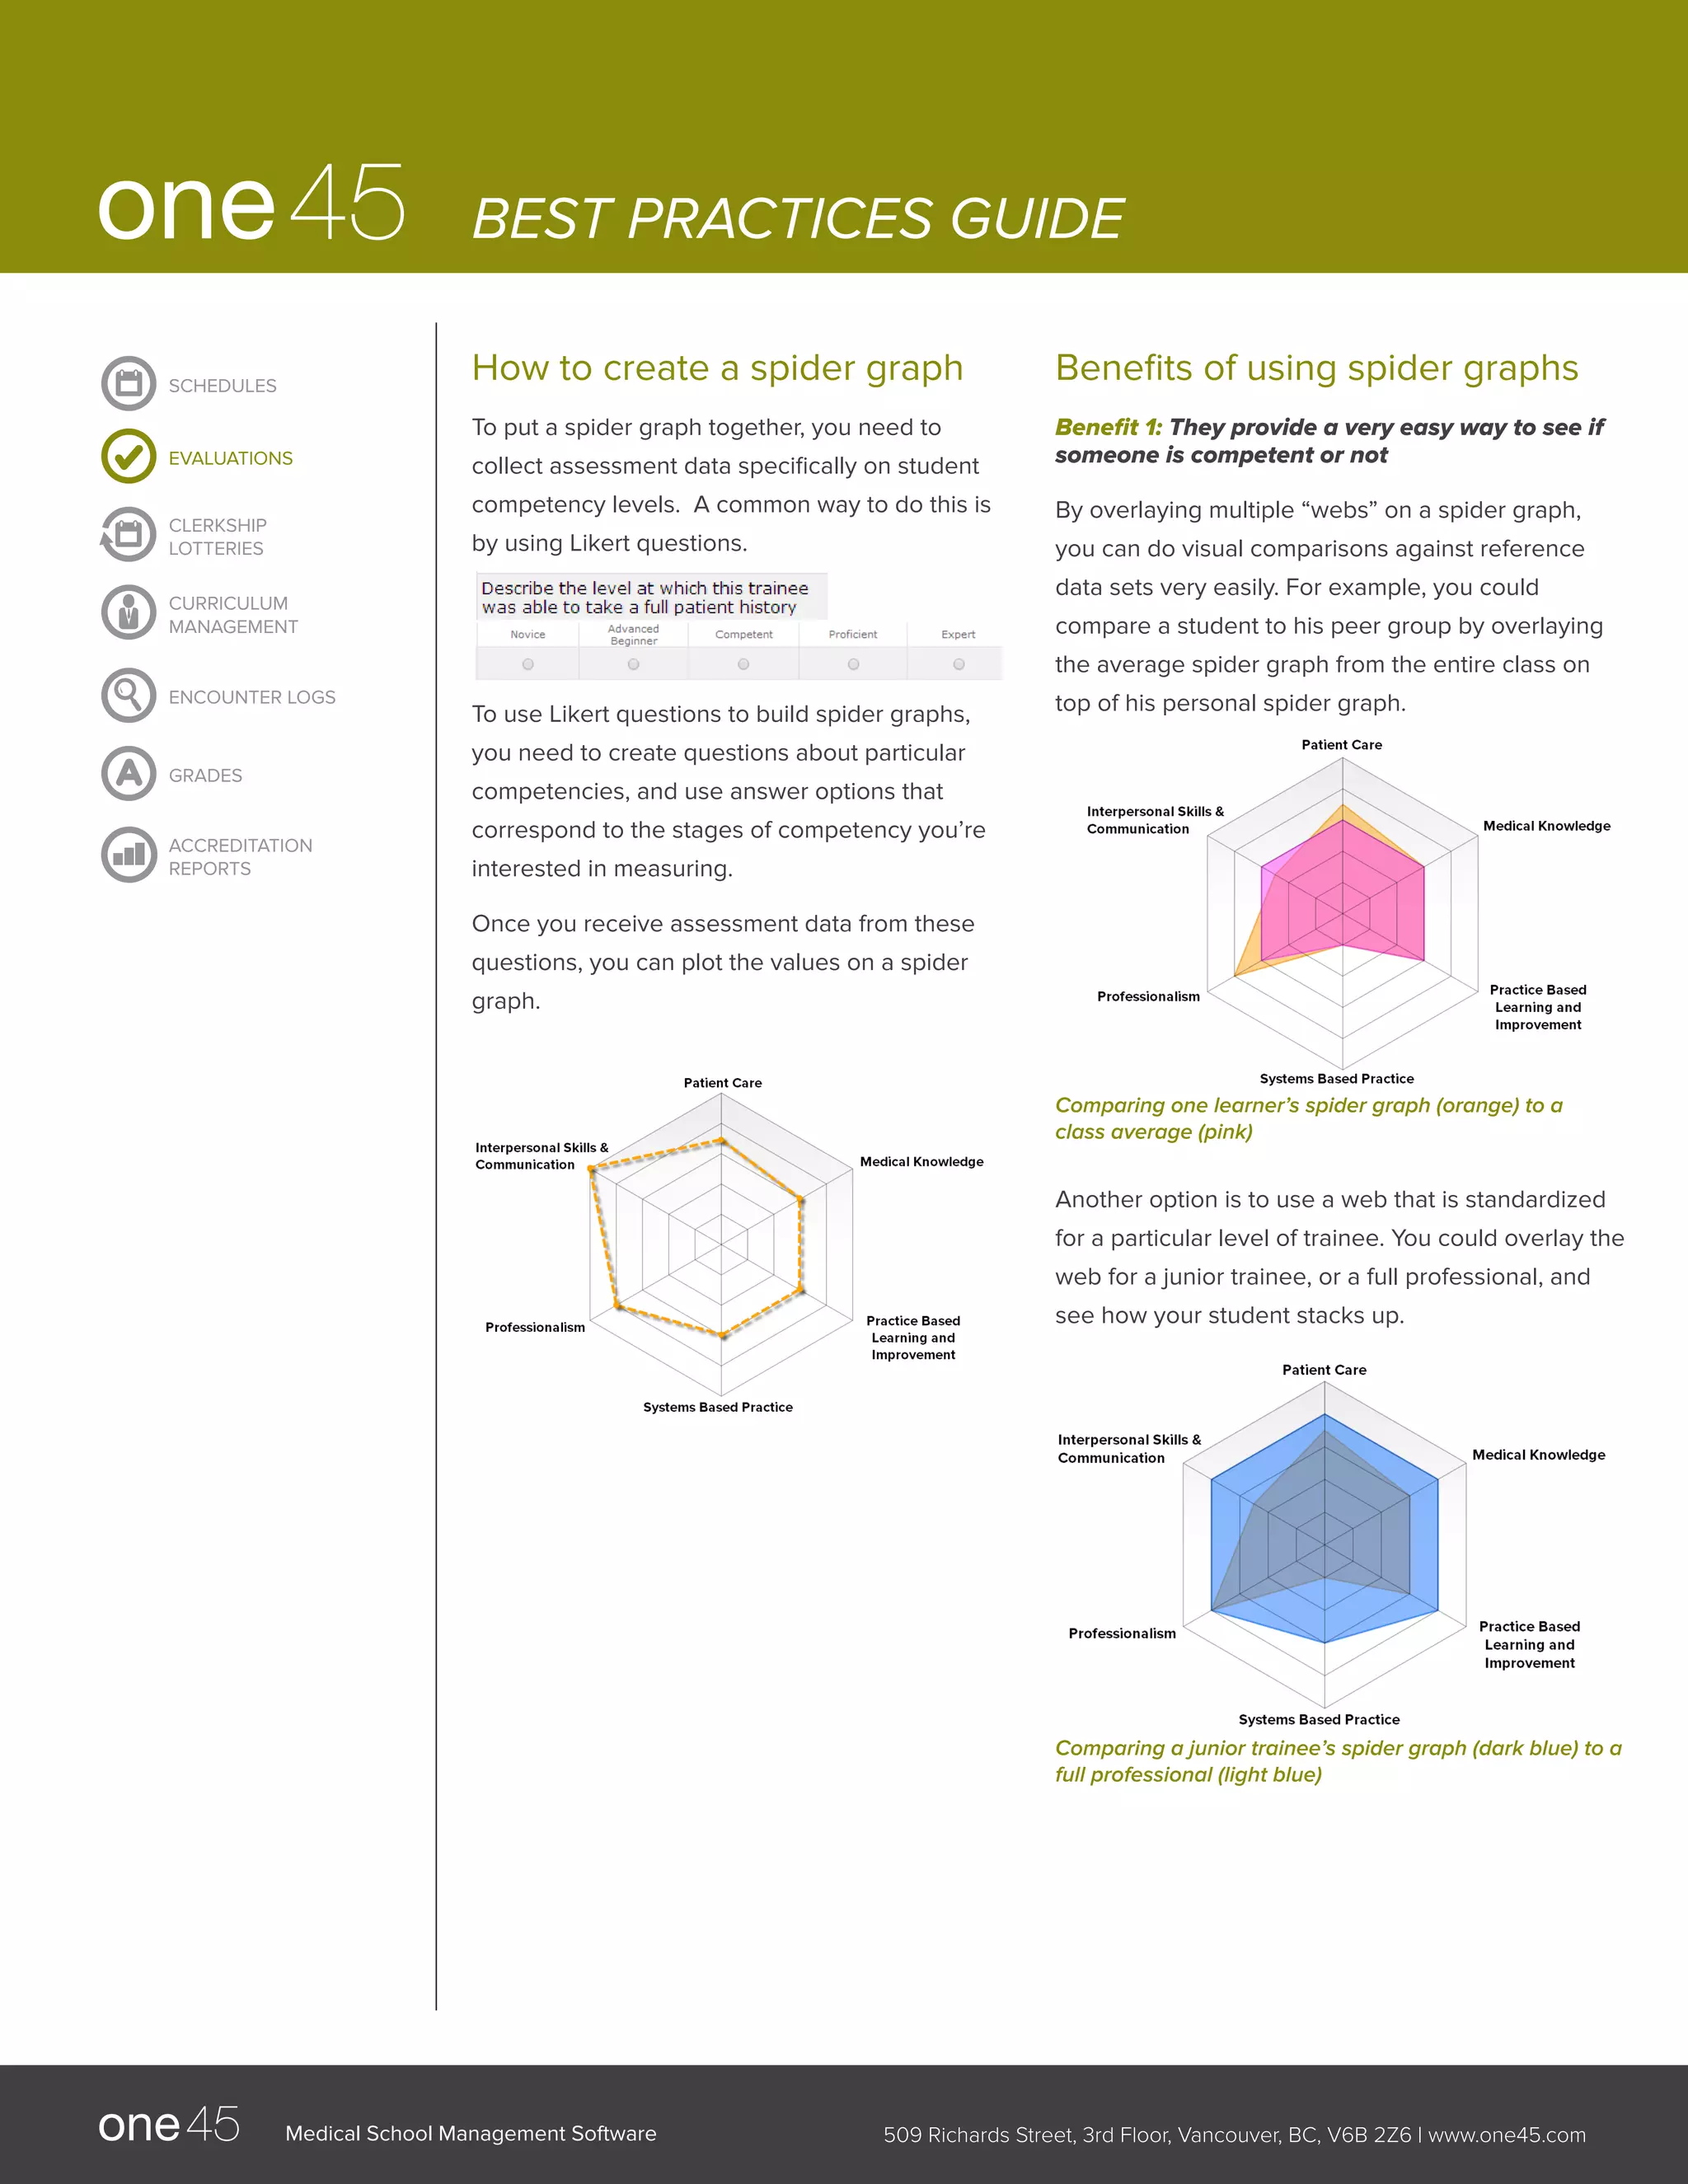

The document discusses the use of spider graphs, or radar plots, as a tool for visualizing student competencies in medical education. It outlines how to create these graphs using assessment data, their benefits in identifying strengths and weaknesses, and the drawbacks related to subtle issues and readability. The guide encourages starting with simple spider graphs before considering more advanced technology for generating them.


