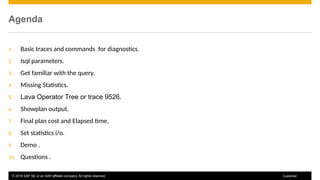
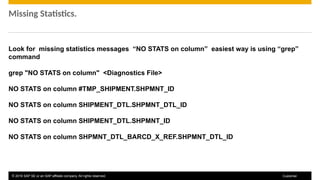
Use this title slide only with an image
Basic Outputs to Troubleshooting Queries.
ASE Customer Coffee Corner
November, 2016
© 2016 SAP SE or an SAP affiliate company. All rights reserved. 2
Customer
Agenda
1. Basic traces and commands for diagnostics.
2. Isql parameters.
3. Get familiar with the query.
4. Missing Statistics.
5. Lava Operator Tree or trace 9526.
6. Showplan output.
7. Final plan cost and Elapsed time.
8. Set statistics i/o.
9. Demo .
10. Questions .
© 2016 SAP SE or an SAP affiliate company. All rights reserved. 3
Customer
Basic traces and commands for diagnostics.
select @@version // Really important to know the version
select @@optlevel // be sure to be in the latest fix level ase_current
select @@optgoal // The goal been used
set statement_cache off // Will generate a new plan avoid using a cached plan
set option show_missing_stats on // Will show missing statistics
set option show brief // Shows basic diagnostics and fixes and criterias enabled
set option show_abstract_plan on // Generates Abstract Plan can be used to test other
plans
set statistics io on // io outputs
© 2016 SAP SE or an SAP affiliate company. All rights reserved. 4
Customer
Cont … Basic traces and commands for diagnostics.
set statistics time on // time output
set statistics plancost on // cost plan
set plan optlevel ase_current // Set current fix level
set showplan on // showplan output
dbcc traceon(3604) // Enable printing diagnostics
dbcc traceon(9526) // Lava Tree ( estimates vs actual values for rows, lios and pios )
dbcc traceflags //Display current trace flags
© 2016 SAP SE or an SAP affiliate company. All rights reserved. 5
Customer
Cont … Basic traces and commands for diagnostics.
set nodata on //omits data set results
<query>
dbcc traceoff(3604,9526)
go
© 2016 SAP SE or an SAP affiliate company. All rights reserved. 6
Customer
Isql parameters.
–U<user> // user to execute the query
-P<password> // password of the user
-w2000 // width of the output to avoid word wrapping
-e // copy commands to the output file
-S<server name> // name of the server to be used
-i <input file> // file to execute
-o <output file> // file to collect diagnostics and traces
© 2016 SAP SE or an SAP affiliate company. All rights reserved. 7
Customer
.
Get familiar with the query.
Take a look at the query.
Draw a graphical representation of it .
Tables.
Indexes.
Columns.
© 2016 SAP SE or an SAP affiliate company. All rights reserved. 8
Customer
Missing Statistics.
Look for missing statistics messages “NO STATS on column” easiest way is using “grep”
command
grep "NO STATS on column" <Diagnostics File>
NO STATS on column #TMP_SHIPMENT.SHPMNT_ID
NO STATS on column SHIPMENT_DTL.SHPMNT_DTL_ID
NO STATS on column SHIPMENT_DTL.SHPMNT_ID
NO STATS on column SHPMNT_DTL_BARCD_X_REF.SHPMNT_DTL_ID
© 2016 SAP SE or an SAP affiliate company. All rights reserved. 9
Customer
Lava Operator Tree or trace 9526.
Lava Operator Tree or trace 9526 output is very important.
Shows both estimates and actual values for rows, Lios and Pios.
Large differences between “act” and “est” usually are signs for inaccurate or lack of statistics.
As shown below each node shows its individual values.
© 2016 SAP SE or an SAP affiliate company. All rights reserved. 10
Customer
Cont .. Lava Operator Tree or trace 9526.
====================== Lava Operator Tree ====================
|Emit (VA = 20, LSTATE_CLOSED)
| Rows: act:362 est:9.808e+06
| |Sequencer (VA = 19, LSTATE_CLOSED)
| | Rows: act:362 est:0
| | |StoreIndex (VA = 2, LSTATE_CLOSED)
| | | Rows: act:87 est:100
| | | Lios: act:11 est:6
| | | Pios: act:2 est:0
| | | cpu: 100 bufct: 24
© 2016 SAP SE or an SAP affiliate company. All rights reserved. 11
Customer
Showplan output.
STEP 1
The type of query is SELECT.
20 operator(s) under root
|ROOT:EMIT Operator (VA = 20)
|
| |SEQUENCER Operator (VA = 19) has 2 children.
| |
| | |STORE Operator (VA = 2)
| | | Worktable1 created, in allpages locking mode, for REFORMATTING.
| | | Creating clustered index.
| | |
| | | |INSERT Operator (VA = 1)
| | | | The update mode is direct.
| | | |
| | | | |SCAN Operator (VA = 0)
| | | | | FROM TABLE
| | | | | #TMP_SHIPMENT
| | | | | T
| | | | | Table Scan.
| | | | | Forward Scan.
| | | | | Positioning at start of table.
| | | | | Using I/O Size 2 Kbytes for data pages.
| | | | | With LRU Buffer Replacement Strategy for data pages.
| | | |
| | | | TO TABLE
| | | | Worktable1.
© 2016 SAP SE or an SAP affiliate company. All rights reserved. 12
Customer
Final plan cost and Elapsed time.
FINAL PLAN ( total cost = 2.317187e+08 ):
lio=8516448 pio=8516444 cpu=1.774662e+07 tempdb=6228.525
Adaptive Server cpu time: 3000 ms.
Adaptive Server elapsed time: 4886 ms.
© 2016 SAP SE or an SAP affiliate company. All rights reserved. 13
Customer
Set statistics i/o.
Table: SHPMNT_DTL_BARCD_X_REF (X) scan count 1690,
logical reads: (regular=3454 apf=0 total=3454),
physical reads: (regular=0 apf=0 total=0), apf IOs used=0
Table: SHIPMENT_DTL (D) scan count 1735,
logical reads: (regular=4724 apf=0 total=4724),
physical reads: (regular=0 apf=0 total=0), apf IOs used=0
© 2016 SAP SE or an SAP affiliate company. All rights reserved. 14
Customer
Document Links
Documentation:
SAP® Adaptive Server® Enterprise Performance and Tuning Series
© 2016 SAP SE or an SAP affiliate company. All rights reserved.
Thank you
Feel free to email questions, ideas, or comments to:
sap-psglobalaseccc@sap.com

Basic_Troubleshooting_Queries_Nov30_1.pptx

  • 1.
    Use this titleslide only with an image Basic Outputs to Troubleshooting Queries. ASE Customer Coffee Corner November, 2016
  • 2.
    © 2016 SAPSE or an SAP affiliate company. All rights reserved. 2 Customer Agenda 1. Basic traces and commands for diagnostics. 2. Isql parameters. 3. Get familiar with the query. 4. Missing Statistics. 5. Lava Operator Tree or trace 9526. 6. Showplan output. 7. Final plan cost and Elapsed time. 8. Set statistics i/o. 9. Demo . 10. Questions .
  • 3.
    © 2016 SAPSE or an SAP affiliate company. All rights reserved. 3 Customer Basic traces and commands for diagnostics. select @@version // Really important to know the version select @@optlevel // be sure to be in the latest fix level ase_current select @@optgoal // The goal been used set statement_cache off // Will generate a new plan avoid using a cached plan set option show_missing_stats on // Will show missing statistics set option show brief // Shows basic diagnostics and fixes and criterias enabled set option show_abstract_plan on // Generates Abstract Plan can be used to test other plans set statistics io on // io outputs
  • 4.
    © 2016 SAPSE or an SAP affiliate company. All rights reserved. 4 Customer Cont … Basic traces and commands for diagnostics. set statistics time on // time output set statistics plancost on // cost plan set plan optlevel ase_current // Set current fix level set showplan on // showplan output dbcc traceon(3604) // Enable printing diagnostics dbcc traceon(9526) // Lava Tree ( estimates vs actual values for rows, lios and pios ) dbcc traceflags //Display current trace flags
  • 5.
    © 2016 SAPSE or an SAP affiliate company. All rights reserved. 5 Customer Cont … Basic traces and commands for diagnostics. set nodata on //omits data set results <query> dbcc traceoff(3604,9526) go
  • 6.
    © 2016 SAPSE or an SAP affiliate company. All rights reserved. 6 Customer Isql parameters. –U<user> // user to execute the query -P<password> // password of the user -w2000 // width of the output to avoid word wrapping -e // copy commands to the output file -S<server name> // name of the server to be used -i <input file> // file to execute -o <output file> // file to collect diagnostics and traces
  • 7.
    © 2016 SAPSE or an SAP affiliate company. All rights reserved. 7 Customer . Get familiar with the query. Take a look at the query. Draw a graphical representation of it . Tables. Indexes. Columns.
  • 8.
    © 2016 SAPSE or an SAP affiliate company. All rights reserved. 8 Customer Missing Statistics. Look for missing statistics messages “NO STATS on column” easiest way is using “grep” command grep "NO STATS on column" <Diagnostics File> NO STATS on column #TMP_SHIPMENT.SHPMNT_ID NO STATS on column SHIPMENT_DTL.SHPMNT_DTL_ID NO STATS on column SHIPMENT_DTL.SHPMNT_ID NO STATS on column SHPMNT_DTL_BARCD_X_REF.SHPMNT_DTL_ID
  • 9.
    © 2016 SAPSE or an SAP affiliate company. All rights reserved. 9 Customer Lava Operator Tree or trace 9526. Lava Operator Tree or trace 9526 output is very important. Shows both estimates and actual values for rows, Lios and Pios. Large differences between “act” and “est” usually are signs for inaccurate or lack of statistics. As shown below each node shows its individual values.
  • 10.
    © 2016 SAPSE or an SAP affiliate company. All rights reserved. 10 Customer Cont .. Lava Operator Tree or trace 9526. ====================== Lava Operator Tree ==================== |Emit (VA = 20, LSTATE_CLOSED) | Rows: act:362 est:9.808e+06 | |Sequencer (VA = 19, LSTATE_CLOSED) | | Rows: act:362 est:0 | | |StoreIndex (VA = 2, LSTATE_CLOSED) | | | Rows: act:87 est:100 | | | Lios: act:11 est:6 | | | Pios: act:2 est:0 | | | cpu: 100 bufct: 24
  • 11.
    © 2016 SAPSE or an SAP affiliate company. All rights reserved. 11 Customer Showplan output. STEP 1 The type of query is SELECT. 20 operator(s) under root |ROOT:EMIT Operator (VA = 20) | | |SEQUENCER Operator (VA = 19) has 2 children. | | | | |STORE Operator (VA = 2) | | | Worktable1 created, in allpages locking mode, for REFORMATTING. | | | Creating clustered index. | | | | | | |INSERT Operator (VA = 1) | | | | The update mode is direct. | | | | | | | | |SCAN Operator (VA = 0) | | | | | FROM TABLE | | | | | #TMP_SHIPMENT | | | | | T | | | | | Table Scan. | | | | | Forward Scan. | | | | | Positioning at start of table. | | | | | Using I/O Size 2 Kbytes for data pages. | | | | | With LRU Buffer Replacement Strategy for data pages. | | | | | | | | TO TABLE | | | | Worktable1.
  • 12.
    © 2016 SAPSE or an SAP affiliate company. All rights reserved. 12 Customer Final plan cost and Elapsed time. FINAL PLAN ( total cost = 2.317187e+08 ): lio=8516448 pio=8516444 cpu=1.774662e+07 tempdb=6228.525 Adaptive Server cpu time: 3000 ms. Adaptive Server elapsed time: 4886 ms.
  • 13.
    © 2016 SAPSE or an SAP affiliate company. All rights reserved. 13 Customer Set statistics i/o. Table: SHPMNT_DTL_BARCD_X_REF (X) scan count 1690, logical reads: (regular=3454 apf=0 total=3454), physical reads: (regular=0 apf=0 total=0), apf IOs used=0 Table: SHIPMENT_DTL (D) scan count 1735, logical reads: (regular=4724 apf=0 total=4724), physical reads: (regular=0 apf=0 total=0), apf IOs used=0
  • 14.
    © 2016 SAPSE or an SAP affiliate company. All rights reserved. 14 Customer Document Links Documentation: SAP® Adaptive Server® Enterprise Performance and Tuning Series
  • 15.
    © 2016 SAPSE or an SAP affiliate company. All rights reserved. Thank you Feel free to email questions, ideas, or comments to: sap-psglobalaseccc@sap.com