
Recommended
More Related Content
Similar to B7 Llc
Similar to B7 Llc (20)
Recently uploaded
Recently uploaded (20)
B7 Llc
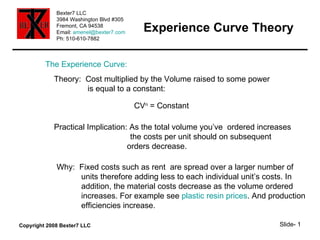
- 1. Experience Curve Theory The Experience Curve: Theory: Cost multiplied by the Volume raised to some power is equal to a constant: CV n = Constant Practical Implication: As the total volume you’ve ordered increases the costs per unit should on subsequent orders decrease. Why: Fixed costs such as rent are spread over a larger number of units therefore adding less to each individual unit’s costs. In addition, the material costs decrease as the volume ordered increases. For example see plastic resin prices . And production efficiencies increase.
- 2. Experience Curve Example How to model your own experience curve: For example: your supplier quotes 2 per unit prices for 2 different order volumes. Cost1= $5.00 at Volume1 = 10,000 units Cost2=$4.50 at Volume2 = 20,000 units To calculate n: n = (Ln(Cost2) –Ln(Cost1))/(ln(Volume1) –ln(Volume2)) where ln is the natural log n= .152 for the above example and therefore the CV n = 20.275 for all Costs and Volumes in THEORY
- 3. Experience Curve Prediction So in THEORY costs per unit, after you’ve already purchased 50,000 units, would be: C = $20.275/50,000 .152 C= $3.91 per unit Practical results may vary however and there is a point where the price is constrained by the “bottom of the barrel” effect where it can not decrease any further along with other factors. Your customer will expect a lower per unit price for higher volume orders!
- 4. Supply Chain Schematic CIF FOB US Model Container To Warehouse Your supplier’s suppliers Your supplier Shipping container Local customs Onto ship 2wk trip US Docks US Customs Drayage Master cartons Palletize orders Retailer picks up order
- 5. Palletize Warehouse breaks Master/Shipping Cartons and places product Vendor Cartons on pallets according to the customer order for pick up.
- 7. Product Barcode Examples Check digit Product ID Company prefix UPC-A Company prefix Product ID Check digit ITF-14/GTIN-14
- 9. Examples sales volume calculations for specific chains A very rough estimate of the units sold per year for example retail chains: Chain A: 1613 Stores X 16 Units/Store X 6.2 Turns/yr = ~ 160,000 Units/Yr Chain B: 7390 Stores X 16 Units/Store X 8.1 Turns/yr = ~ 960,000 Units/Yr Chain C: 5000 Stores X 16 Units/Store X 6.2 Turns/yr = ~ 496,000 Units/Yr
- 10. Risk Simplified Product Delivery System Assume that for this simplified model the probability that any functional block will succeed is 50% or ½ . For the system to work every step must succeed and for it to fail only one step needs to misfire. Then the probability that the system will work is the product of the probability of all 5 of the steps working or: ½ X ½ X ½ X ½ X ½ = 0.03125 or ~ 3% chance of success! AROUND 97% CHANCE OF FAILURE! Fewer steps in the delivery system means less risk! Design Manufacturing Quality Assurance Distribution Marketing
- 11. Risk and Reward A subjective method for evaluating the reward requirements of a project or ranking competing projects: For example assume that there are 2 projects but one has a lower perceived risk, say for example, fewer steps in the delivery system (4 versus 5). Both require $100,000 investment: THIS DOESN’T MEAN THAT THE PROJECT WILL PAYOFF AT THIS LEVEL! NEED TO EVALUATE THE RELEVANT MARKETS! THIS IS A SUBJECTIVE EVALUATION OF THE PAYOFF REQUIREMENTS. Investment Chance of Success <= Required Reward $100,000 (1/2) 4 =~$1.6MM $100,000 (1/2) 5 =~$3.2MM
- 13. Demographics Distributions The population of each group has a bell shaped distribution. Time All the members of a group don’t buy at once. Some buy earlier some buy later, each group’s purchases are distribute along a time line. Purchases
- 14. Product Life Cycle The Product Life Cycle is the result of the superposition, addition, of the curves where they overlap in time.
- 15. Product Life Cycle & Cash Flow There’s a considerable delay between when inventory expenses are incurred and when payments are received from retailers. TIME Inventory Purchases Retail Sales Retail Payments
- 17. Factoring or PO: Per Transaction Costs Borrow 80% Value Accounts Receivable Or Purchase Orders Payback the 80% Get 13-16% Back Pay 4-7% Of the Collateral’s Value Every time you go through the loop it costs you 4-7% of the collateral! Switch to a line of credit or some other financing method ASAP!!
- 19. Break Even Analysis Fixed costs – not affected by number of units bought. Variable Costs – also called marginal increases with the units bought
Editor's Notes
- The blue underlining indicates Web links for more information.