IRJET- Lung Cancer Detection using Grey Level Co-Occurrence Matrix
Avery Yip poster
1. Developing Sub-regional Radiomic Features for Brain Tumor Grade
Classification
Avery Yip, Mu Zhou, Olivier Gevaert
Center for Biomedical Informatics Research, Stanford University School of Medicine,
Stanford, CA 94305
Abstract
Introduction
Data Results
Conclusions
Glioblastoma Multiforme (GBM) is a highly malignant tumor
stemming from astrocytes and necessitates ample blood supply to
reproduce. In most cases, the source of the disease is unclear, and
it affects approximately 29.5 per 100,000 people. Initial stages of
GBM induce seizures, nausea, headaches with rapid onset of
worsening symptoms such as hemiparesis and progressive
memory loss. Tumor grade identification is necessary for
immediate treatment, however, often biopsies are dangerous and
time-consuming. Clinical imaging is a universal procedure for
most cancer patients and unlocking definitive features within
them would allow early, non-invasive diagnoses of tumor grades.
The proposed method built on the emerging science of
Radiomics specializes in extracting high-dimensional image
features for predicting clinical outcomes. We showed that the
extracted regional-based image features are able to differentiate
between LGG and HGG in Glioblastoma.
Glioblastoma Multiforme (GBM), the most endemic and
aggressive grade of brain tumors occurring idiopathically, carries
a poor clinical prognosis with a median survival rate of 12-16
months. Current procedures consist of utilizing magnetic
resonance imaging (MRI) to discover tumors while lengthy
biopsies are used to classify between low-grade (LGG) and high-
grade gliomas (HGG). We hypothesize that there are monumental
amounts of predictive information sealed within MRI scans
indicative of tumor grade to improve tumor grade classification.
In this study, we develop an automated computational framework
using imaging-based analysis founded upon Radiomics, an
emerging field in stratified medicine, with the goal of converting
imaging data into features. We extracted high-dimensional
imaging features from MRI data for computer-aided LGG and
HGG differentiation.
We used the MICCAI BRATS dataset containing four MRI
modalities (Flair, T1, T1c, T2) of 274 MRI brain scans,
consisting of 54 LGG and 220 HGG cases, with ground-truth
tumor annotations. Utilizing K-means clustering, each run
produced one set of (K=5) sub-regions, and we performed this
clustering method five times for each patient.
From each set independently, we extracted 405-dimensional
features including Gray-Level Co-occurrence Matrix (GLCM)
features and intensity-based histogram features. We applied the
ReliefF algorithm for feature selection and an SVM classifier
(Linear and RBF Kernel) for classification with a 10-fold cross
validation. Despite an unbalanced data set containing four times
more HGG than LGG patients, our results yielded a max AUC of
0.80 with an error rate of 27.5% when using SVM classifier with
an RBF Kernel, proving that phenotypic features generated
within GBM sub-regions are significant in grade classification.
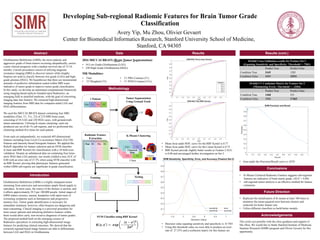
• K-Means Clustered Radiomic Features suggests sub-regional
features are indicative of brain tumor grade. (AUC = 0.80)
• sub-regional tumor analysis is an effective method for feature
extraction.
Acknowledgements
Flair T1 T1c T2
Testing
This work was possible with the close guidance and support of
Mu Zhou. We would like to thank Stanford Institute of Medicine
Summer Research (SIMR) program and Olivier Gevaert for this
opportunity.
2016 MICCAI BRATS (Brain Tumor Segmentation)
• 54 Low Grade Glioblastoma (LGG)
• 220 High Grade Glioblastoma (HGG)
MR Modalities:
• Flair
• T2 Weighted (T2)
• T1 PRE-Contrast (T1)
• T1 POST-Contrast (T1c)
Methodology
Future Direction
• Replicate the initialization of K-means at least 100 times to
minimize the mean-squared error between clusters and
centroids for better feature sets.
• Utilize different classifiers to build better models
• Mean Area under ROC curve for the RBF Kernel is 0.77
• Mean Area under ROC curve for the Linear Kernel is 0.75
• RBF Kernel provide slightly better results as Feature 2 AUC
is 0.80 and encouraged further investigation on Set 2.
Results (cont.)
10-fold Cross-Validation results for Feature Set 2
(Equating Sensitivity and Specificity: Threshold = .7381)
Predict True Predict False
Condition True 3169 1205
Condition False 4909 12911
• Decision value equating sensitivity and specificity is -0.7381
• Using this threshold value we were able to produce an error
rate of 27.55% and a confusion matrix for this feature set.
10-fold CV Confusion Matrix for Feature Set 2
(Minimizing Error: Threshold = -.3204)
Predict True Predict False
Condition True 1468 355
Condition False 2906 17465
• Area under the Precision/Recall curve is .6259
Tumor Segmentation
Using Ground Truth
1 2 3 4
Training
1 Patient
Flair T1 T1c T2
K-Means Clustering
Flair T1
T1c T2
Clustered
Data
Clusters
Radiomic Feature
Extraction
Flair T1
T1c T2
Clustered
Data
Flair T1
T1c T2
Clustered
Data
Flair T1
T1c T2
Clustered
Data
Flair T1
T1c T2
Clustered
Data
5 Sets5 Sets
Flair T1 T1c T2Flair T1 T1c T2Flair T1 T1c T2Flair T1 T1c T2