Downloaded 661 times


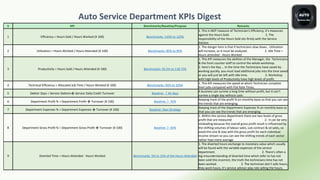


The document outlines key performance indicators (KPIs) essential for managing a service department, focusing on efficiency, utilization, productivity, and profit metrics. It emphasizes the importance of balancing hours sold, worked, and attended while managing costs effectively to maximize profitability. Additionally, it provides benchmarks and calculations for various metrics to guide service managers in improving operational effectiveness.


