This document provides a summary of Australian workers' compensation statistics for serious claims between 2000-01 and 2014-15. Some of the key findings include:
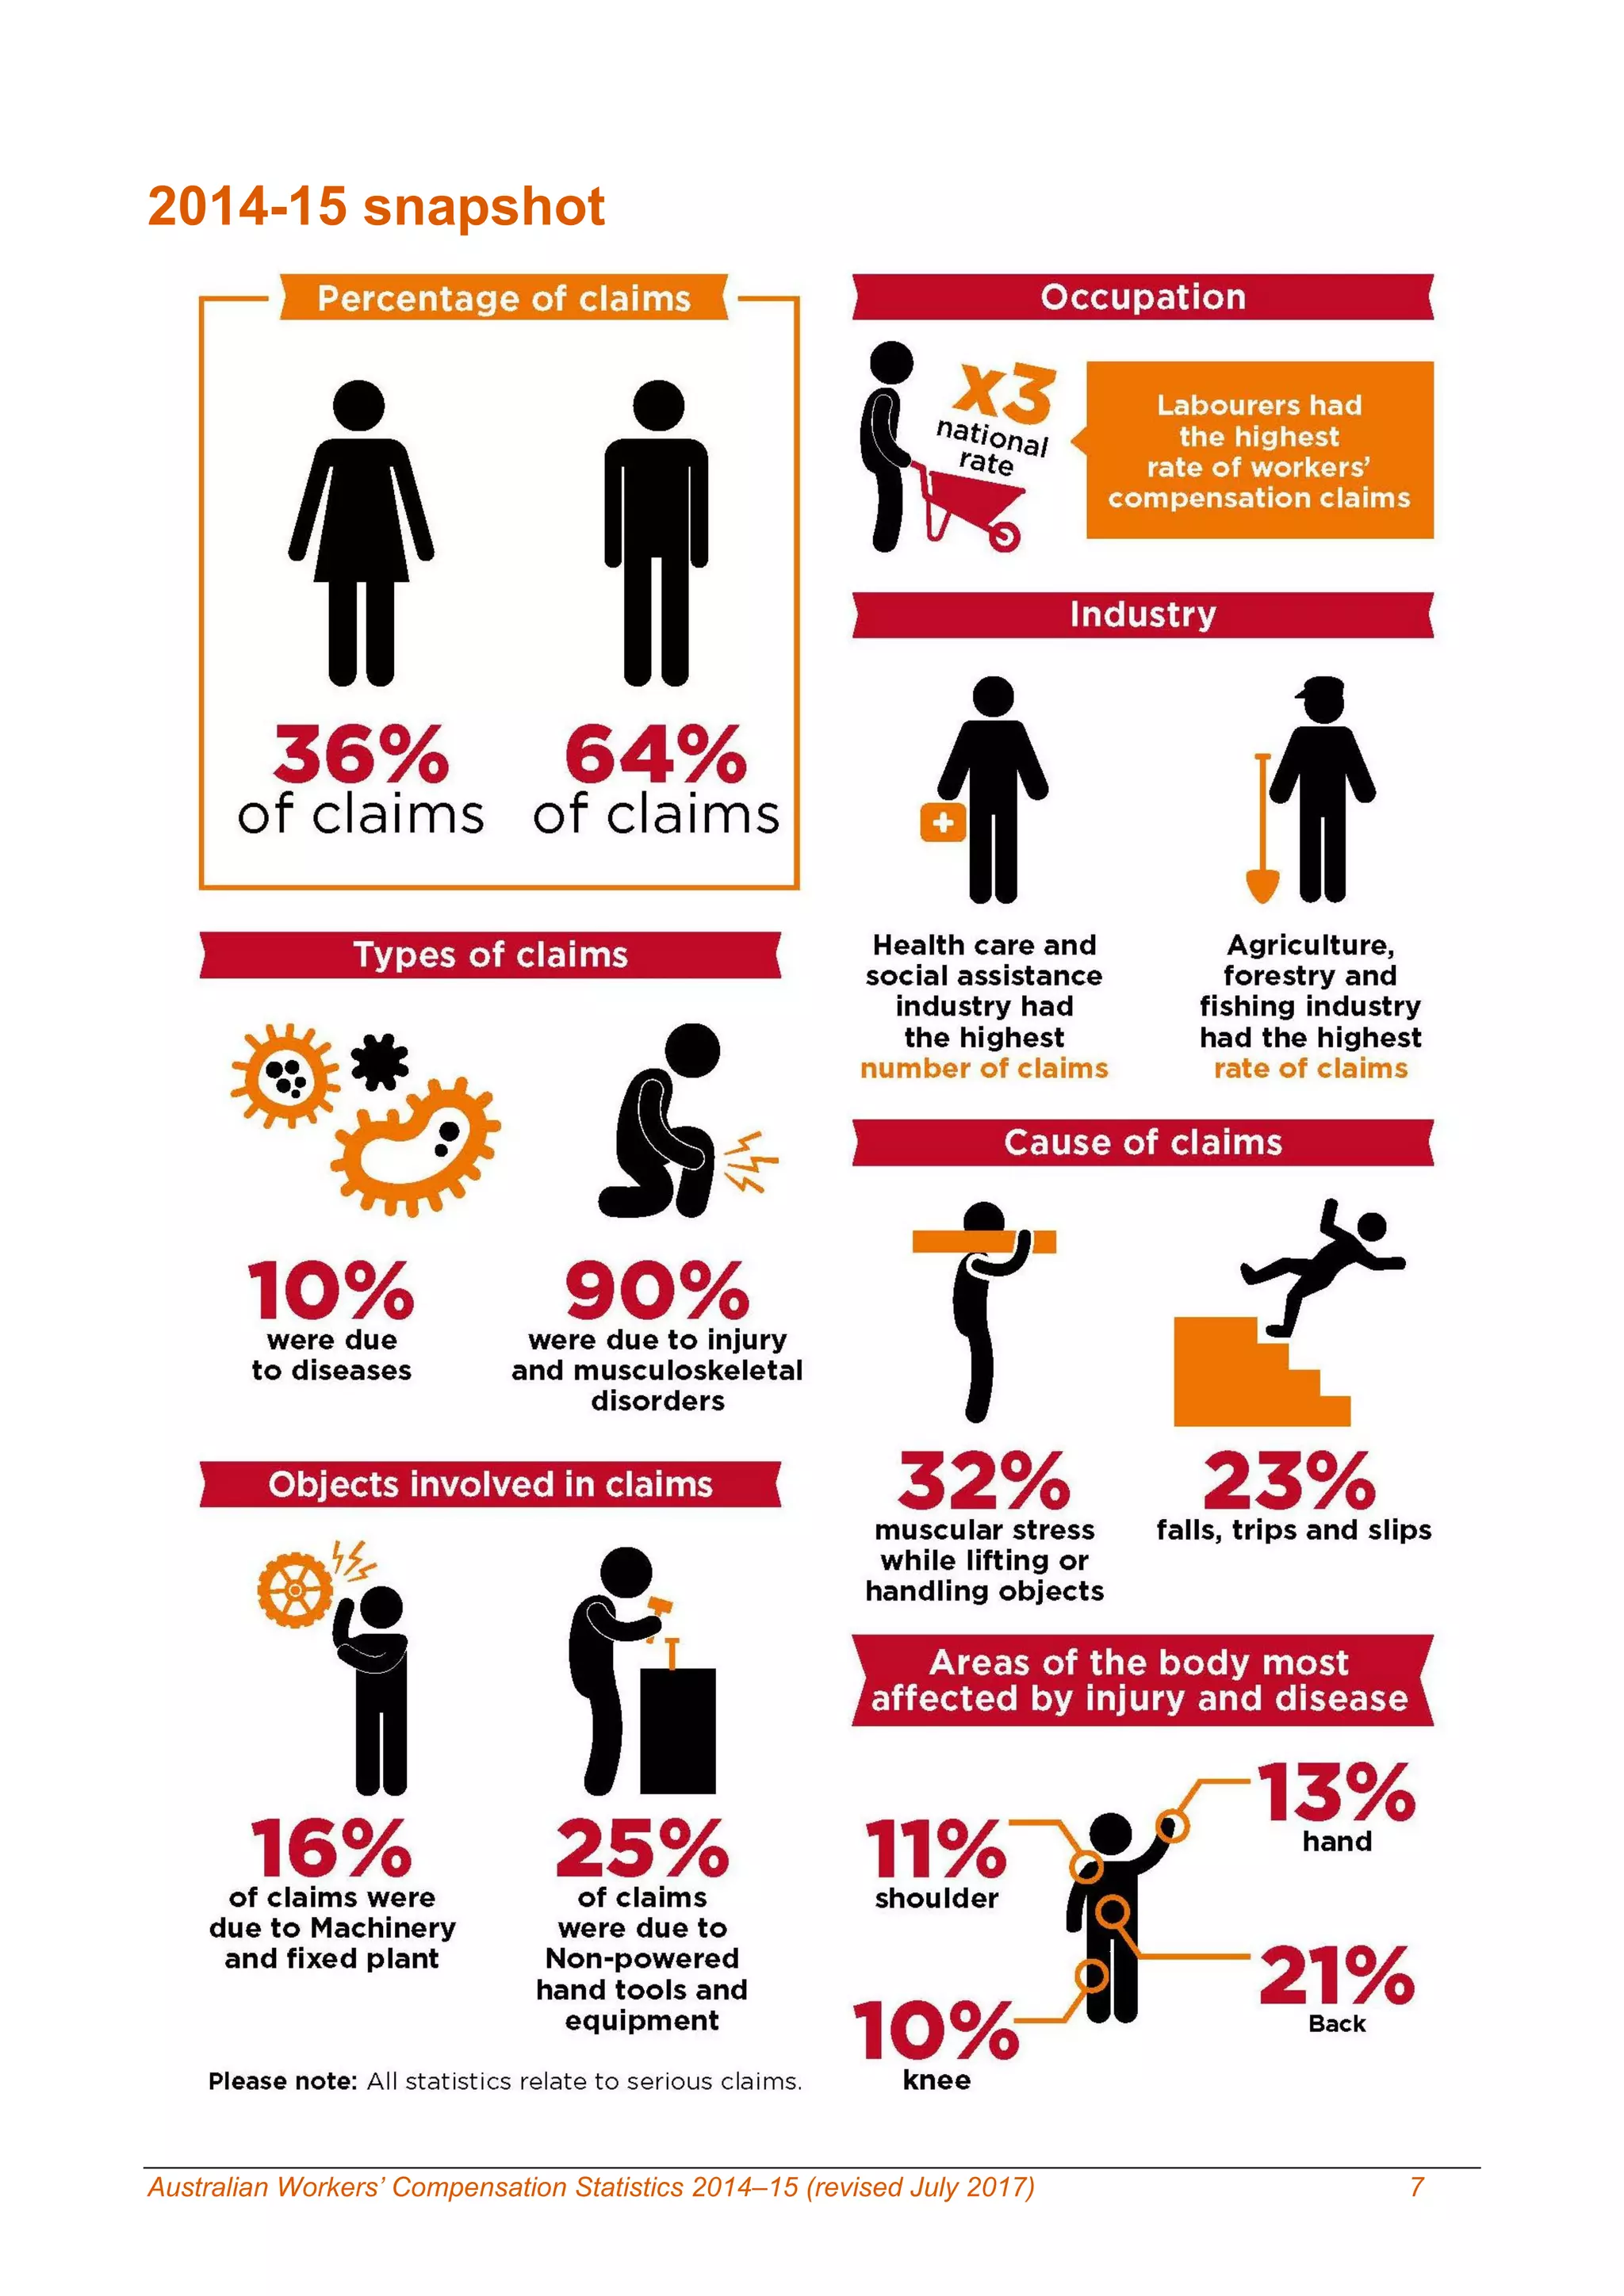
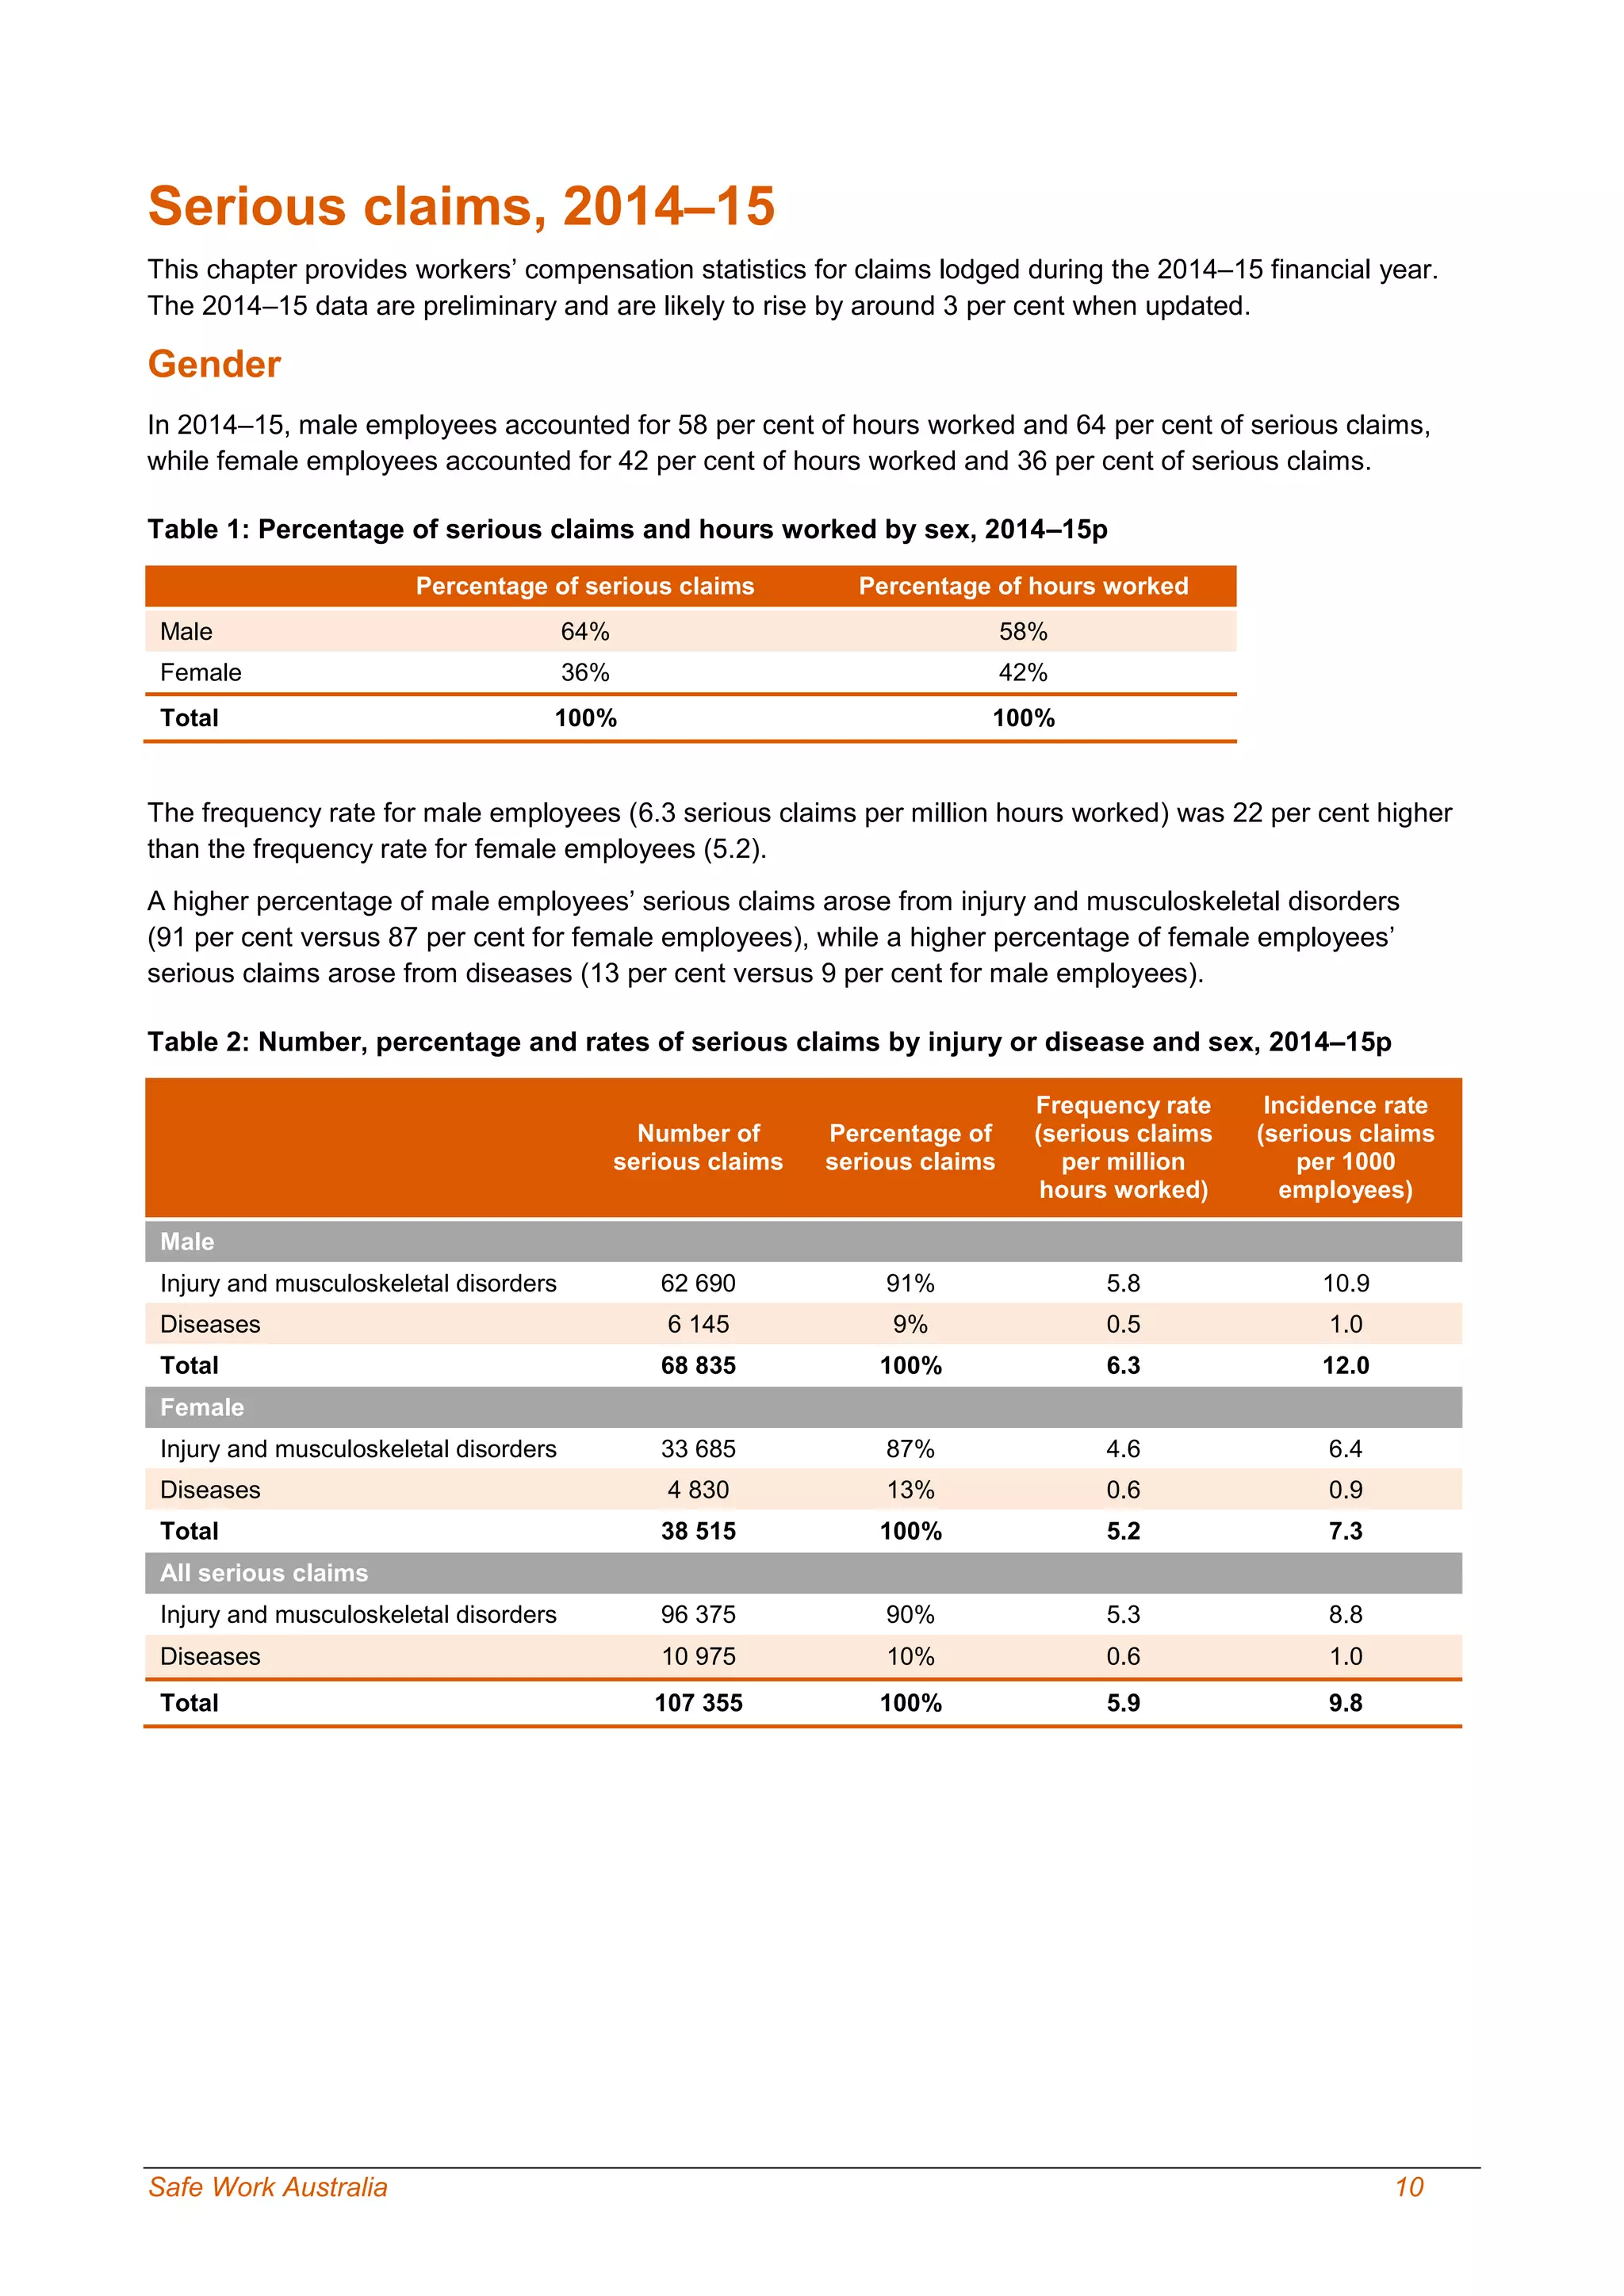
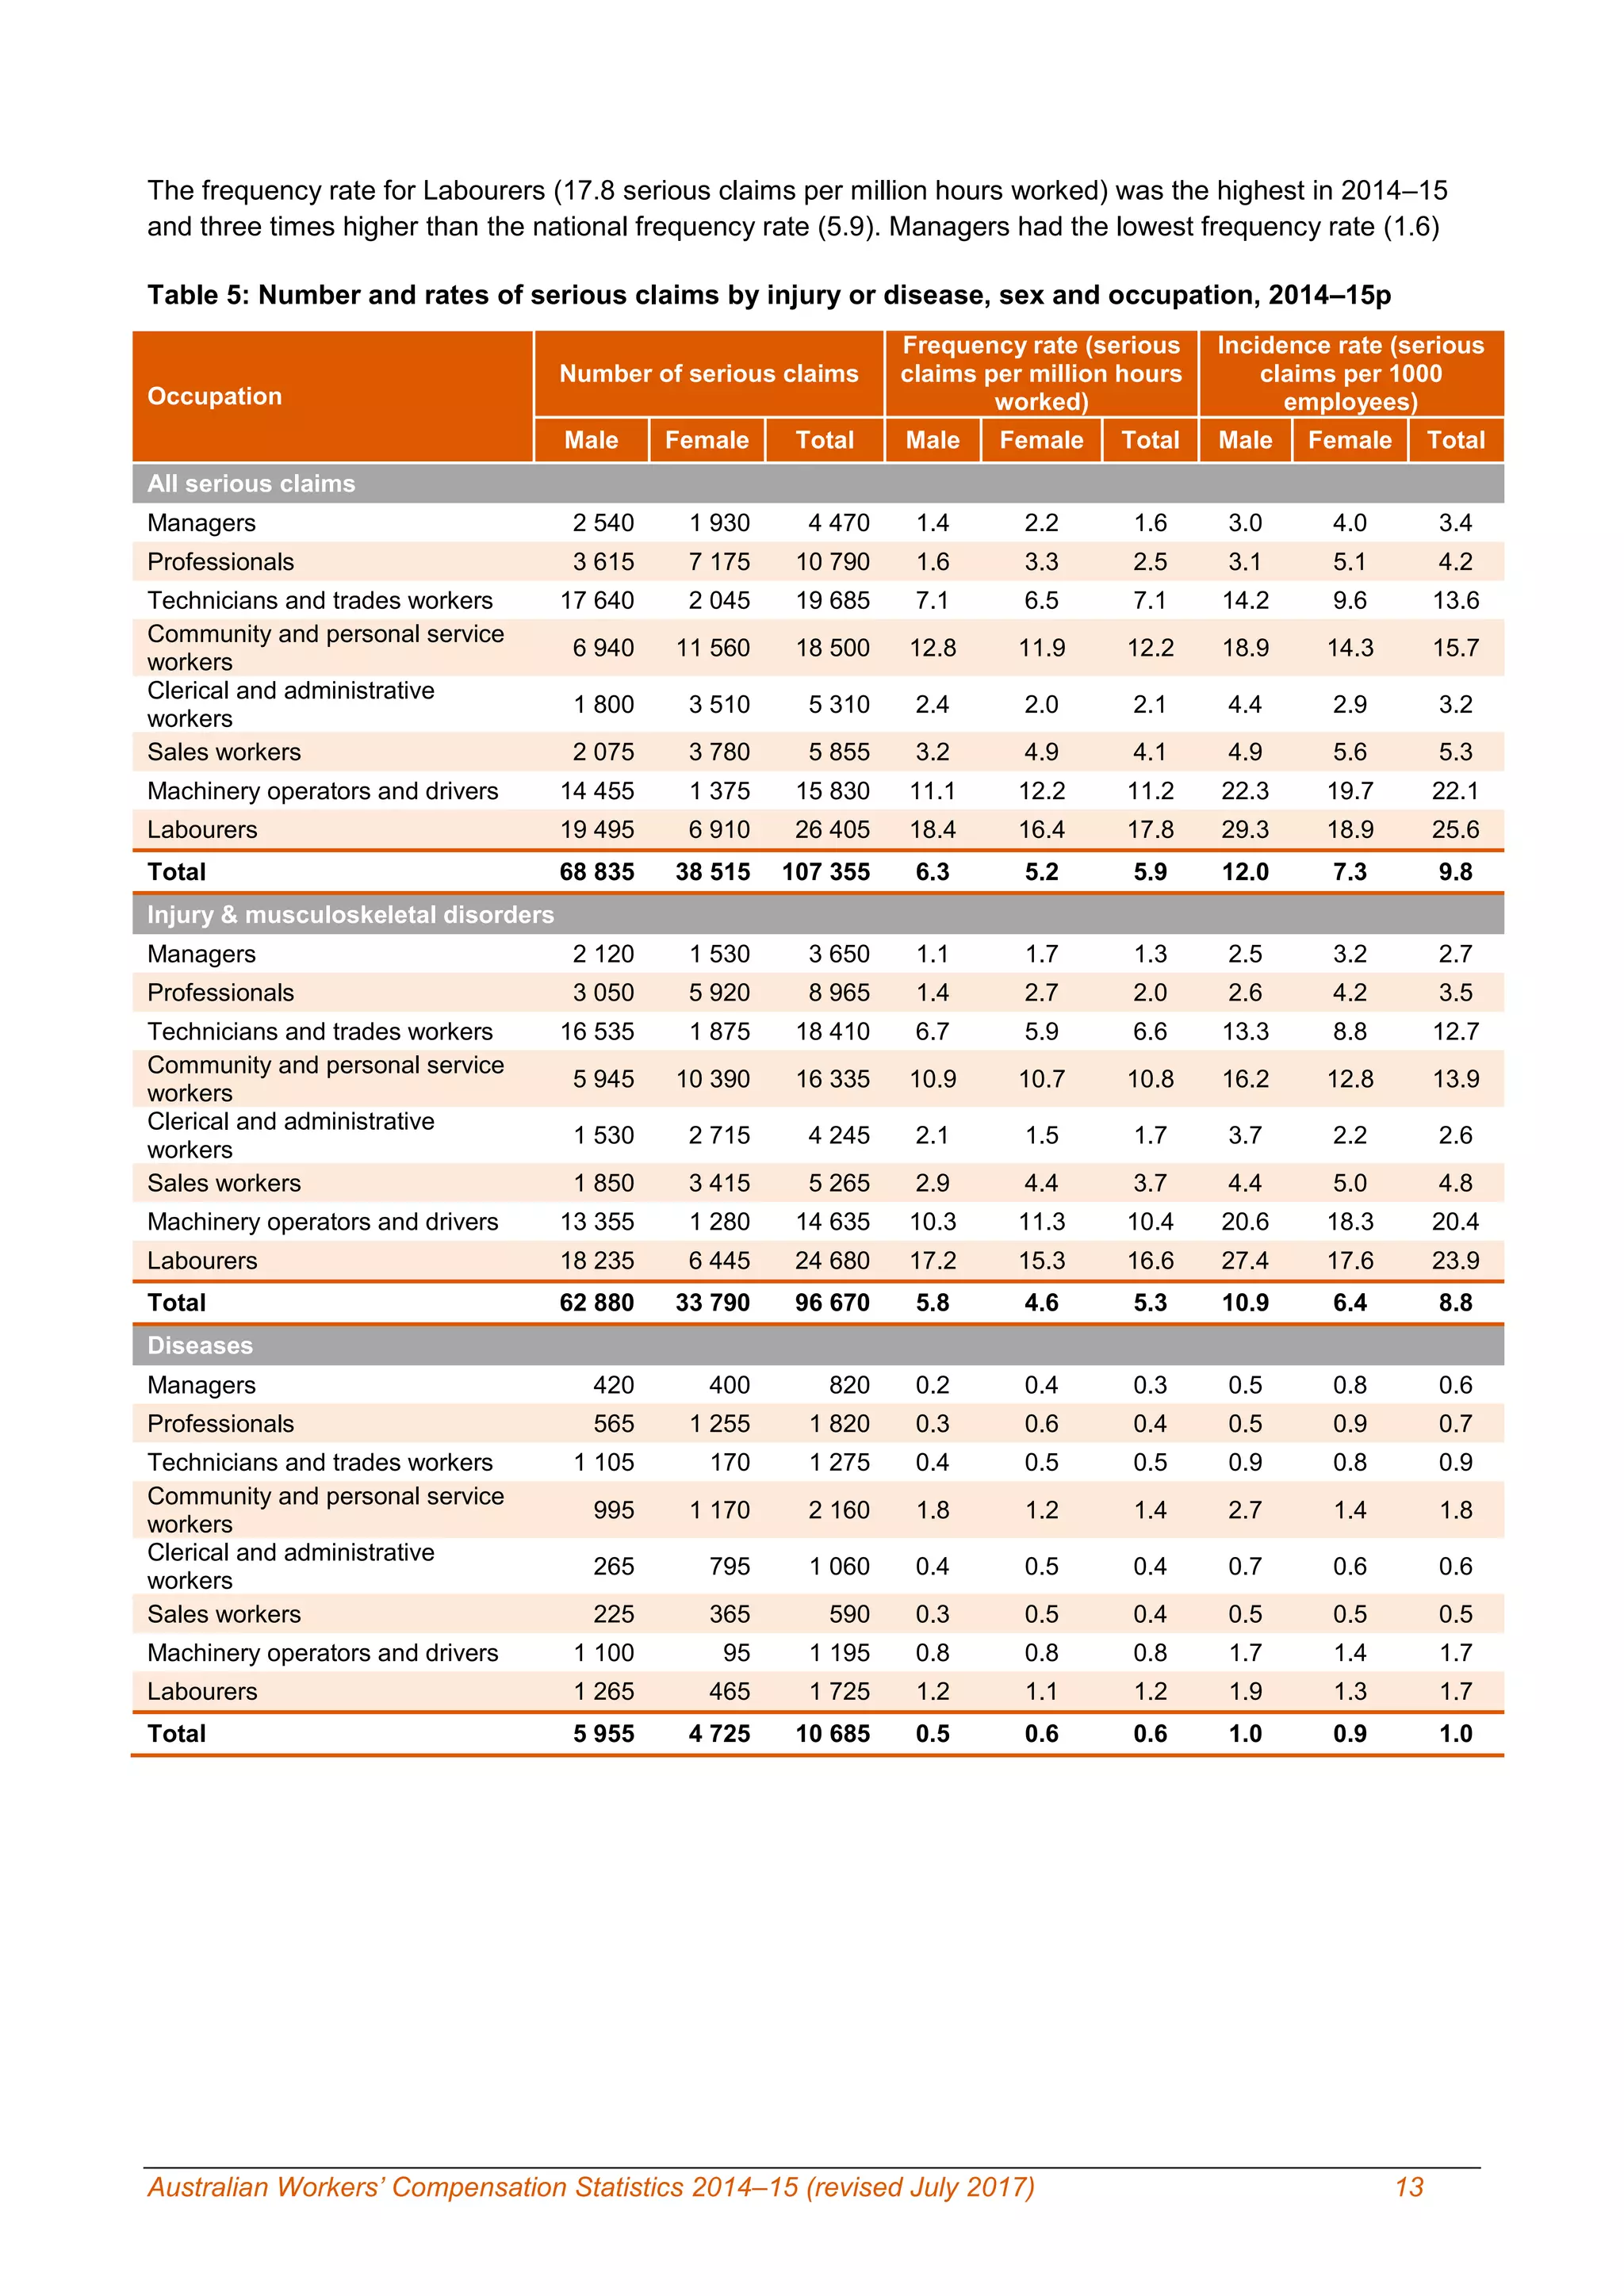
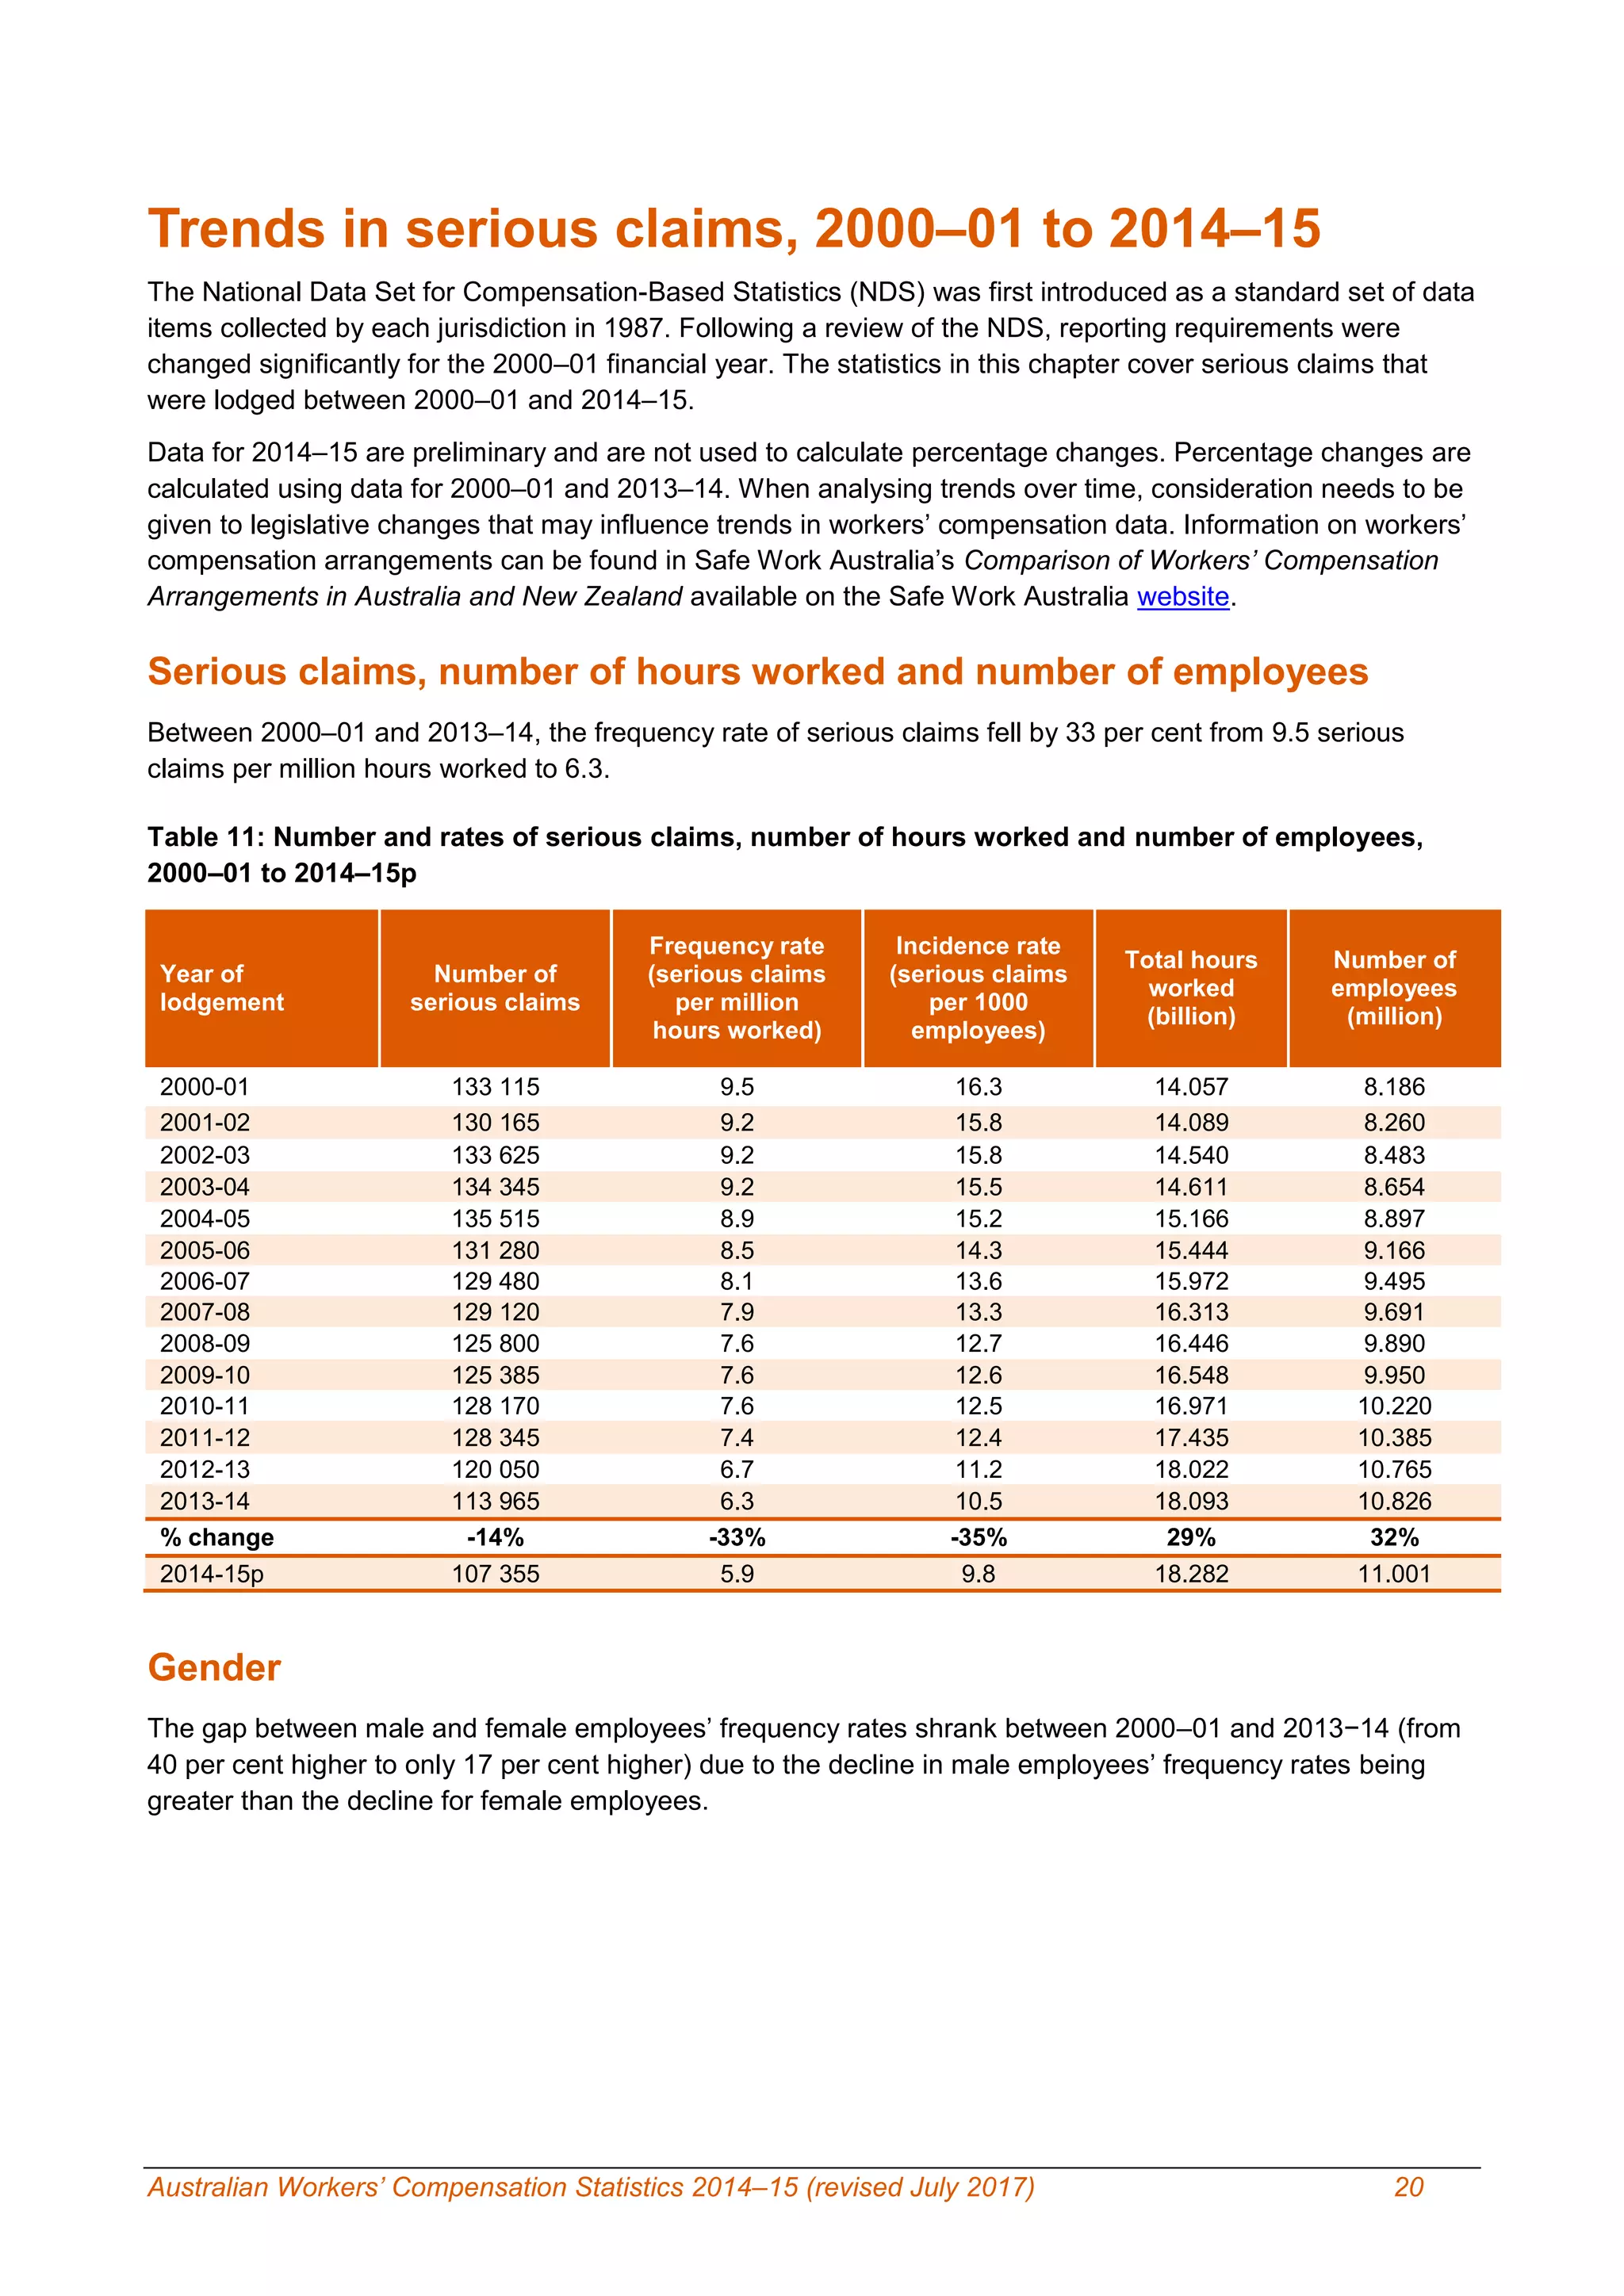
- There were an estimated 107,355 serious claims in 2014-15, equating to 5.9 claims per million hours worked.
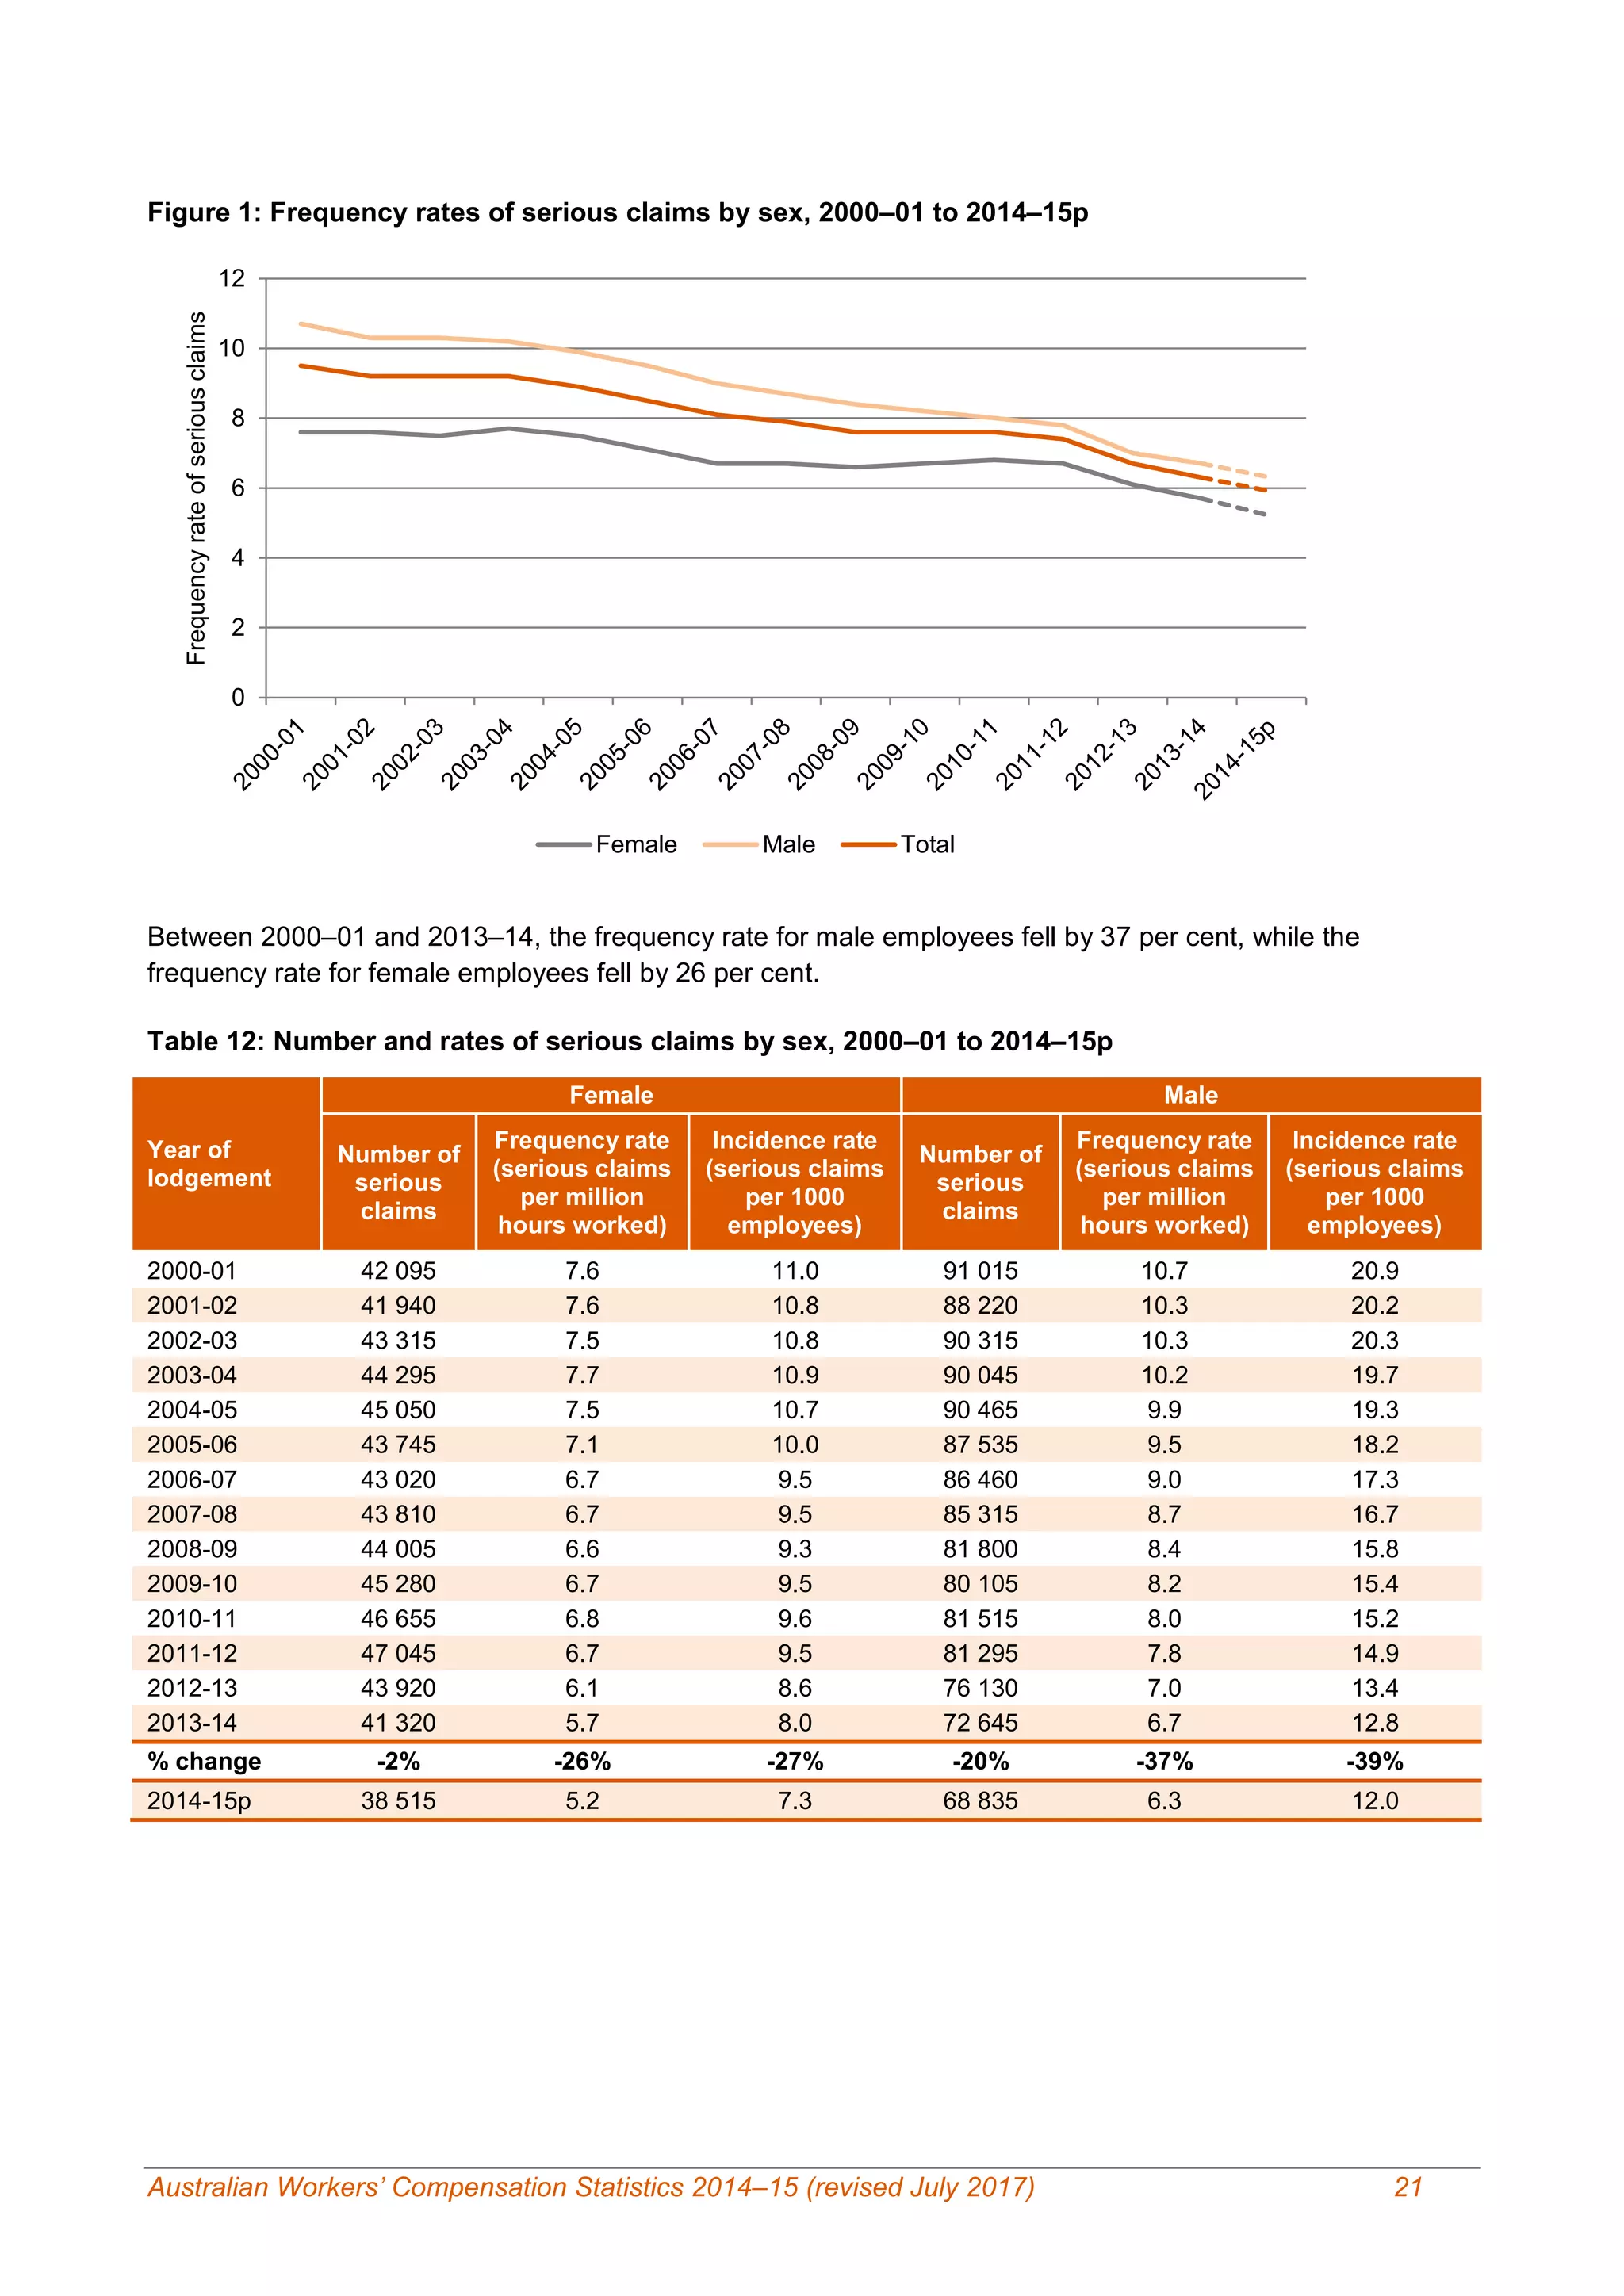
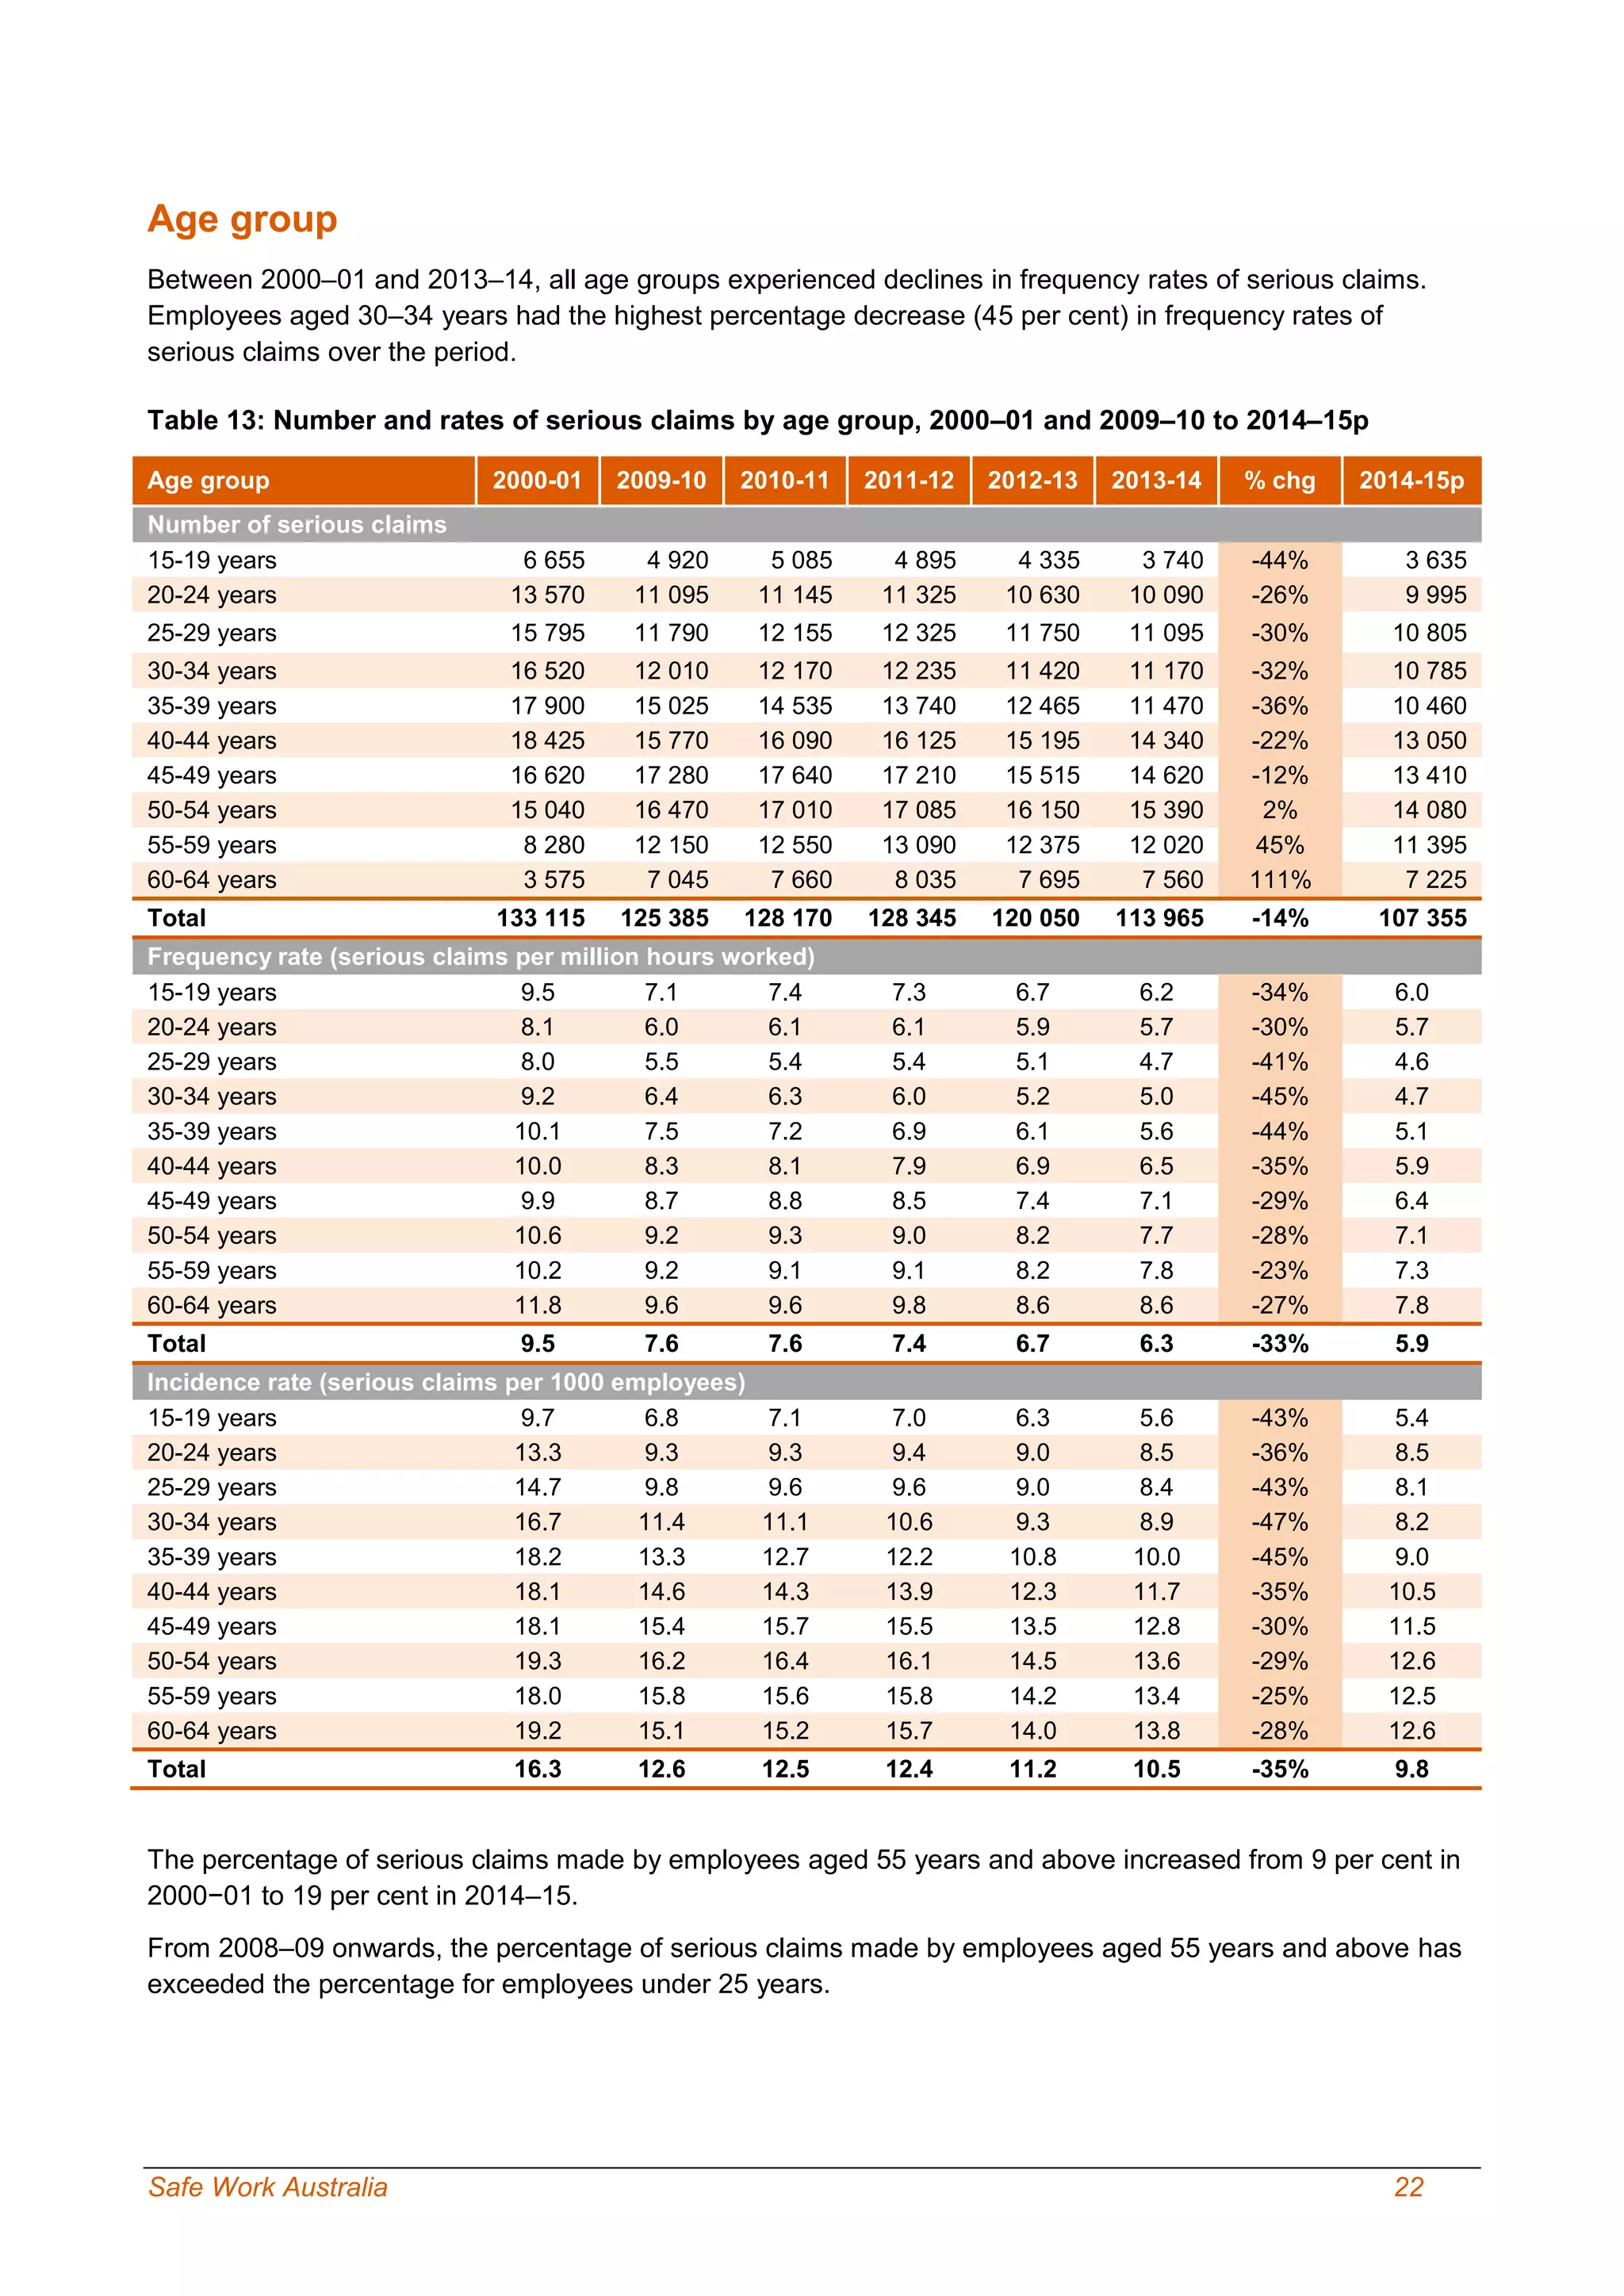
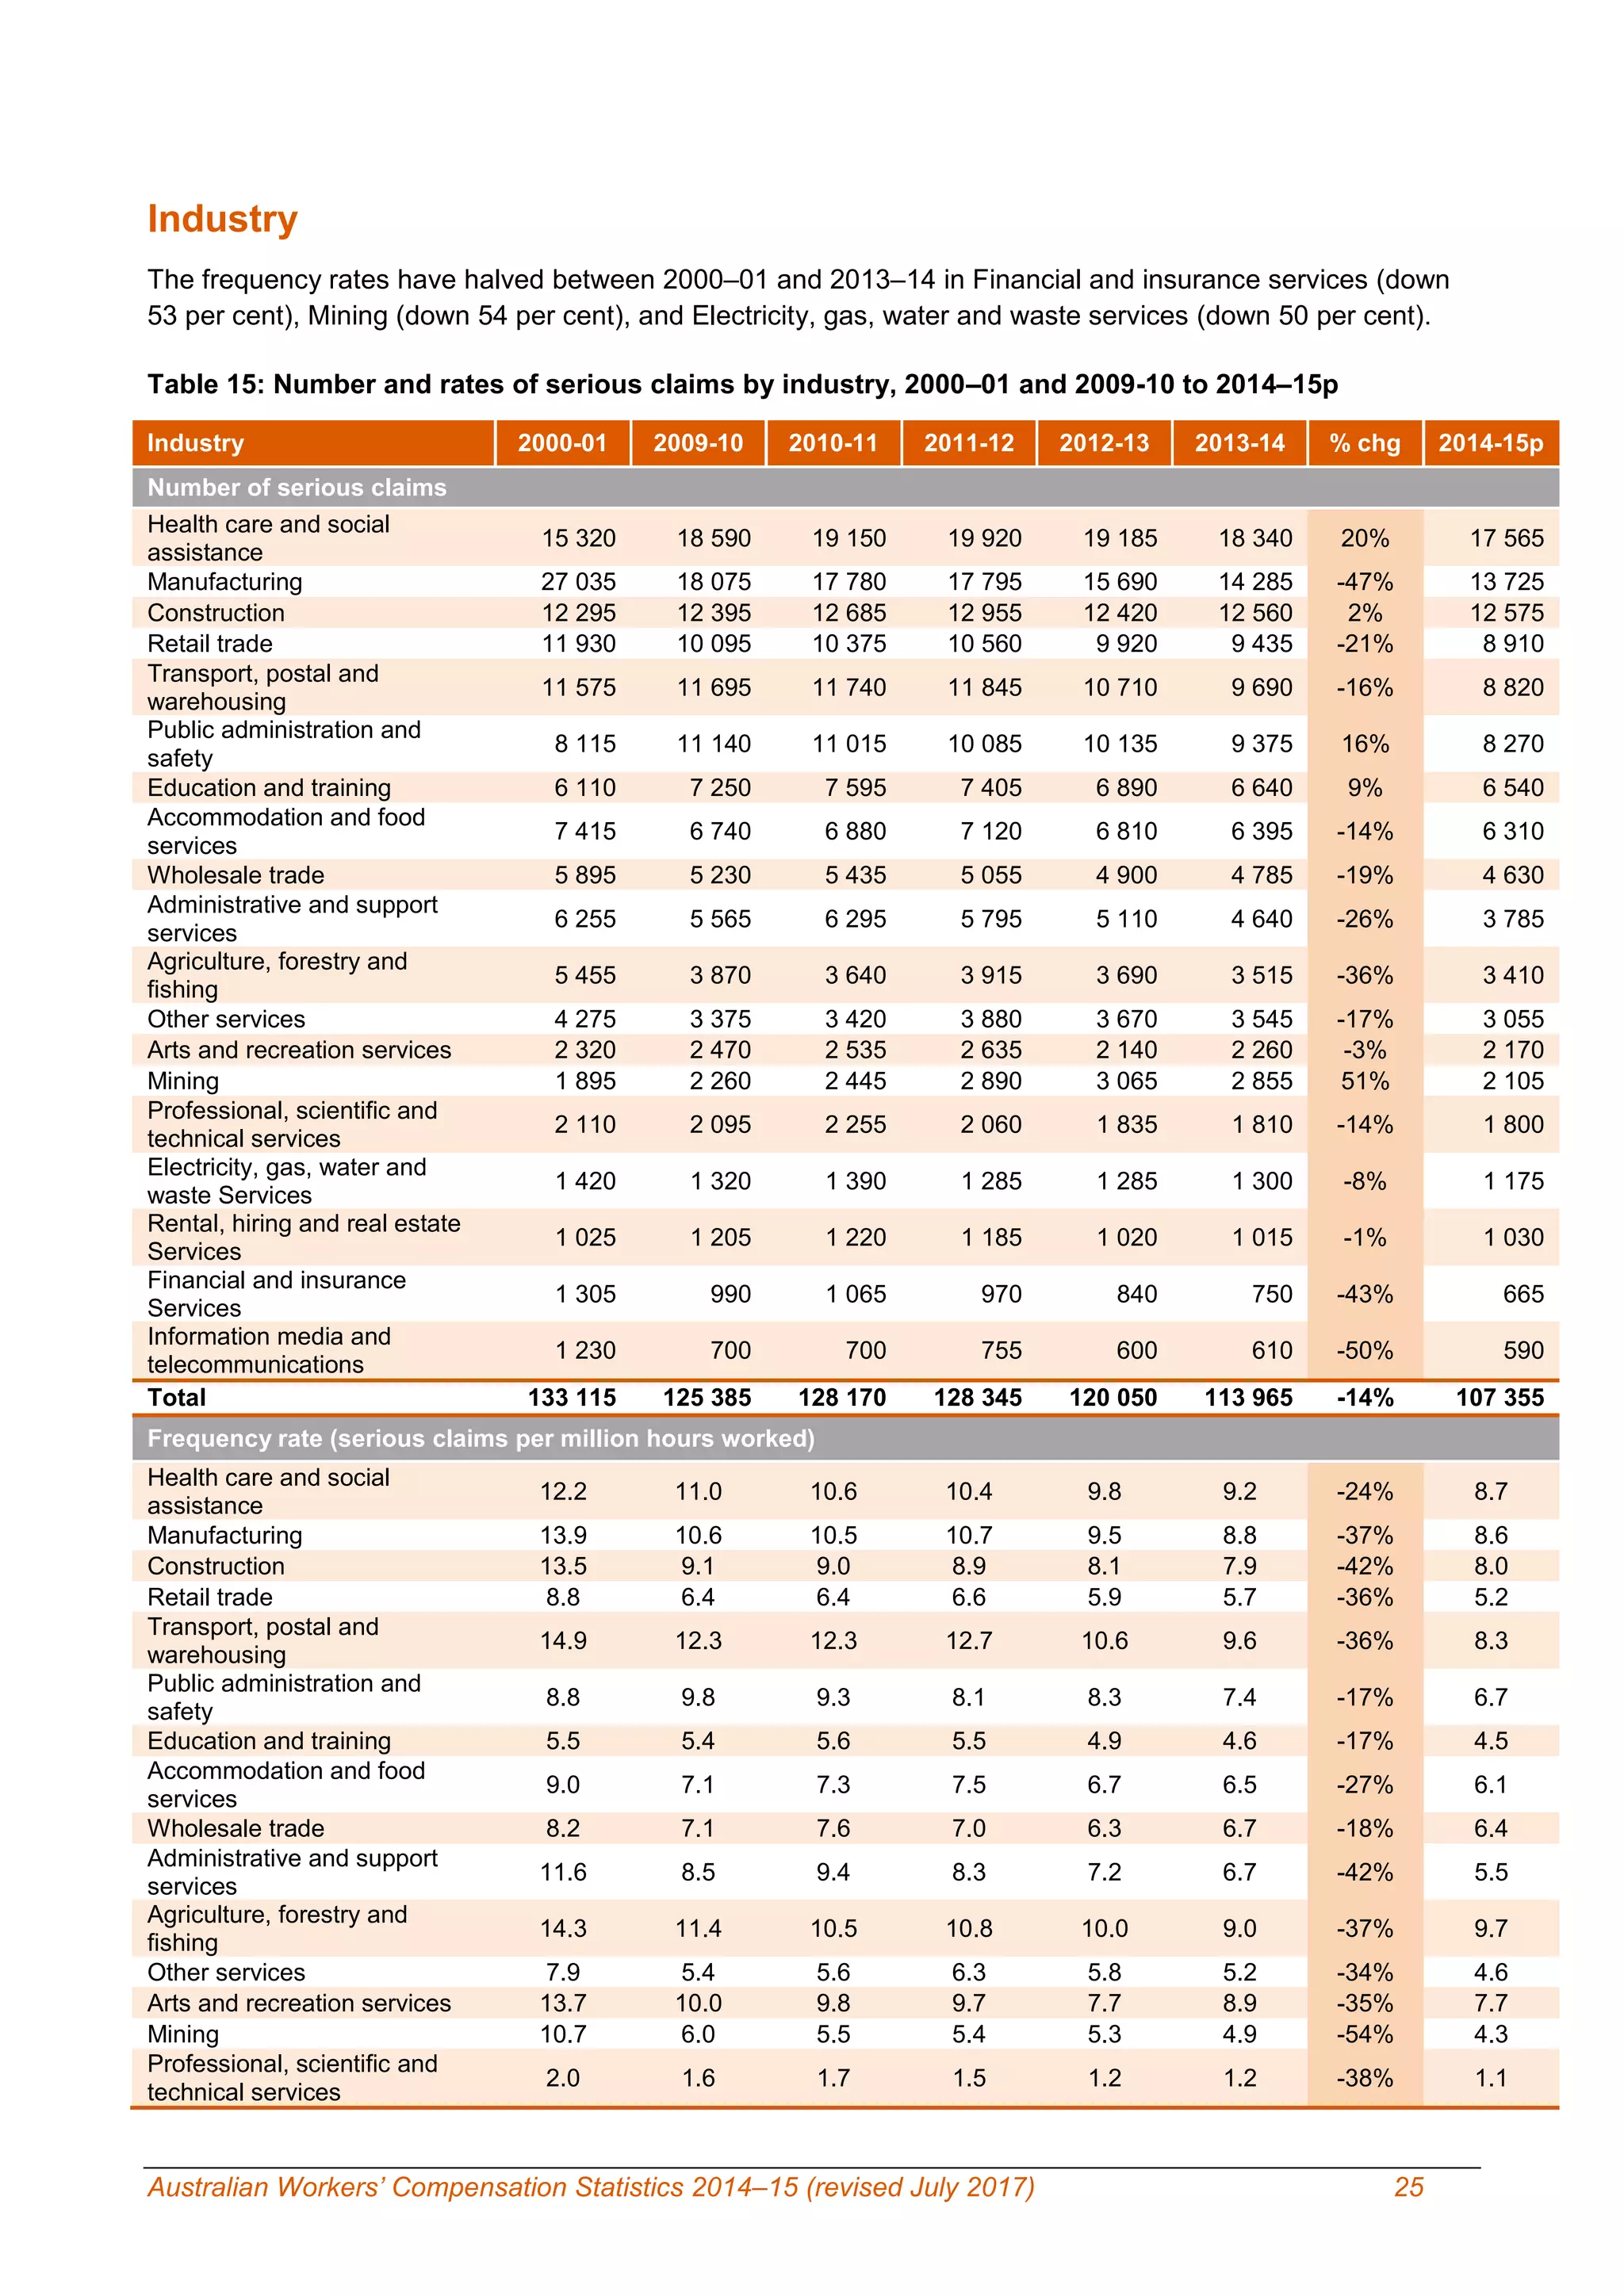
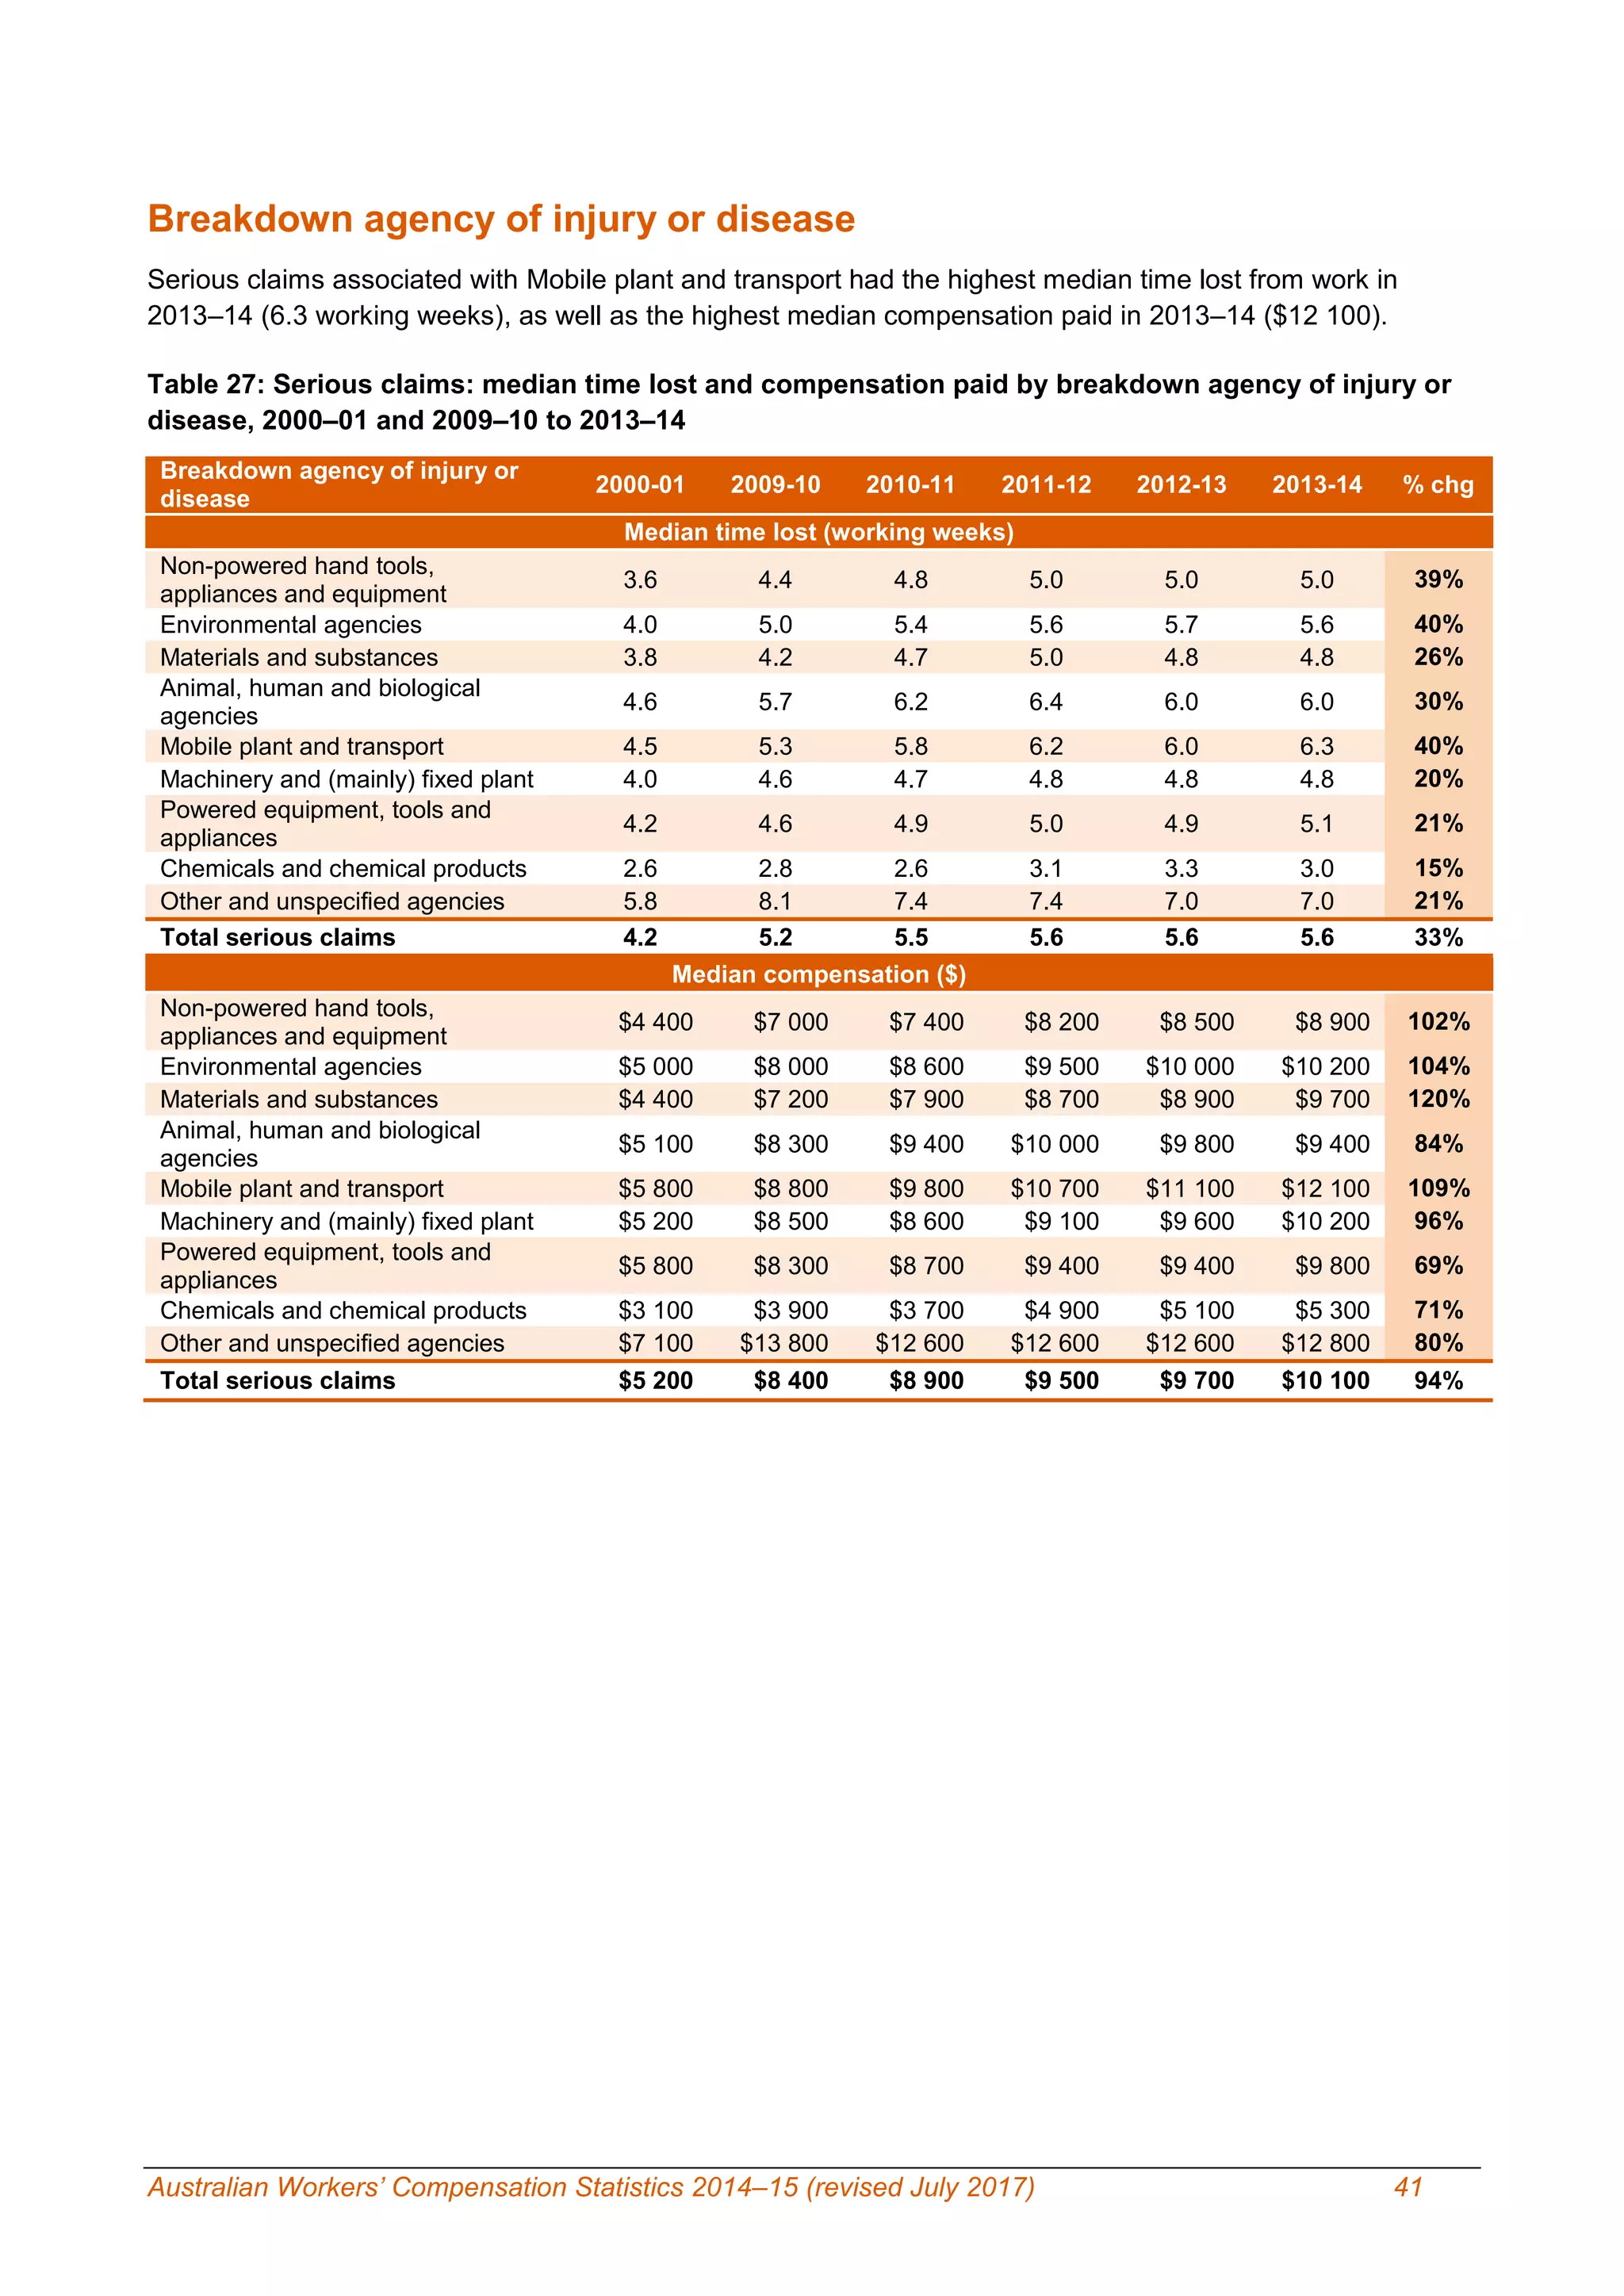
- Between 2000-01 and 2013-14, the frequency rate of serious claims fell 33% from 9.5 to 6.3 claims per million hours worked.
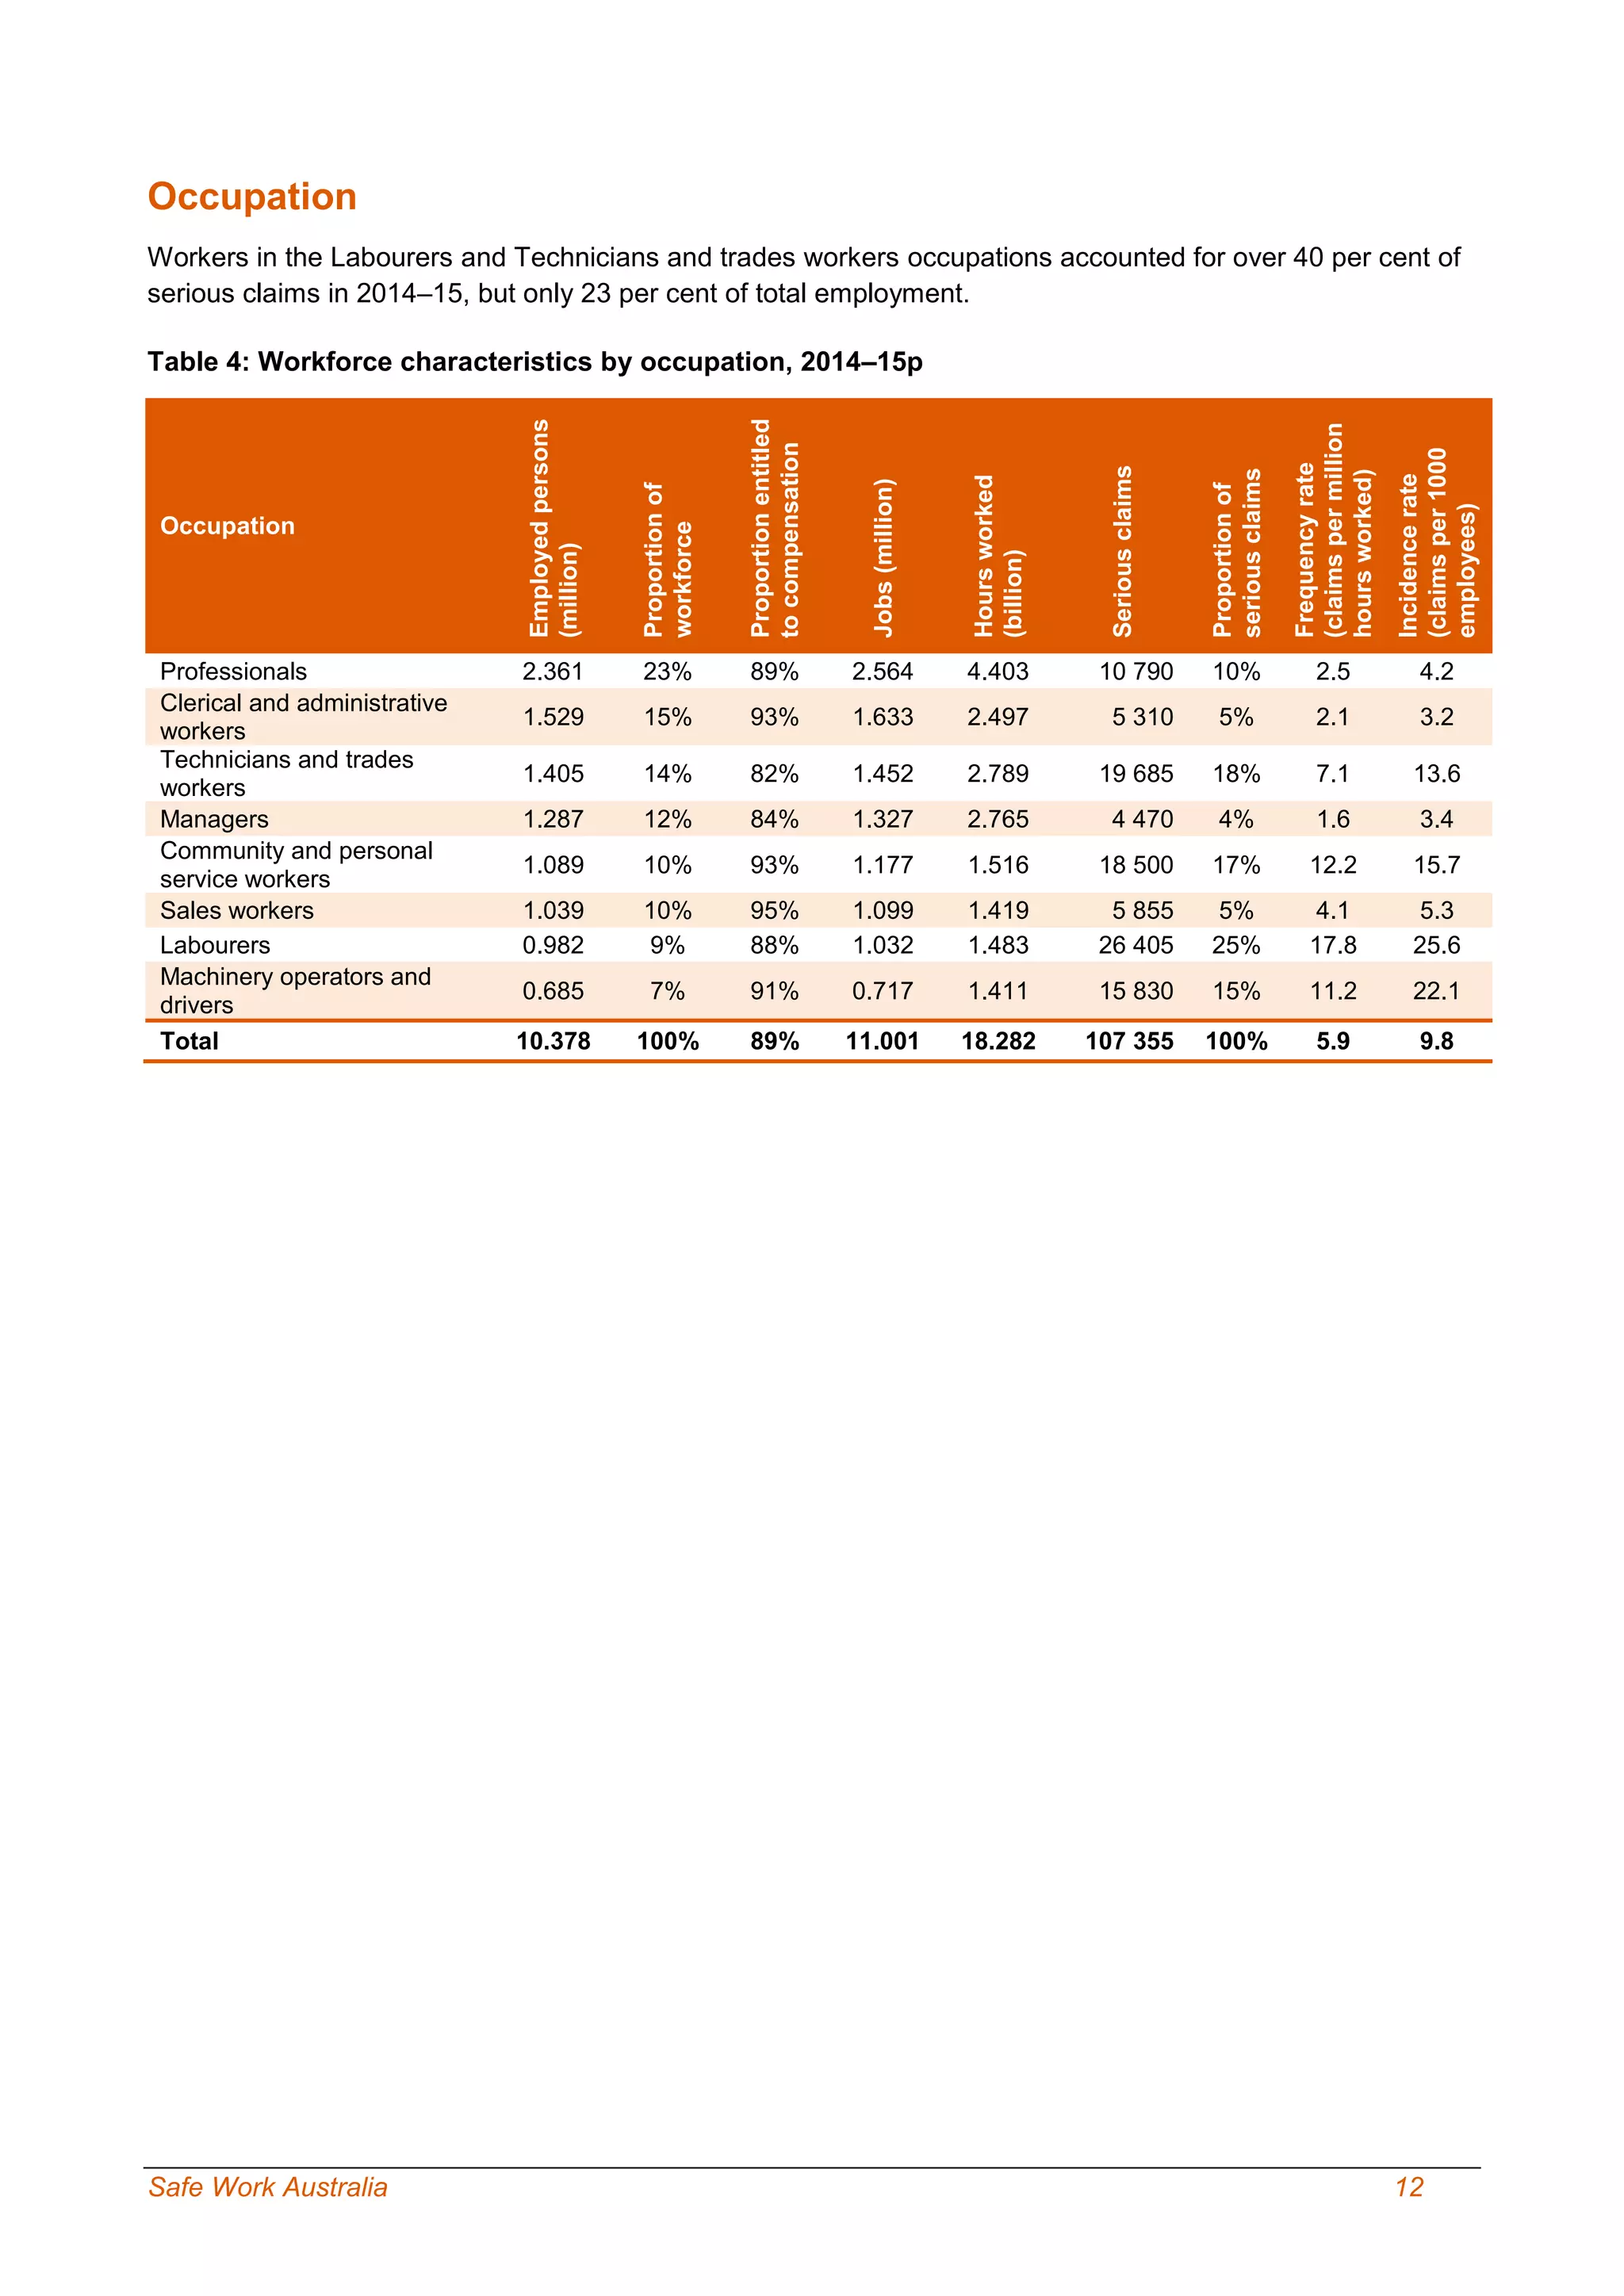
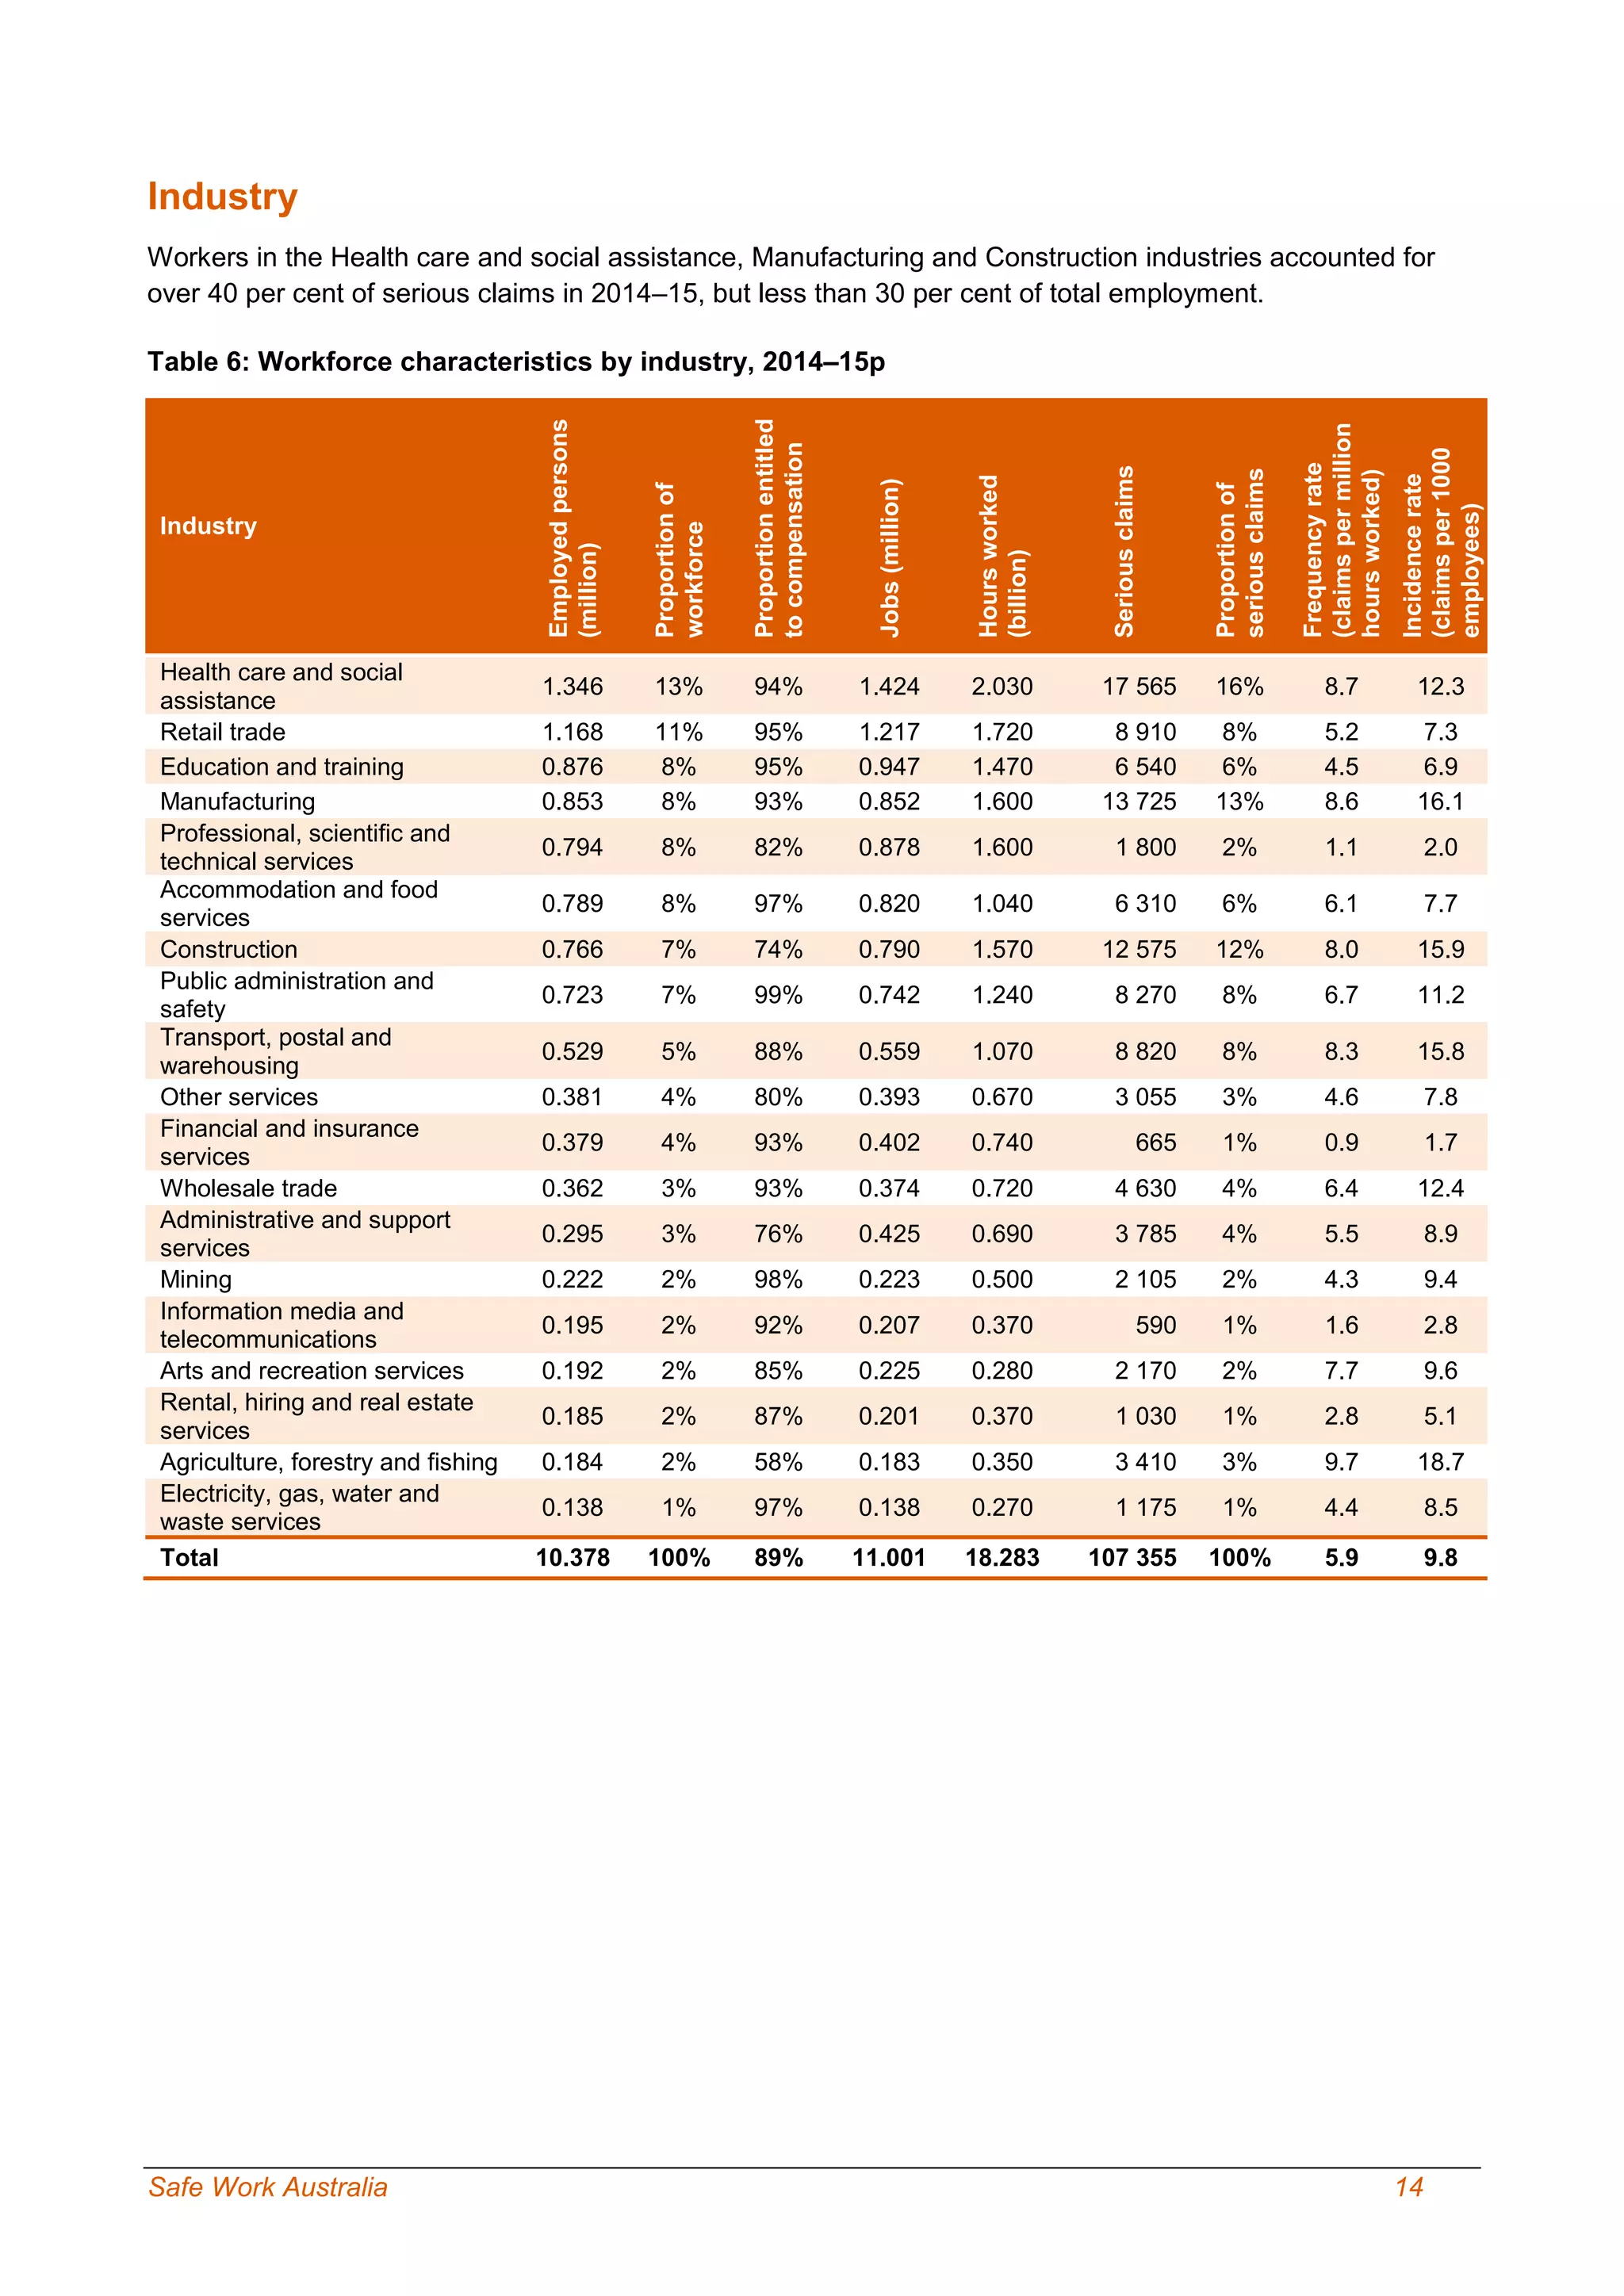
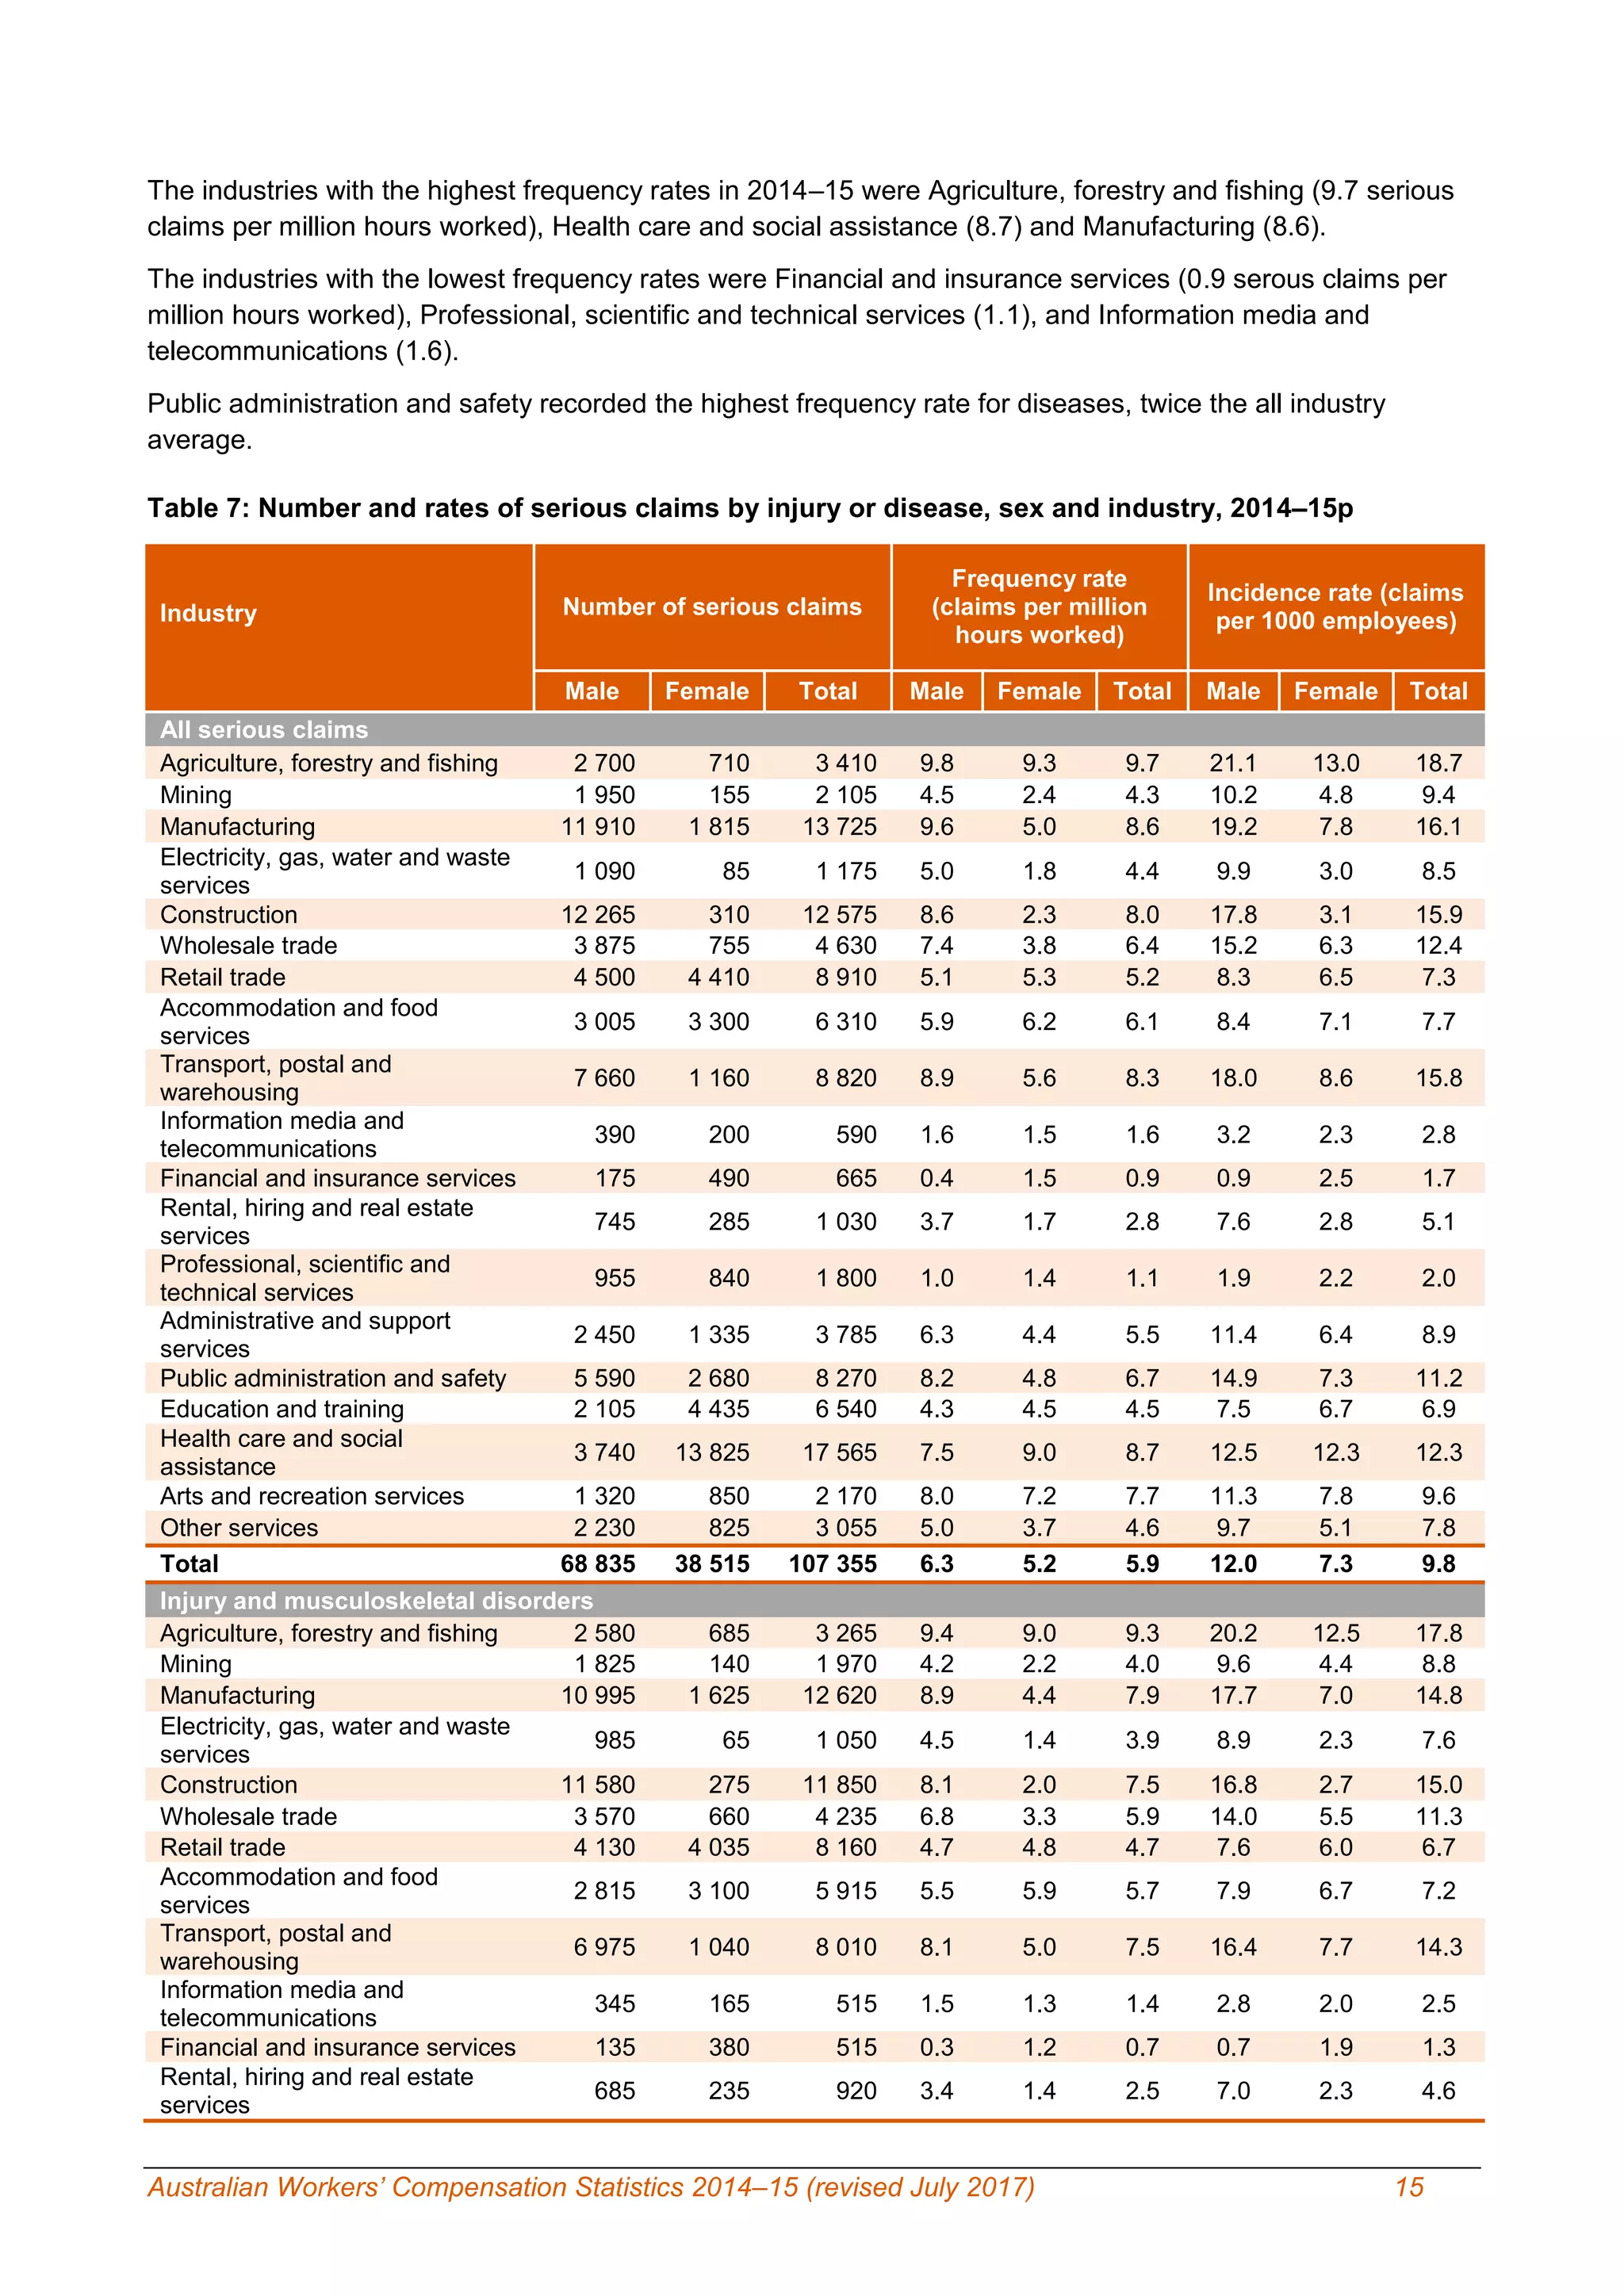
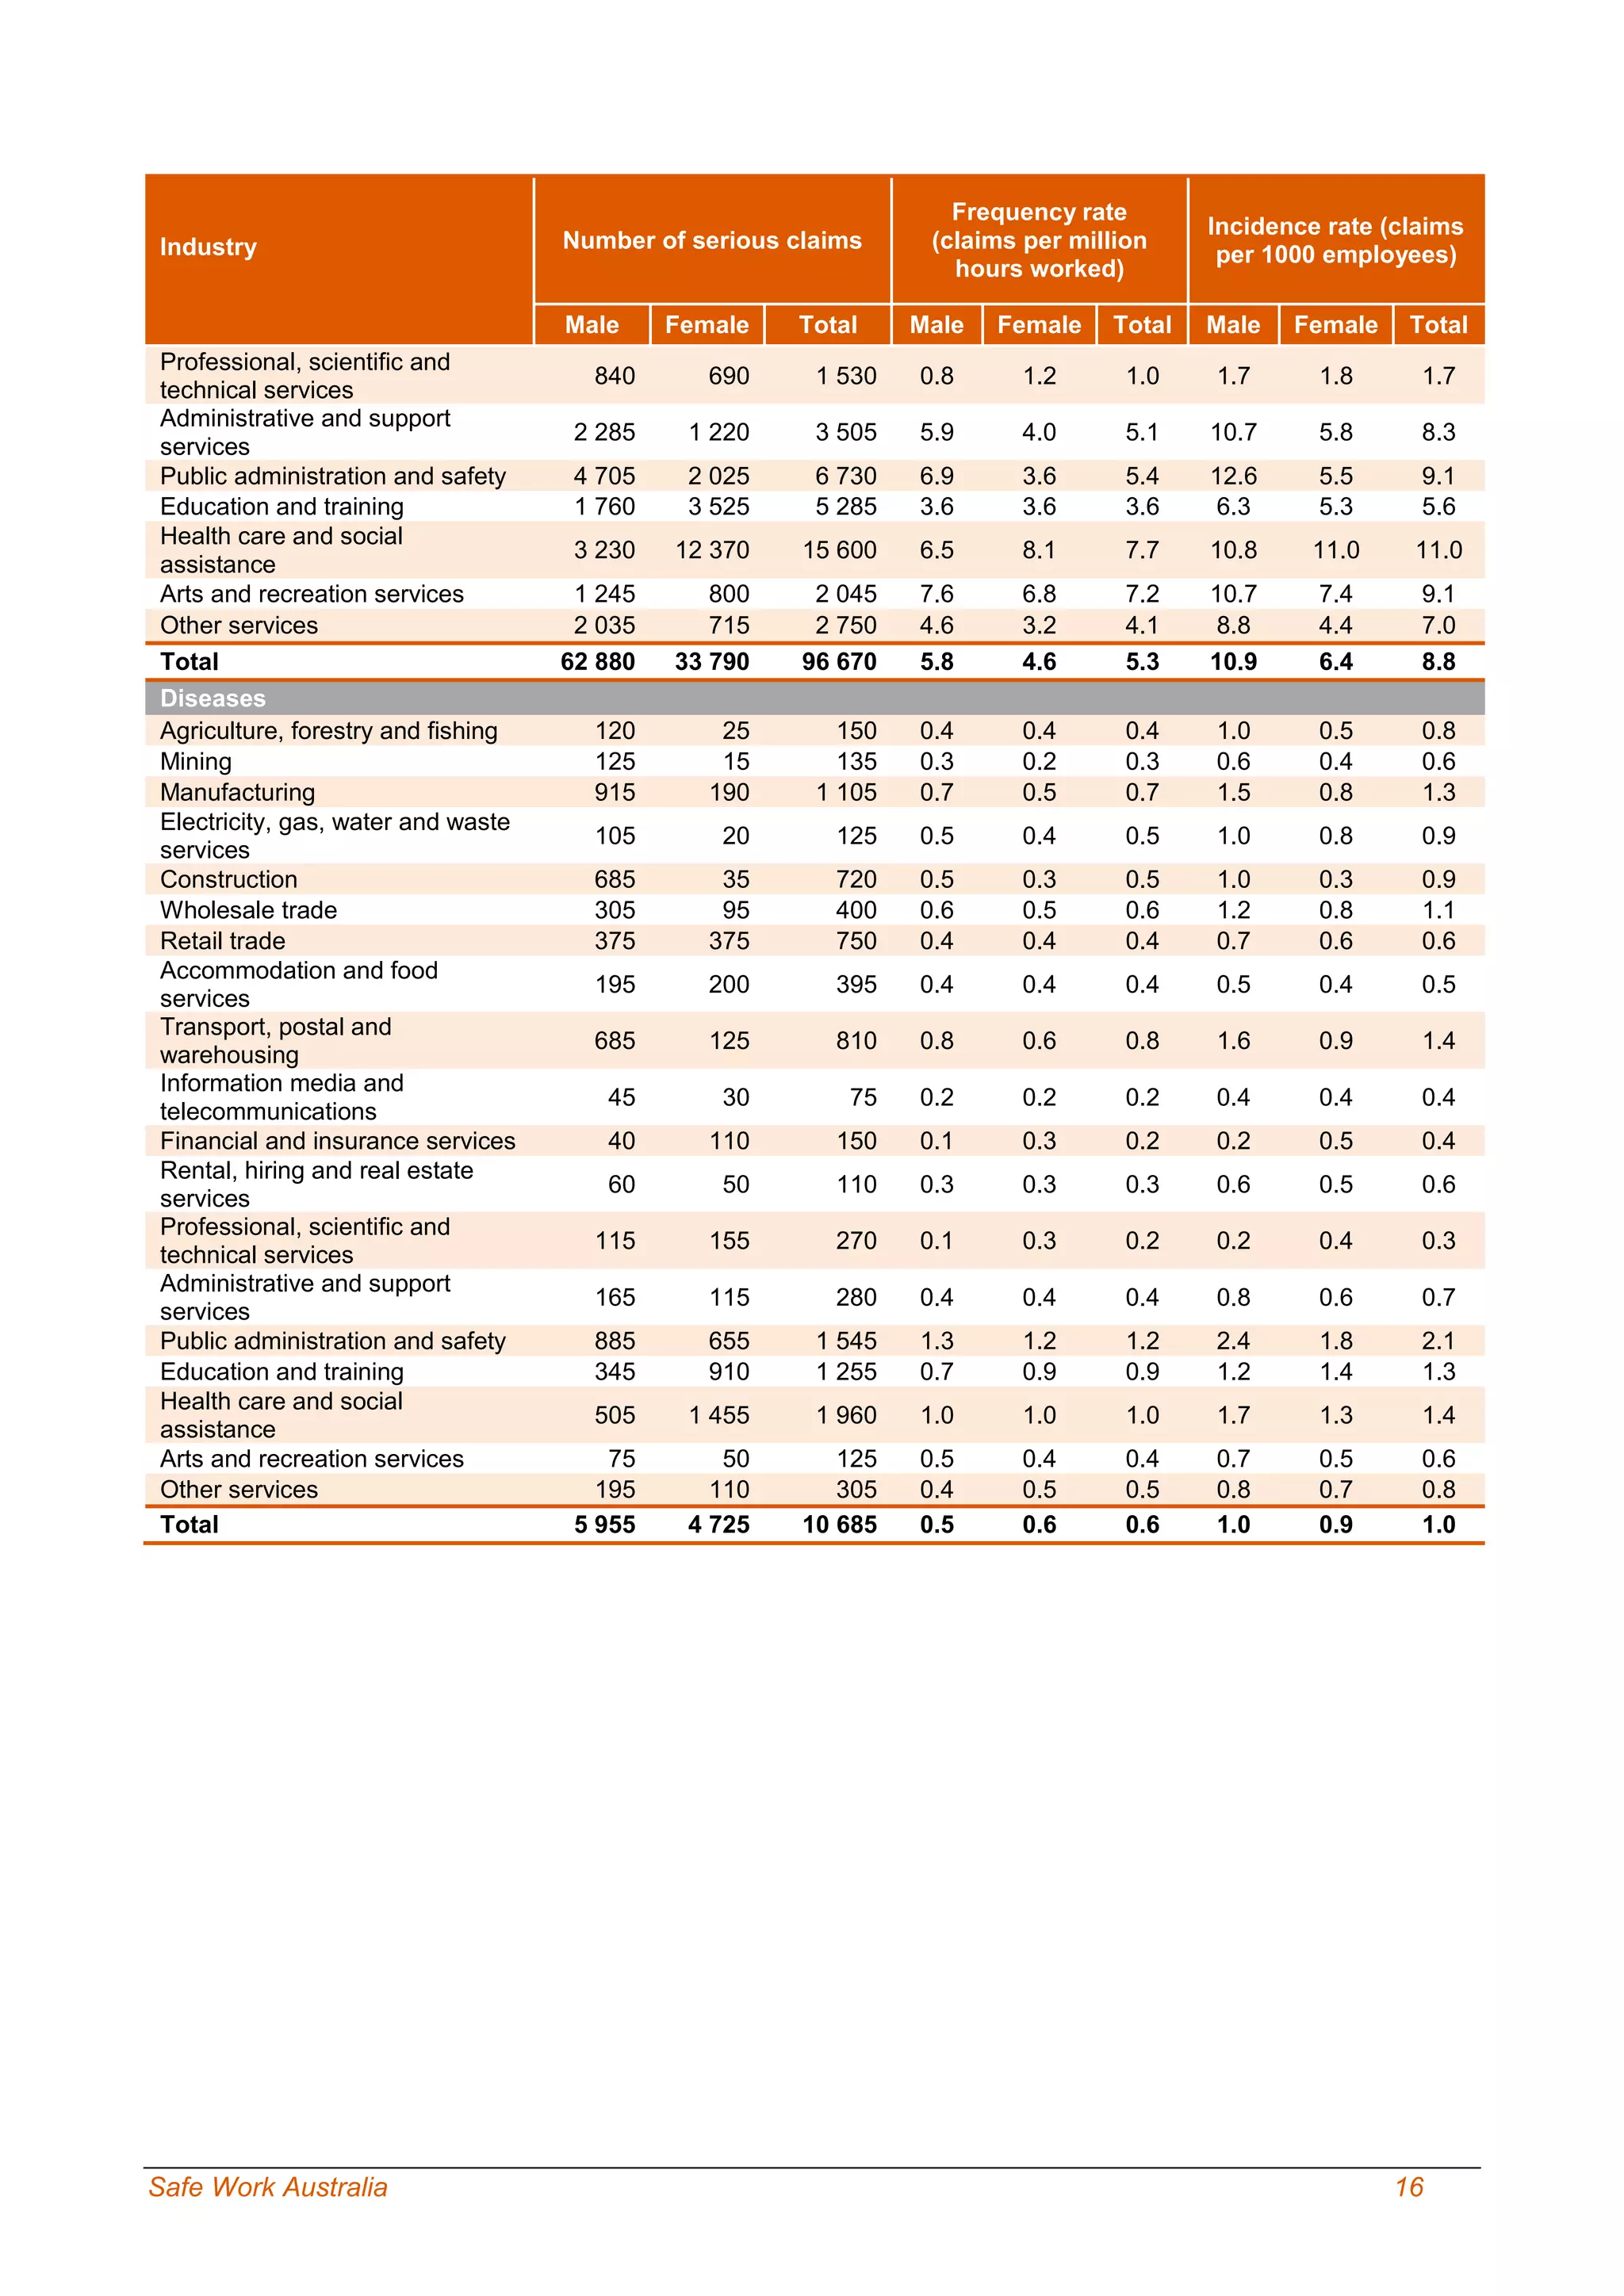
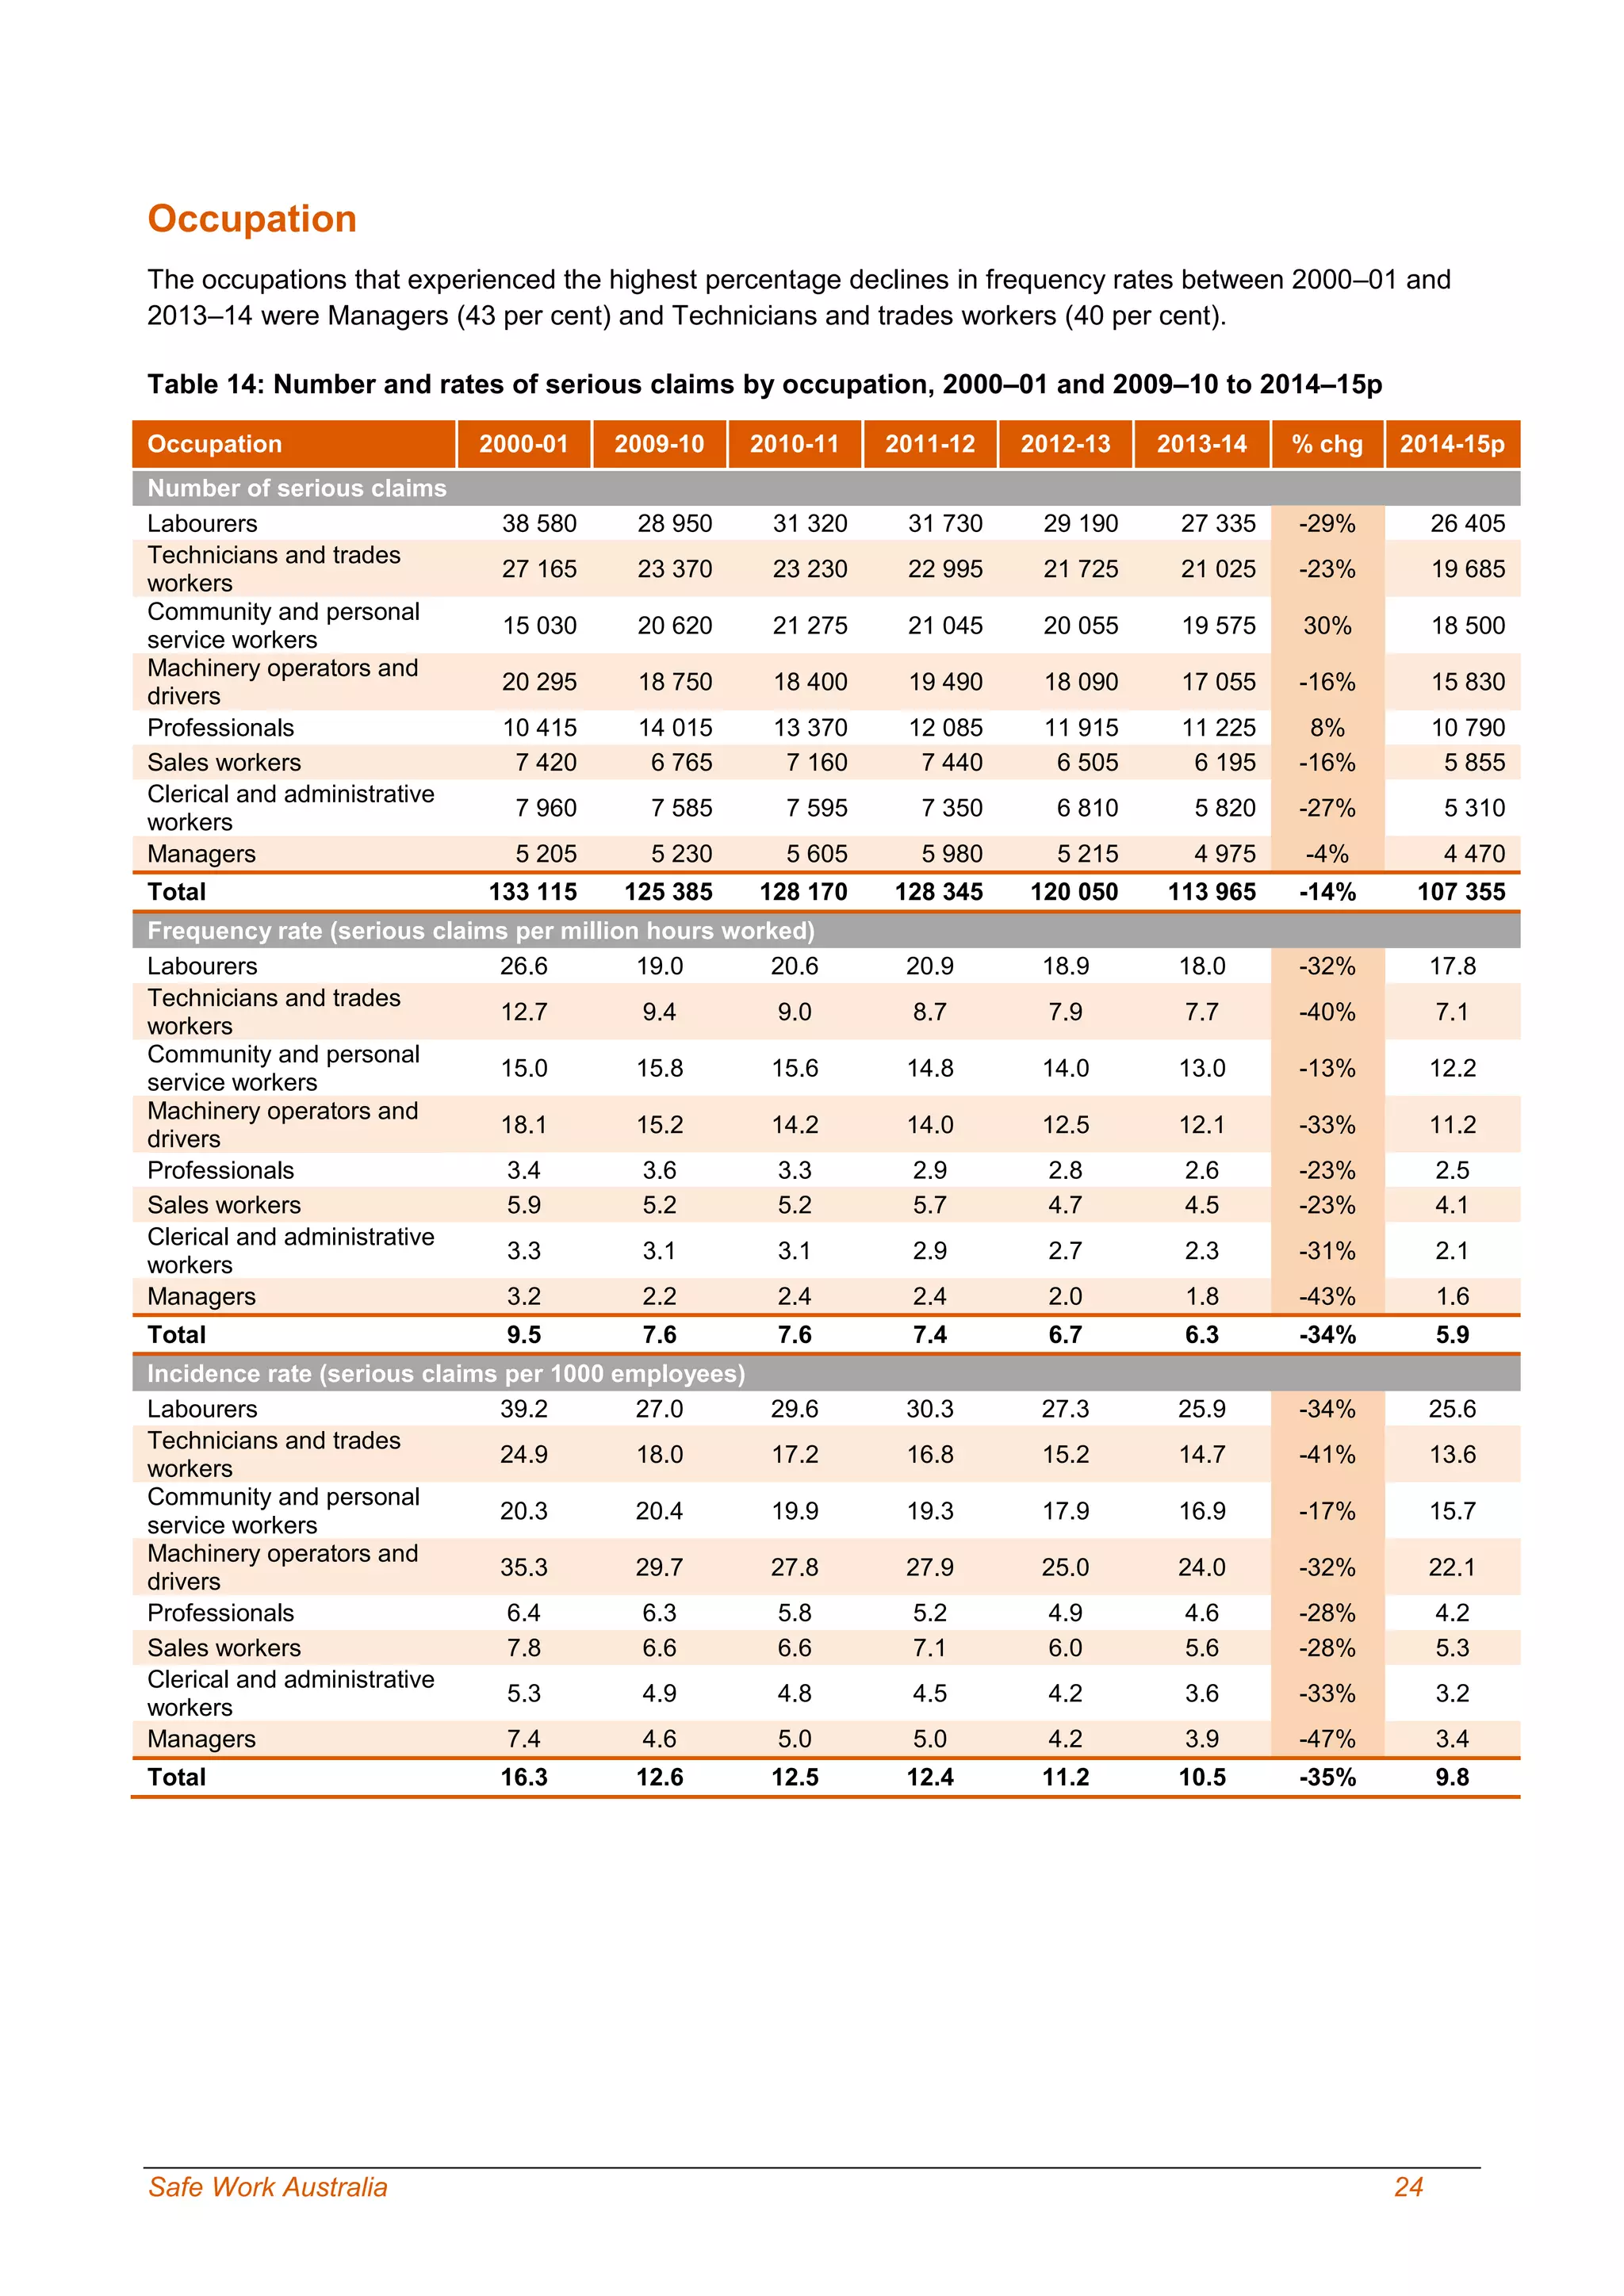
- In 2014-15, the top three occupations and industries for serious claim rates were labourers, community/personal service workers, and machinery operators/drivers; and agriculture/forestry/fishing, health care, and manufacturing respectively.
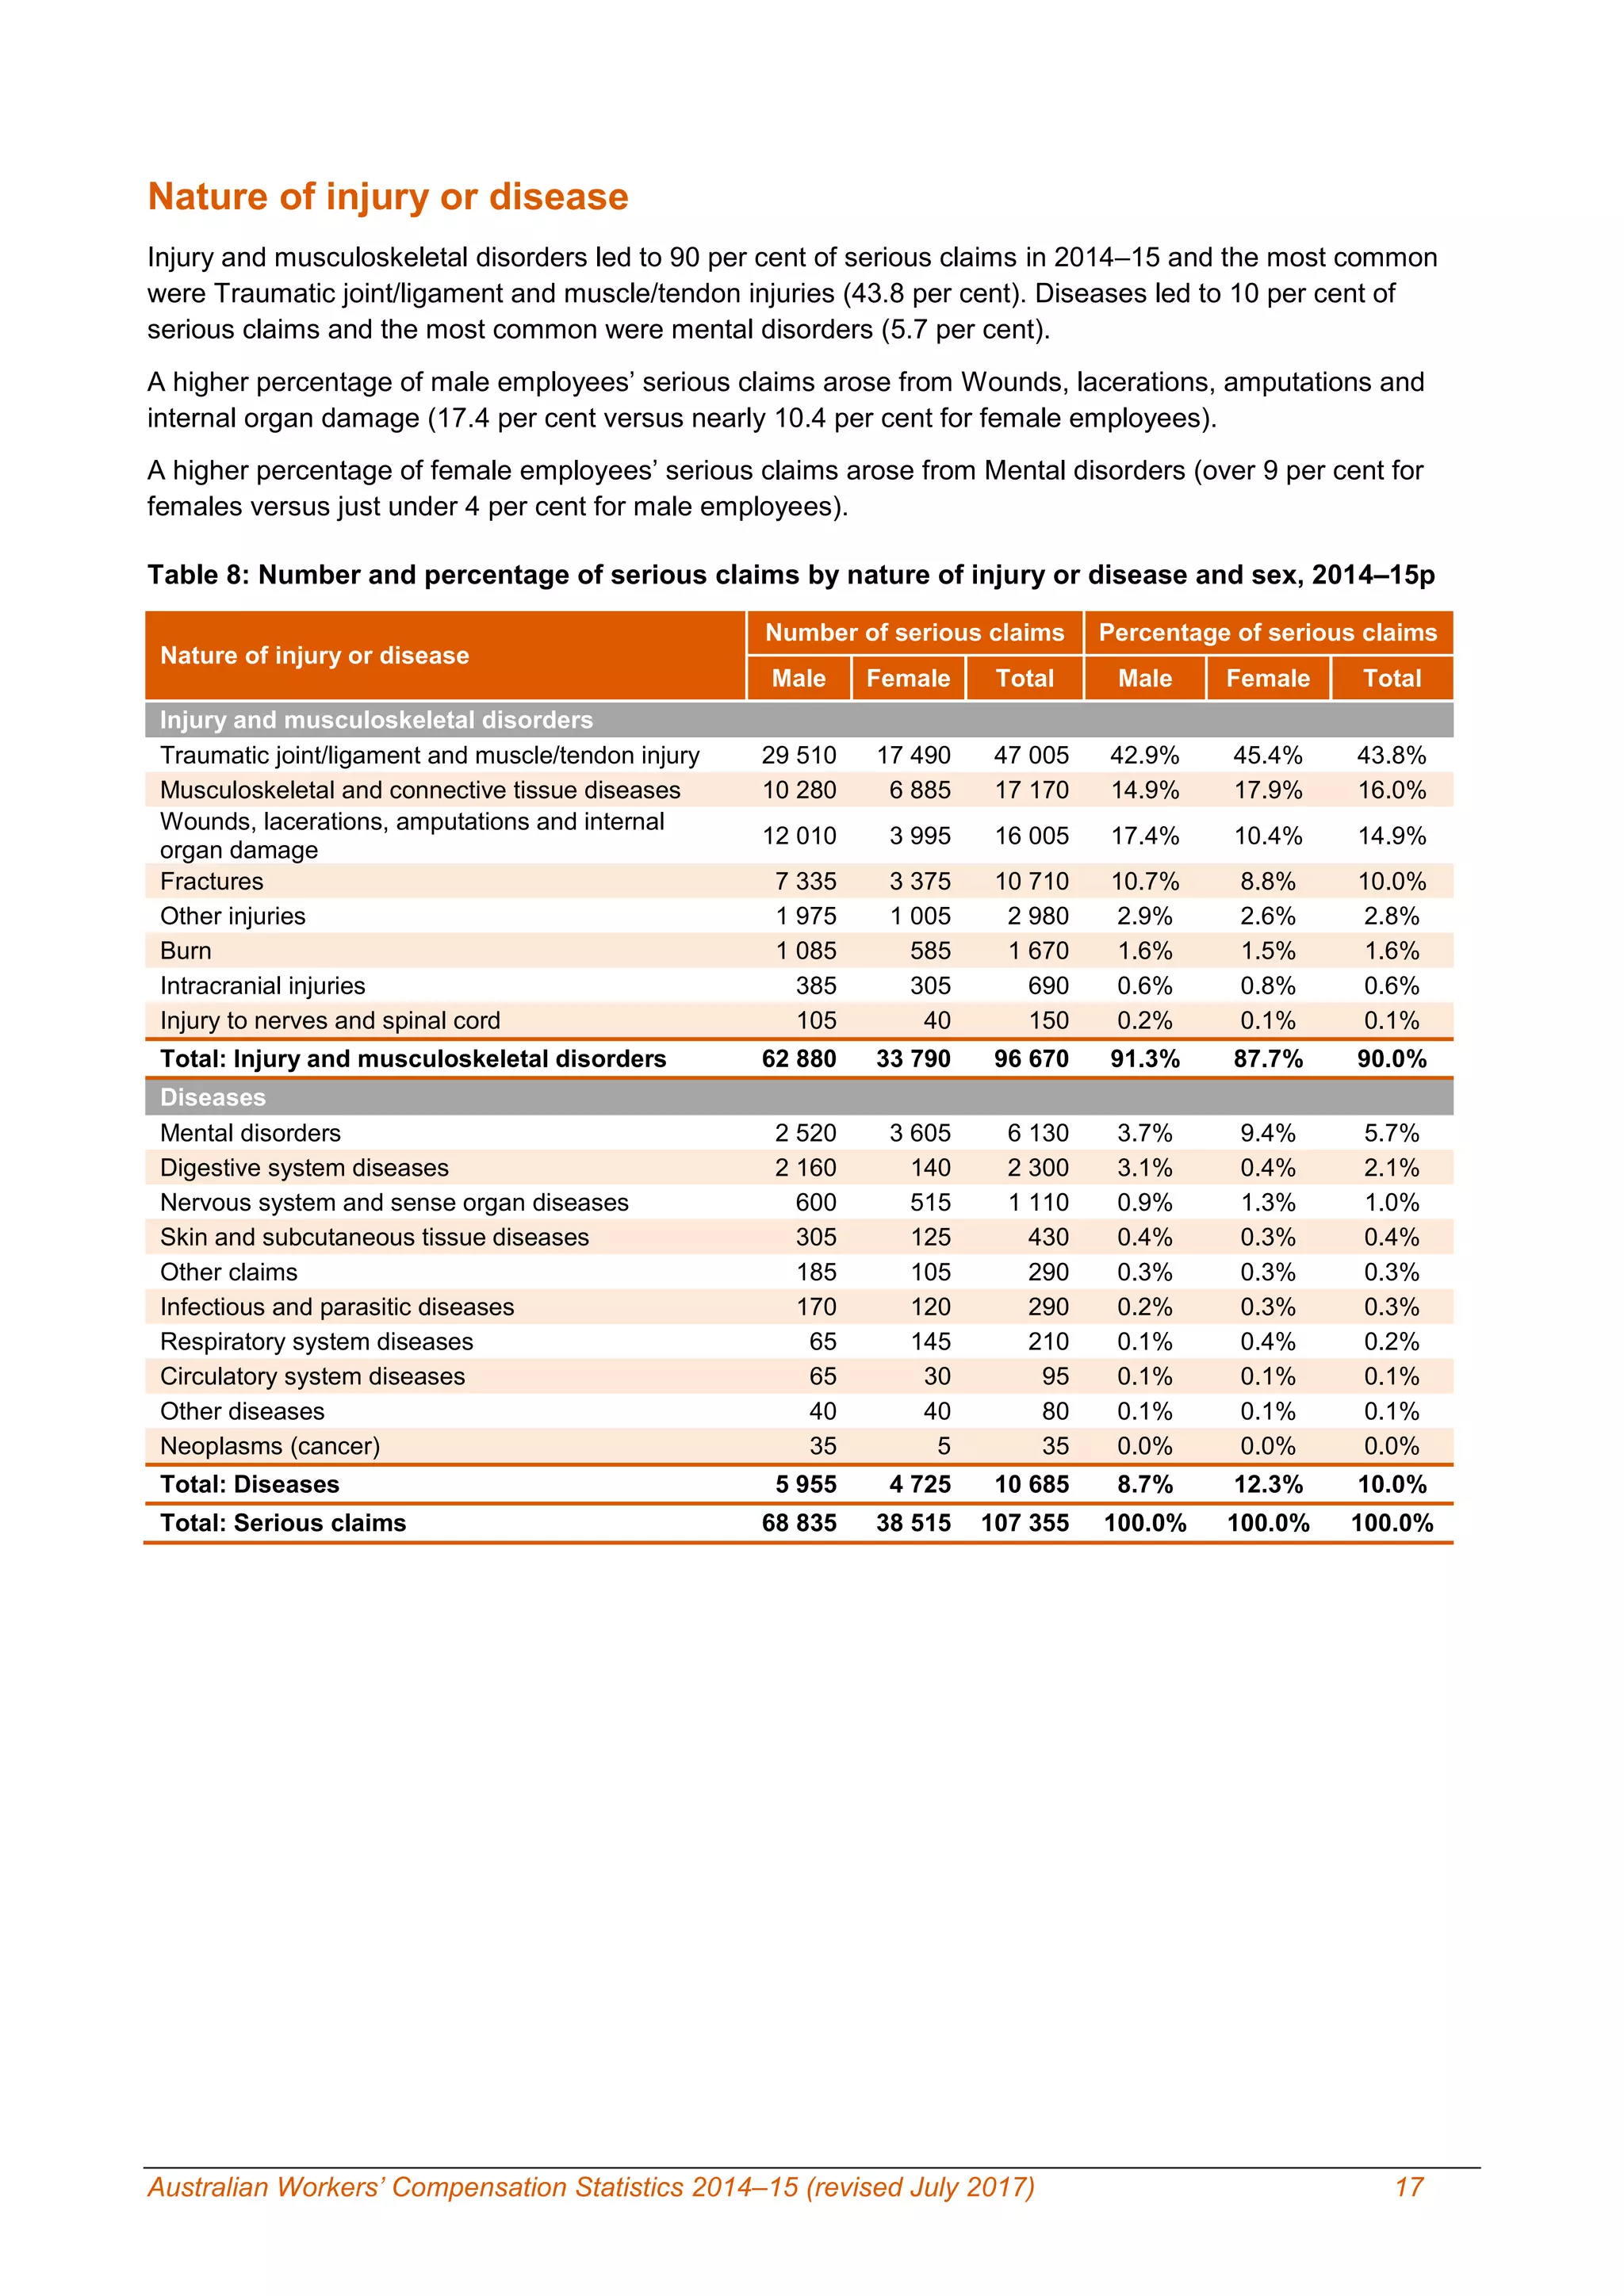
- The majority