This document provides a summary of Australian workers' compensation statistics for 2011-12, including trends over time. Some key findings are:
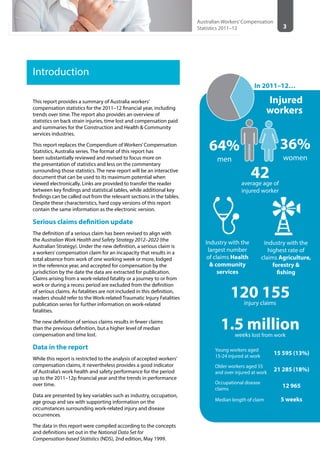
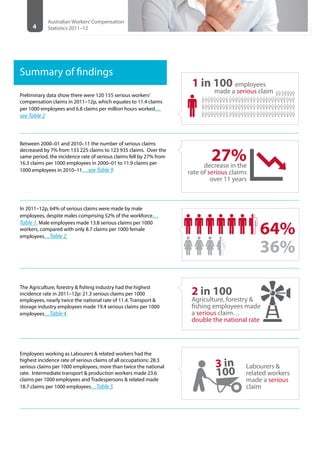
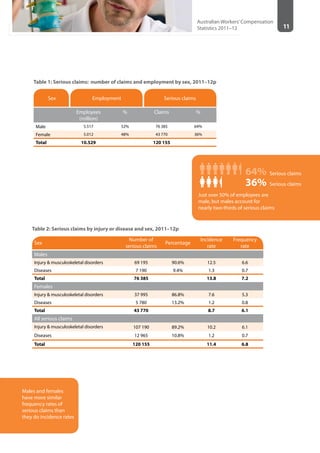
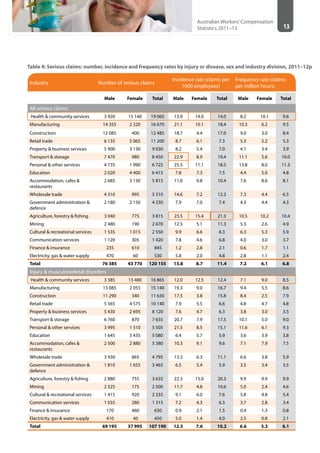
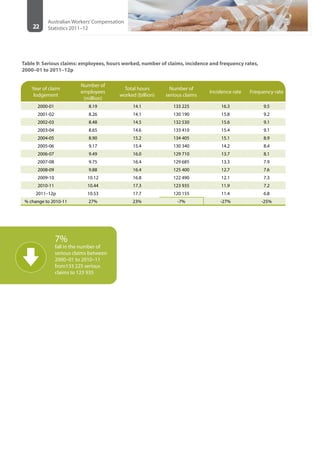
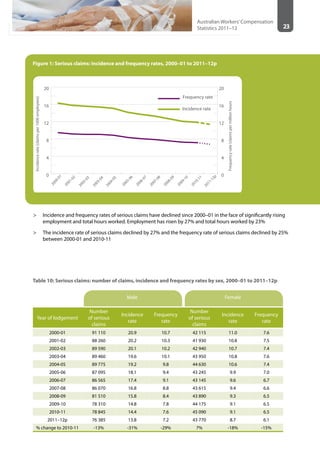
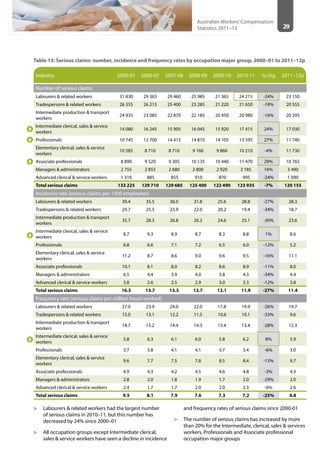
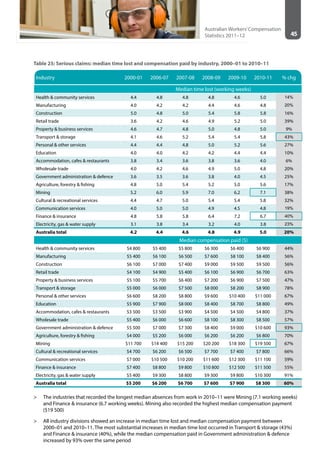
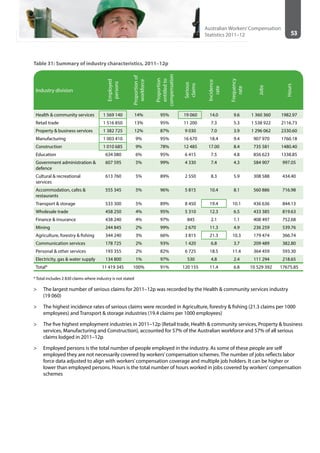
- There were 120,155 serious claims in 2011-12, with rates of 11.4 claims per 1,000 employees and 6.8 claims per million hours worked.
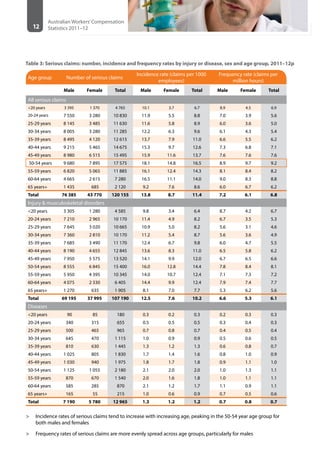
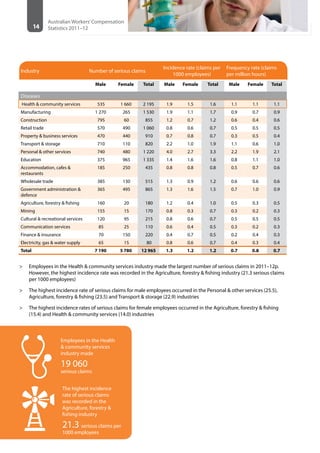
- Agriculture, forestry and fishing had the highest incidence rate of 21.3 claims per 1,000 employees.
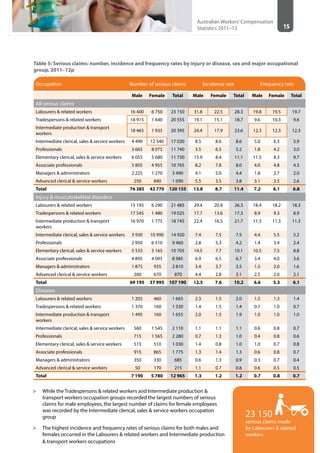
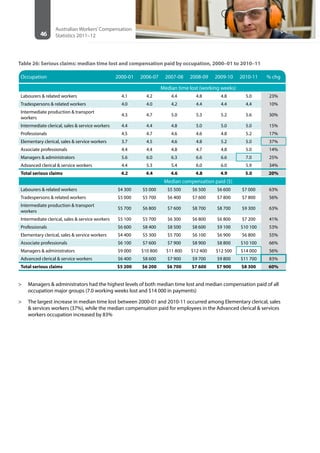
- Labourers and related workers had the highest incidence rate of 28.3 claims per 1,000 employees.
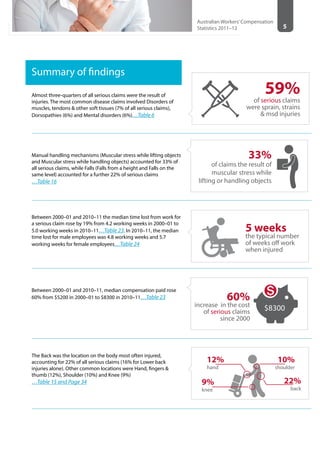
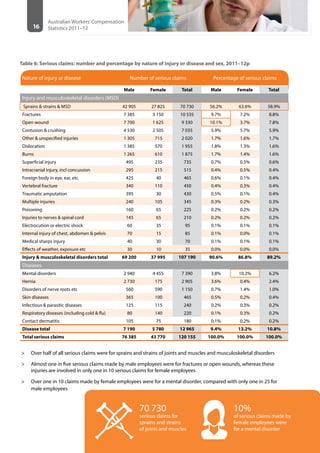
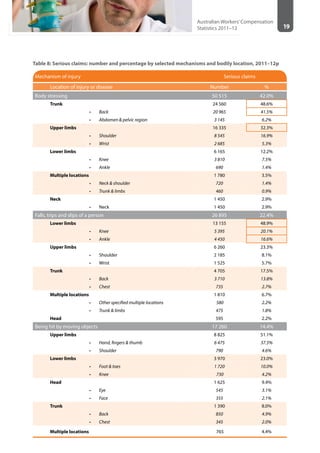
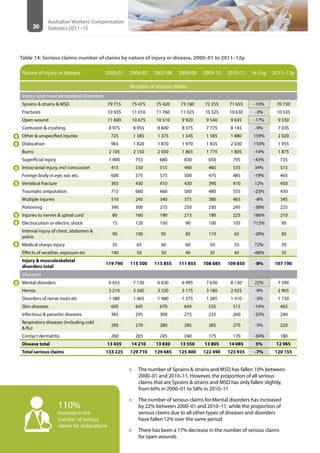
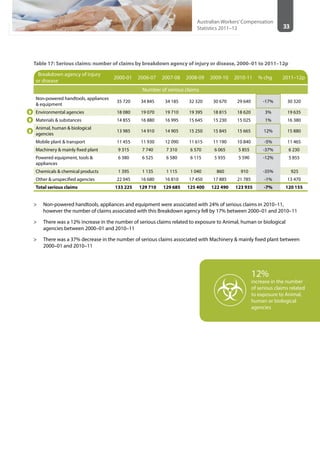
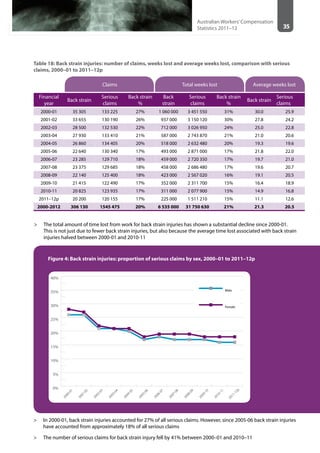
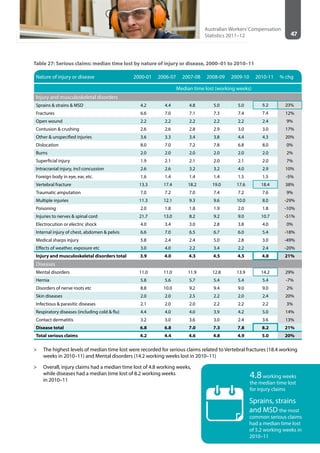
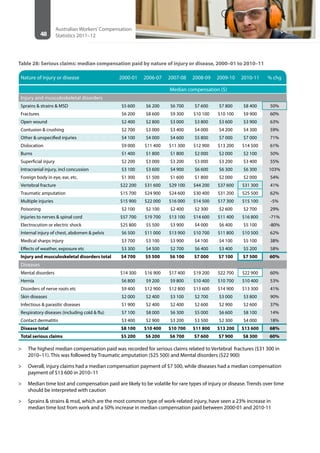
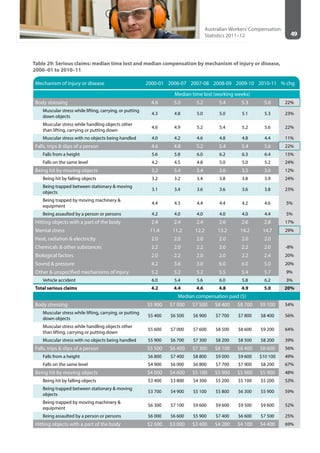
- Back injuries accounted for 22% of all serious claims.
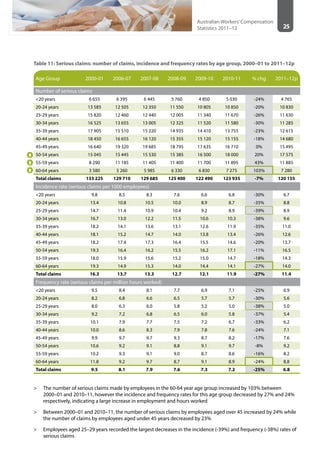
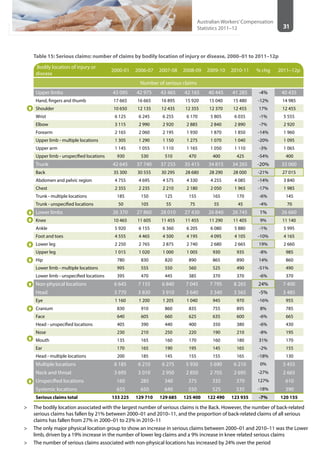
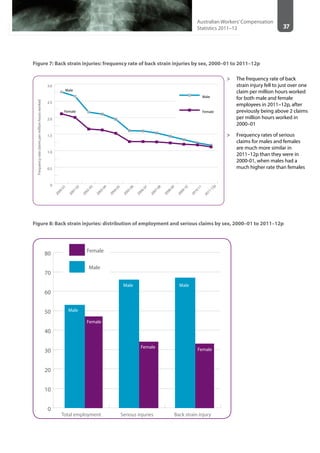
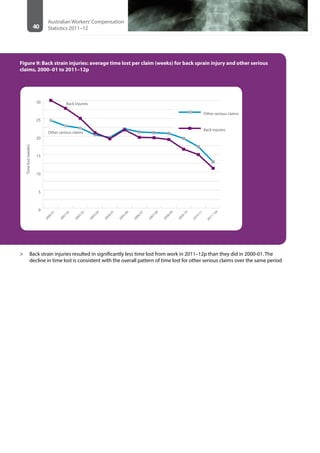
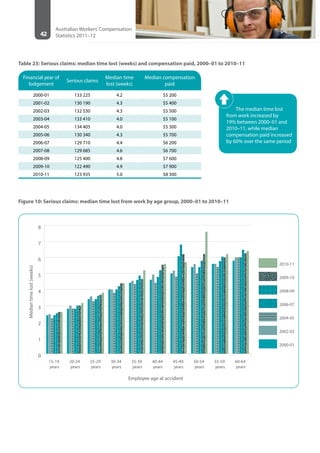
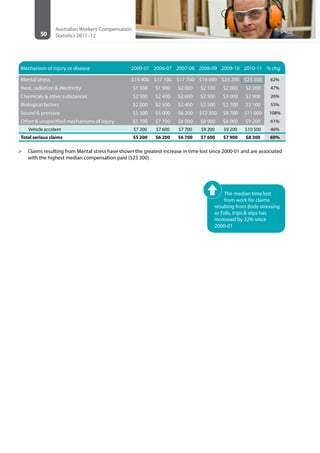
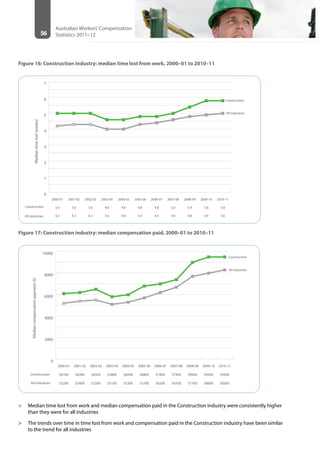
- Between 2000-01 and 2010-11, the median time lost from work increased 19% to 5 weeks