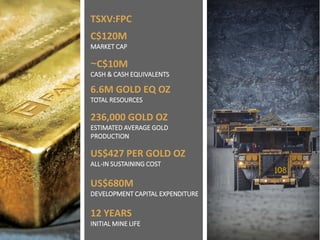
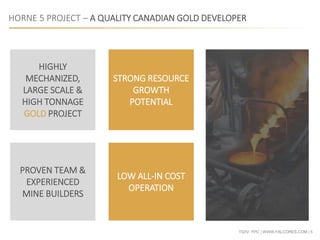
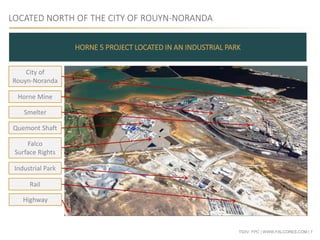
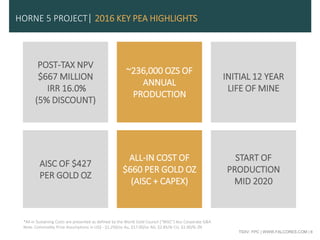
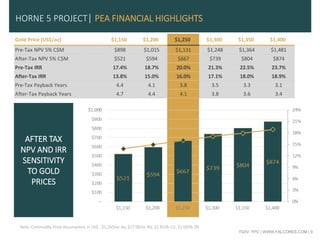
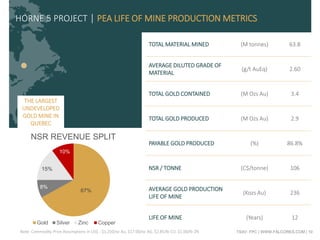
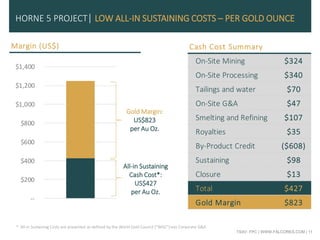
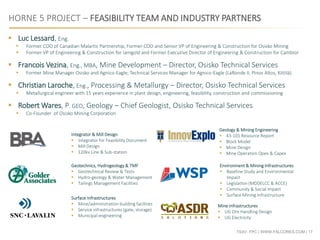
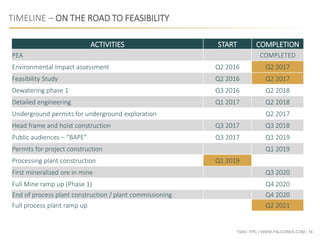
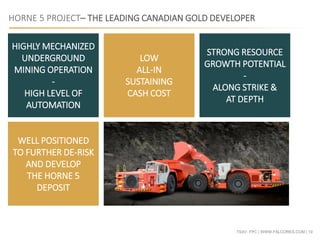
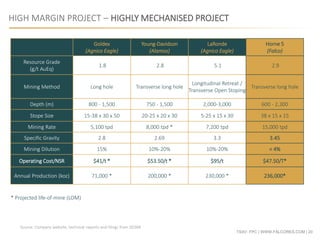
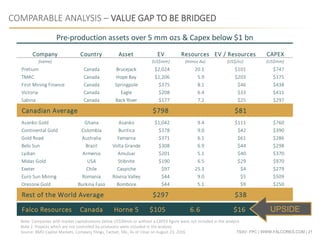
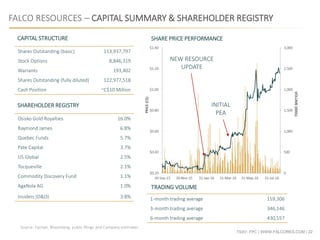
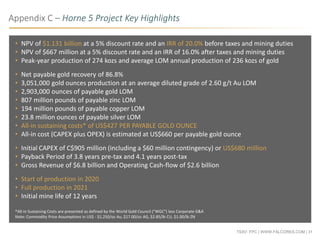
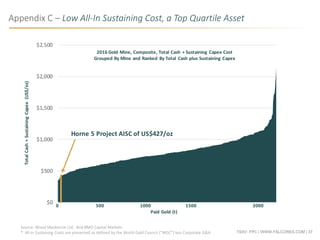
FALCO RESOURCES
THE LEADING
CANADIAN GOLD
DEVELOPER
Corporate Presentation
NEW YORK & MINNEAPOLIS ROADSHOW
AUGUST 2016
WWW.FALCORES.COM | FPC:TSXV
TSXV: FPC | WWW.FALCORES.COM | 2
Disclaimer
This presentation contains a review of the Company’s properties in Canada. Viewers are cautioned that the projects are at an early stage of exploration and that estimates and projections
contained herein are based on limited and incomplete data. More work is required before the mineralization on the projects and their economic aspects can be confidentially modeled.
Therefore, the work results and estimates herein may be considered to be generally indicative only of the nature and quality of the projects. No representation or prediction is intended as to
the results of future work, nor can there be any promise that the estimates herein will be confirmed by future exploration or analysis, or that the projects will otherwise prove to be
economic.
The TSX Venture Exchange has not reviewed and does not accept responsibility for the accuracy or adequacy of this presentation, which has been prepared by management. There can be
no assurance that any of the assumptions in the resource estimates will be supported by a Pre-feasibility or Feasibility Study or that any forward looking event will come to pass. The data is
incomplete and considerable additional work will be required to complete further evaluation, including but not limited to drilling, engineering and socio-economic studies and investment.
This presentation contains information with respect to adjacent or similar mineral properties in respect of which the Company has no interest or rights to explore or mine. Readers are
cautioned that the Company has no interest in or right to acquire any interest in any such properties, and that mineral deposits on adjacent or similar properties are not indicative of mineral
deposits on the Company’s properties. Past performance is no guarantee of future performance and all investors are urged to consult their investment professionals before making an
investment decision. Investors are further cautioned that past performance is no guarantee of future performance
Forward-Looking Statements
Certain information included in this presentation constitutes forward-looking statements, including any information as to our projects, plans and future performance. All statements, other
than statements of historical fact, are forward-looking statements. The words “expect”, “believe”, “anticipate”, “will”, “intend”, “estimate”, “forecast”, “budget”, “schedule” and similar
expressions identify forward-looking statements. Forward-looking statements are necessarily based upon a number of factors and assumptions that, while considered reasonable by
management, are inherently subject to significant business, economic and competitive uncertainties and contingencies. Known and unknown factors could cause actual results to differ
materially from those projected in the forward-looking statements.
Such factors include, but are not limited to: changes to current estimates of mineral reserves and resources; labour availability; litigation; availability of and increased costs associated with
contractors and exploration equipment; the speculative nature of mineral exploration and development, including the risks of obtaining necessary licenses and permits; contests over title to
properties; uncertainty with the Company’s ability to secure capital to execute its business plans; changes in national and local government legislation in Canada; risk of loss due to sabotage
and civil disturbances; risks arising from holding derivative instruments; and business opportunities that may be pursued by the company. Many of these uncertainties and contingencies can
affect our actual results and could cause actual results to differ materially from those expressed or implied in any forward-looking statements made by, or on behalf of, us. Readers are
cautioned that forward-looking statements are not guarantees of future performance.
The company disclaims any intention or obligation to update or revise any forward-looking statements whether as a result of new information, future events or otherwise, except as required
by applicable law.
Cautionary Note to U.S Investors Concerning Measured, Indicated and Inferred Resources
This presentation uses the terms “measured,” “indicated” and “inferred resources. We advise investors that while those terms are recognized and required by Canadian regulations, the
United States Securities and Exchange commission does not recognize them. Under Canadian rules, estimates of inferred mineral resources may not form the basis of feasibility or other
economic studies. United States investors are cautioned not to assume that all or any part of measured or indicated mineral resources will ever be converted into mineral reserves. United
States investors are also cautioned not to assume that all or any part of an inferred mineral resource exists, or is economically or legally mineable.
CAUTIONARY STATEMENT
TSXV: FPC | WWW.FALCORES.COM | 33
TSXV:FPC
C$120M
MARKET CAP
~C$10M
CASH & CASH EQUIVALENTS
6.6M GOLD EQ OZ
TOTAL RESOURCES
236,000 GOLD OZ
ESTIMATED AVERAGE GOLD
PRODUCTION
US$427 PER GOLD OZ
ALL-IN SUSTAINING COST
US$680M
DEVELOPMENT CAPITAL EXPENDITURE
12 YEARS
INITIAL MINE LIFE
TSXV: FPC | WWW.FALCORES.COM | 4
WHY IT WORKED THE FIRST TIME – CANADIAN MALARTIC 2.0
STRONG & EXPERIENCED
TEAM LED BY
SEAN ROOSEN & LUC LESSARD
(PRESIDENT & CEO) (CHIEF OPERATING OFFICER)
GREAT TIMING TO BUILD
ACCESS TO TIER 1
LABOUR & CONTRACTORS
GREAT ASSET
CANADIAN MALARTIC
> 10 M OZS
STRONG & EXPERIENCED
TEAM LED BY
SEAN ROOSEN & LUC LESSARD
(CHAIRMAN) (PRESIDENT & CEO)
GREAT TIMING TO BUILD
ACCESS TO TIER 1
LABOUR & CONTRACTORS
GREAT ASSET
HORNE 5
> 6.6 M OZS & GROWING
THEN… …NOW
~$3 BILLION IN RETURNS
TO SHAREHOLDERS ?
TSXV: FPC | WWW.FALCORES.COM | 5
HORNE 5 PROJECT – A QUALITY CANADIAN GOLD DEVELOPER
STRONG RESOURCE
GROWTH
POTENTIAL
HIGHLY
MECHANIZED,
LARGE SCALE &
HIGH TONNAGE
GOLD PROJECT
LOW ALL-IN COST
OPERATION
PROVEN TEAM &
EXPERIENCED
MINE BUILDERS
TSXV: FPC | WWW.FALCORES.COM | 6
ROUYN-NORANDA – THE BEST PLACE TO BUILD A MINE
TIER 1 LABOUR POOL
TIER 1 SUPPLIERS
TIER 1 POWER
RAIL & HIGHWAY
CLEAR PERMITTING
NO CAMP
NO WAREHOUSE
NO SEASONALITY
• Rouyn-Noranda and the region of Abitibi produce in the most experienced
miners in the world. With underground and open pit experience & capabilities
• Access to tier 1 mining equipment suppliers & mining contractors in the world
• ~80% of required suppliers & contractors located within 1 hour from project
• Access to one of the cheapest and most reliable power source in the world
• Hydro power – clean & renewable
• Rail: Reception of equipment, reagents, but also shipment for concentrates
• Highway access: Regional suppliers, miners, etc.
• Quebec Government: a big supporter of the mining industry
• Clear permitting process & BAPE process for operations over 2,000 tpd
• Proximity to the town of Rouyn-Noranda eliminates the need for a camp
• Access to better & experienced miners; better work-life balance & conditions
• Proximity to the town of Rouyn-Noranda eliminates the need for a warehouse
• Access to suppliers warehouse; reduced size of required working capital
• Weather conditions allow to build and produce all-year round
CANADIAN DOLLAR
• Majority of costs associated with project build in Canadian dollars
• In underground operations >75% of operating costs are in local currency
TSXV: FPC | WWW.FALCORES.COM | 7
LOCATED NORTH OF THE CITY OF ROUYN-NORANDA
HORNE 5 PROJECT LOCATED IN AN INDUSTRIAL PARK
City of
Rouyn-Noranda
Smelter
Horne Mine
Quemont Shaft
Falco
Surface Rights
Industrial Park
Rail
Highway
TSXV: FPC | WWW.FALCORES.COM | 8
HORNE 5 PROJECT| 2016 KEY PEA HIGHLIGHTS
~236,000 OZS OF
ANNUAL
PRODUCTION
POST-TAX NPV
$667 MILLION
IRR 16.0%
(5% DISCOUNT)
ALL-IN COST OF
$660 PER GOLD OZ
(AISC + CAPEX)
AISC OF $427
PER GOLD OZ
INITIAL 12 YEAR
LIFE OF MINE
START OF
PRODUCTION
MID 2020
*All-in Sustaining Costs are presented as defined by the World Gold Council ("WGC") less Corporate G&A
Note: Commodity Price Assumptions in US$ - $1,250/oz Au, $17.00/oz AG, $2.85/lb CU, $1.00/lb ZN
TSXV: FPC | WWW.FALCORES.COM | 9
AFTER TAX
NPV AND IRR
SENSITIVITY
TO GOLD
PRICES
Gold Price (US$/oz) $1,150 $1,200 $1,250 $1,300 $1,350 $1,400
Pre-Tax NPV 5% C$M $898 $1,015 $1,131 $1,248 $1,364 $1,481
After-Tax NPV 5% C$M $521 $594 $667 $739 $804 $874
Pre-Tax IRR 17.4% 18.7% 20.0% 21.3% 22.5% 23.7%
After-Tax IRR 13.8% 15.0% 16.0% 17.1% 18.0% 18.9%
Pre-Tax Payback Years 4.4 4.1 3.8 3.5 3.3 3.1
After-Tax Payback Years 4.7 4.4 4.1 3.8 3.6 3.4
HORNE 5 PROJECT| PEA FINANCIAL HIGHLIGHTS
Note: Commodity Price Assumptions in US$ - $1,250/oz Au, $17.00/oz AG, $2.85/lb CU, $1.00/lb ZN
TSXV: FPC | WWW.FALCORES.COM | 10
TOTAL MATERIAL MINED (M tonnes) 63.8
AVERAGE DILUTED GRADE OF
MATERIAL
(g/t AuEq) 2.60
TOTAL GOLD CONTAINED (M Ozs Au) 3.4
TOTAL GOLD PRODUCED (M Ozs Au) 2.9
PAYABLE GOLD PRODUCED (%) 86.8%
NSR / TONNE (C$/tonne) 106
AVERAGE GOLD PRODUCTION
LIFE OF MINE
(Kozs Au) 236
LIFE OF MINE (Years) 12
HORNE 5 PROJECT | PEA LIFE OF MINE PRODUCTION METRICS
THE LARGEST
UNDEVELOPED
GOLD MINE IN
QUEBEC
67%
8%
15%
10%
NSR REVENUE SPLIT
Gold Silver Zinc Copper
Note: Commodity Price Assumptions in US$ - $1,250/oz Au, $17.00/oz AG, $2.85/lb CU, $1.00/lb ZN
TSXV: FPC | WWW.FALCORES.COM | 11
Margin (US$)
--
$200
$400
$600
$800
$1,000
$1,200
$1,400
HORNE 5 PROJECT| LOW ALL-IN SUSTAINING COSTS – PER GOLD OUNCE
Cash Cost Summary
On-Site Mining $324
On-Site Processing $340
Tailings and water $70
On-Site G&A $47
Smelting and Refining $107
Royalties $35
By-Product Credit ($608)
Sustaining $98
Closure $13
Total $427
Gold Margin $823
Gold Margin:
US$823
per Au Oz.
All-in Sustaining
Cash Cost*:
US$427
per Au Oz.
* All-in Sustaining Costs are presented as defined by the World Gold Council ("WGC") less Corporate G&A
TSXV: FPC | WWW.FALCORES.COM | 12
HORNE 5 PROJECT| PRE-PRODUCTION CAPITAL COST C$905M / US$680M
C$247
C$352
C$21
C$98
C$19
C$109
C$60
Mining
Processing Plant
Electrical and Communication
Site Infrastructure
Tailings and Water Management
Indirects
Contingency
TOTAL
PRE-PRODUCTION
CAPITAL COSTS
C$905M
US$680M
TSXV: FPC | WWW.FALCORES.COM | 13
HORNE 5 PROJECT| SITE LAYOUT
TSXV: FPC | WWW.FALCORES.COM | 14
HORNE 5 PROJECT| MINING APPROACH – 3 PHASE APPROACH
ANTICIPATED
INITIAL
APPROACH
FLEXIBILITY
TO FURTHER
DEEPEN
SHAFT
TSXV: FPC | WWW.FALCORES.COM | 15
HORNE 5 PROJECT| TARGETS TO INCREASE TONNAGE – STRONG GROWTH
STRONG POTENTIAL TO INCREASE MINERAL RESOURCES ON THE HORNE 5 DEPOSIT
?
?
TSXV: FPC | WWW.FALCORES.COM | 16
HORNE 5 PROJECT| NEAR SURFACE TARGETS – QUEMONT TARGET AREA
QUEMONT
PRODUCTION
SHAFT
?
WESTERN
PLUNGE
TSXV: FPC | WWW.FALCORES.COM | 17
HORNE 5 PROJECT – FEASIBILITY TEAM AND INDUSTRY PARTNERS
Integrator & Mill Design
 Integrator for Feasibility Document
 Mill Design
 120kv Line & Sub-station
Geology & Mining Engineering
 43-101 Resource Report
 Block Model
 Mine Design
 Mine Operation Opex & Capex
Geotechnics, Hydrogeology & TMF
 Geotechnical Review & Tests
 Hydro-geology & Water Management
 Tailings Management Facilities
Environment & Mining Infrastructures
 Baseline Study and Environmental
Impact
 Legislation (MDDELCC & ACCE)
 Community & Social Impact
 Surface Mining Infrastructure
 Luc Lessard, Eng.
 Former COO of Canadian Malartic Partnership, Former COO and Senior VP of Engineering & Construction for Osisko Mining
 Former VP of Engineering & Construction for Iamgold and Former Executive Director of Engineering & Construction for Cambior
 Francois Vezina, Eng., MBA, Mine Development – Director, Osisko Technical Services
 Former Mine Manager Osisko and Agnico-Eagle; Technical Services Manager for Agnico-Eagle (LaRonde II, Pinos Altos, Kittilä)
 Christian Laroche, Eng., Processing & Metallurgy – Director, Osisko Technical Services
 Metallurgical engineer with 15 years experience in plant design, engineering, feasibility, construction and commissioning
 Robert Wares, P. GEO, Geology – Chief Geologist, Osisko Technical Services
 Co-Founder of Osisko Mining Corporation
Mine Infrastructures
 UG Ore Handling Design
 UG Electricity
Surface Infrastructures
 Mine/administration building facilities
 Service infrastructures (gate, storage)
 Municipal engineering
TSXV: FPC | WWW.FALCORES.COM | 18
TIMELINE – ON THE ROAD TO FEASIBILITY
ACTIVITIES START COMPLETION
PEA COMPLETED
Environmental Impact assessment Q2 2016 Q2 2017
Feasibility Study Q2 2016 Q2 2017
Dewatering phase 1 Q3 2016 Q2 2018
Detailed engineering Q1 2017 Q2 2018
Underground permits for underground exploration Q2 2017
Head frame and hoist construction Q3 2017 Q3 2018
Public audiences – “BAPE” Q3 2017 Q1 2019
Permits for project construction Q1 2019
Processing plant construction Q1 2019
First mineralized ore in mine Q3 2020
Full Mine ramp up (Phase 1) Q4 2020
End of process plant construction / plant commissioning Q4 2020
Full process plant ramp up Q2 2021
TSXV: FPC | WWW.FALCORES.COM | 19
HIGHLY MECHANIZED
UNDERGROUND
MINING OPERATION
-
HIGH LEVEL OF
AUTOMATION
LOW
ALL-IN
SUSTAINING
CASH COST
STRONG RESOURCE
GROWTH POTENTIAL
-
ALONG STRIKE &
AT DEPTH
WELL POSITIONED
TO FURTHER DE-RISK
AND DEVELOP
THE HORNE 5
DEPOSIT
HORNE 5 PROJECT– THE LEADING CANADIAN GOLD DEVELOPER
TSXV: FPC | WWW.FALCORES.COM | 20
HIGH MARGIN PROJECT – HIGHLY MECHANISED PROJECT
Goldex
(Agnico Eagle)
Young-Davidson
(Alamos)
LaRonde
(Agnico Eagle)
Horne 5
(Falco)
Resource Grade
(g/t AuEq)
1.8 2.8 5.1 2.9
Mining Method Long hole Transverse long hole
Longitudinal Retreat /
Transverse Open Stoping
Transverse long hole
Depth (m) 800 - 1,500 750 - 1,500 2,000-3,000 600 - 2,300
Stope Size 15-38 x 30 x 50 20-25 x 20 x 30 5-25 x 15 x 30 38 x 15 x 15
Mining Rate 5,100 tpd 8,000 tpd * 7,200 tpd 15,000 tpd
Specific Gravity 2.8 2.69 3.3 3.45
Mining Dilution 15% 10%-20% 10%-20% < 4%
Operating Cost/NSR $41/t * $53.50/t * $95/t $47.50/T*
Annual Production (koz) 71,000 * 200,000 * 230,000 * 236,000*
* Projected life-of-mine (LOM)
Source: Company website, technical reports and filings from SEDAR
TSXV: FPC | WWW.FALCORES.COM | 21
Pre-production assets over 5 mm ozs & Capex below $1 bn
Company Country Asset EV Resources EV / Resources CAPEX
(name) (US$mm) (mmoz Au) (US$/oz) (US$mm)
Pretium Canada Brucejack $2,024 20.1 $101 $747
TMAC Canada Hope Bay $1,206 5.9 $203 $175
First Mining Finance Canada Springpole $375 8.1 $46 $438
Victoria Canada Eagle $208 6.4 $33 $411
Sabina Canada Back River $177 7.2 $25 $297
Canadian Average $798 $81
Asanko Gold Ghana Asanko $1,042 9.4 $111 $760
Continental Gold Colombia Buritica $378 9.0 $42 $390
Gold Road Australia Yamarna $371 6.1 $61 $286
Belo Sun Brazil Volta Grande $308 6.9 $44 $298
Lydian Armenia Amulsar $201 5.1 $40 $370
Midas Gold USA Stibnite $190 6.5 $29 $970
Exeter Chile Caspiche $97 25.3 $4 $279
Euro Sun Mining Romania Rovina Valley $44 9.0 $5 $509
Orezone Gold Burkina Faso Bombore $44 5.1 $9 $250
Rest of the World Average $297 $38
Falco Resources Canada Horne 5 $105 6.6 $16
COMPARABLE ANALYSIS – VALUE GAP TO BE BRIDGED
Note: Companies with market capitalizations below US$30mm or without a CAPEX figure were not included in the analysis
Note 2: Projects which are not controlled by producers were included in the analysis
Source: BMO Capital Markets, Company filings, Factset, SNL, As of Close on August 23, 2016
UPSIDE
TSXV: FPC | WWW.FALCORES.COM | 22
FALCO RESOURCES – CAPITAL SUMMARY & SHAREHOLDER REGISTRY
CAPITAL STRUCTURE
SHAREHOLDER REGISTRY
Osisko Gold Royalties 16.0%
Raymond James 6.8%
Quebec Funds 5.7%
Pate Capital 3.7%
US Global 2.5%
Tocqueville 2.1%
Commodity Discovery Fund 1.1%
AgaNola AG 1.0%
Insiders (D&O) 3.8%
Shares Outstanding (basic) 113,937,797
Stock Options 8,846,319
Warrants 193,402
Shares Outstanding (fully diluted) 122,977,518
Cash Position ~C$10 Million
SHARE PRICE PERFORMANCE
INITIAL
PEA
NEW RESOURCE
UPDATE
1-month trading average 159,306
3-month trading average 346,146
6-month trading average 430,557
TRADING VOLUME
Source: Factset, Bloomberg, public filings and Company estimates
TSXV: FPC | WWW.FALCORES.COM | 23
FALCO RESOURCES – SENIOR LEADERSHIP TEAM
OFFICERS & TECHNICAL TEAM BOARD OF DIRECTORS
Sean Roosen, Chairman
Mario Caron, Lead Director
Luc Lessard, President & CEO, Director
Helene Cartier, Director
Jim Davidson, Director
Claude Ferron, Director
Paul Henri-Girard, Director
Luc Lessard, President & CEO, Director
Vincent Metcalfe, CFO
Claude Léveillée, Vice-President Community
Relations & HR
Claude Bernier, Exploration Manager
Sylvain Doire, Environment
Claude Pilote, Senior Geologist
TECHNICAL TEAM – OSISKO TECHNICAL SERVICES
Robert Wares, Chief geologist
Francois Vezina, Director – Mining
Christian Laroche, Director – Processing
Daniel Mathieu – Mechanical Designer
Iain Farmer – Project Engineer
TSXV: FPC | WWW.FALCORES.COM | 24
Head Office
Falco Resources Ltd.
1100, avenue des
Canadiens-de-Montréal
Bureau 300
Montréal, QC H3B 2S2
Tél. : +1.514.905.3162
Toll Free : +1.888.915.2009
Courriel : info@falcores.com
Investor Inquiries
Vincent Metcalfe, CFO
Tel: +1.514.905.3162
Email: vmetcalfe@falcores.com
CONTACT US
TSXV: FPC | WWW.FALCORES.COM | 25
APPENDIX
Appendix A – Glencore Back-In Agreement
Appendix B – Reserves & Resources
Appendix C – PEA Additional Information
Appendix D – Resource & Modeling Notes
TSXV: FPC | WWW.FALCORES.COM | 26
Appendix A – Glencore Back-In Agreement
 Glencore will retain its back-in right to acquire a 65% interest on any base metal
deposit containing more than 350,000 tonnes copper metal equivalent after
presentation of a NI 43-101 compliant resource, under the following conditions:
 paying Falco three times the project-specific exploration and development
expenditures;
 paying Falco three times the Rouyn regional base metal exploration
expenditures up to a maximum of $20 million;
 Paying 65% of the development Expenditures
 Glencore must complete a compliant feasibility study, within a specified period
and at no cost to Falco;
 Falco will retain a 35% interest; receive a 6-month financing period subsequent to a
production decision; and will participate in a JV management committee where
unanimous agreement is required on critical mining decision
 The back-in right does not apply to any gold deposit, defined as a deposit where
the value of gold and silver are three times greater than the value of base metals,
using 6-month average metal prices at closing as defined at the date of the
agreement. As such, gold deposits are solely to the Falco account.
 Glencore retains a 1-2% NSR on all metals on mineral claims transferred to Falco.
Where historic royalties exist, the combined royalty is capped at 3 to 4%. In areas
with no prior royalties, the NSR is capped at 2%.
 Glencore has the right to explore for and exploit smelter materials (e.g. flux) in all
areas. Should smelter materials be mined from the Falco properties, Falco will
receive a royalty of $0.50 per tonne plus 50% of any gold which may be recovered
 Glencore retains their rights of first refusal for custom milling and smelting of base
metal production
Terms of the Agreement
TSXV: FPC | WWW.FALCORES.COM | 27
Appendix B – 2016 Reserves and Resources of Horne 5 Deposit
Resource
Class
Cut-off
(NSR $C)
Tonnes
(Mt)
AuEq
(g/t)
Au
(g/t)
Ag
(g/t)
Cu
(%)
ZN
(%)
Contained
AuEq (Moz)
Contained
Au (Moz)
Contained
Ag (Moz)
Contained
Cu (Mlbs)
Contained
Zn (Mlbs)
> 50 82.2 2.53 1.59 14.49 0.18 0.90 6.694 4.212 38.293 328.1 1,638.4
> 55 74.1 2.64 1.66 14.87 0.19 0.94 6.273 3.959 35.397 306.2 1,531.8
> 60 66.0 2.74 1.74 15.26 0.19 0.97 5.823 3.691 32.378 283.1 1,412.1
> 65 58.3 2.86 1.82 15.60 0.20 1.00 5.361 3.418 29.273 260.4 1,284.8
> 70 51.1 2.98 1.91 15.93 0.21 1.02 4.893 3.142 26.163 237.7 1,152.6
Indicated > 75 44.2 3.11 2.01 16.20 0.22 1.04 4.421 2.865 23.048 215.2 1,017.0
> 80 38.0 3.25 2.12 16.46 0.23 1.06 3.962 2.592 20.086 193.4 886.7
> 85 32.3 3.39 2.25 16.69 0.24 1.07 3.525 2.332 17.331 173.0 761.7
> 90 27.5 3.54 2.37 16.88 0.25 1.08 3.129 2.095 14.902 154.0 652.4
> 95 23.3 3.70 2.50 17.04 0.27 1.09 2.775 1.878 12.780 136.8 558.6
> 100 19.7 3.86 2.64 17.25 0.28 1.09 2.452 1.679 10.948 121.1 474.3
> 50 19.2 2.62 1.72 22.47 0.21 0.56 1.616 1.060 13.841 86.6 237.2
> 55 16.6 2.78 1.85 23.78 0.21 0.57 1.483 0.985 12.692 76.6 208.6
> 60 14.5 2.92 1.97 24.99 0.21 0.57 1.367 0.920 11.688 68.6 183.0
> 65 12.7 3.08 2.10 26.26 0.22 0.57 1.254 0.855 10.705 61.7 158.1
> 70 10.9 3.25 2.25 27.60 0.23 0.55 1.139 0.788 9.670 54.7 133.1
Inferred > 75 9.1 3.47 2.46 28.48 0.24 0.53 1.013 0.716 8.307 47.5 106.1
> 80 7.6 3.71 2.69 28.92 0.25 0.50 0.904 0.655 7.055 41.5 83.4
> 85 6.4 3.94 2.91 29.77 0.26 0.47 0.814 0.601 6.146 36.4 67.1
> 90 5.4 4.21 3.15 30.82 0.27 0.46 0.733 0.549 5.372 32.0 54.9
> 95 4.8 4.42 3.35 31.48 0.27 0.45 0.678 0.514 4.835 28.9 47.4
> 100 4.3 4.60 3.51 32.28 0.28 0.45 0.636 0.485 4.460 26.6 42.6
Exchange Rate: CAD/USD = 1.27 , see resource notes in appendix D
TSXV: FPC | WWW.FALCORES.COM | 28
Appendix B – Longitudinal & Cross Section of Horne 5 Deposit
ENV_B
ENV_C
ENV_D
DEPOSIT
HIGH GRADE ZONES
5.48 g/t AuEq
3.79 g/t AuEq
TSXV: FPC | WWW.FALCORES.COM | 29
Appendix B – Historical Drill Density of Horne 5 Deposit
600m
HORNEQUEMONT  Exceptional Drill
Density
 4,384 underground
drill holes at 15
spacing (305,788m)
drilled by Noranda
 Very high confidence
in historical drilling
 Great upside at
Depth – limited
drilling vs. upper area
TSXV: FPC | WWW.FALCORES.COM | 30
Appendix B – Horne 5 Deposit & 2015 Confirmation Drilling Program
HORNEQUEMONT
TSXV: FPC | WWW.FALCORES.COM | 31
• NPV of $1.131 billion at a 5% discount rate and an IRR of 20.0% before taxes and mining duties
• NPV of $667 million at a 5% discount rate and an IRR of 16.0% after taxes and mining duties
• Peak-year production of 274 kozs and average LOM annual production of 236 kozs of gold
• Net payable gold recovery of 86.8%
• 3,051,000 gold ounces production at an average diluted grade of 2.60 g/t Au LOM
• 2,903,000 ounces of payable gold LOM
• 807 million pounds of payable zinc LOM
• 194 million pounds of payable copper LOM
• 23.8 million ounces of payable silver LOM
• All-in sustaining costs* of US$427 PER PAYABLE GOLD OUNCE
• All-in cost (CAPEX plus OPEX) is estimated at US$660 per payable gold ounce
• Initial CAPEX of C$905 million (including a $60 million contingency) or US$680 million
• Payback Period of 3.8 years pre-tax and 4.1 years post-tax
• Gross Revenue of $6.8 billion and Operating Cash-flow of $2.6 billion
• Start of production in 2020
• Full production in 2021
• Initial mine life of 12 years
*All-in Sustaining Costs are presented as defined by the World Gold Council ("WGC") less Corporate G&A
Note: Commodity Price Assumptions in US$ - $1,250/oz Au, $17.00/oz AG, $2.85/lb CU, $1.00/lb ZN
Appendix C – Horne 5 Project Key Highlights
TSXV: FPC | WWW.FALCORES.COM | 32
Appendix C – Proposed Flowsheet of Horne 5 Project
TSXV: FPC | WWW.FALCORES.COM | 33
Appendix C – High Level of Automation for Horne 5 Project
Surface control underground operations:
• Hoist – production and services
• Teleoperation of loaders
• Monitoring and management of ventilation
requirements
• Monitoring of the paste backfill distribution
• Water pumping monitoring
• Staff & equipment location monitoring
TSXV: FPC | WWW.FALCORES.COM | 34
Appendix C – Ramp-Up Example for Horne 5 Project
• 23,500 tonne stopes (38x15x15)
• 20 effective hrs/day
• 58-day stope cycle time
• 4 mucking faces
• 6-7 days mucking per stope
TSXV: FPC | WWW.FALCORES.COM | 35
Appendix C – Example Sequence for a Single Pyramid – 1st level
TSXV: FPC | WWW.FALCORES.COM | 36
Appendix C – Example of Active Pyramids during Ramp-up
• 4 pyramids will be
active (mucking) at any
given time
• Full production (15,000
tpd) expected to be
reached in as quickly as
4.5 months
TSXV: FPC | WWW.FALCORES.COM | 37
Source: Wood Mackenzie Ltd. And BMO Capital Markets
* All-in Sustaining Costs are presented as defined by the World Gold Council ("WGC") less Corporate G&A
$0
$500
$1,000
$1,500
$2,000
$2,500
2016 Gold Mine, Composite, Total Cash + Sustaining Capex Cost
Grouped By Mine and Ranked By Total Cash plus Sustaining Capex
TotalCash+SustainingCapex(US$/oz)
0 500 1000 1500 2000
Paid Gold (t)
Horne 5 Project AISC of US$427/oz
Appendix C – Low All-In Sustaining Cost, a Top Quartile Asset
TSXV: FPC | WWW.FALCORES.COM | 38
Appendix D – Mineral Resource Estimates & Modeling Notes
1. The effective date of the resource estimate is January 8, 2016. The Independent and Qualified Persons for the Mineral Resource Estimate as required by National Instrument 43-101 are
Carl Pelletier, B.Sc., P.Geo. and Vincent Jourdain, P.Eng., Ph.D., both employees of InnovExplo Inc.
2. Mineral Resources are not Mineral Reserves and have not demonstrated economic viability.
3. While the results are presented undiluted and in situ, the reported mineral resources are considered by the Qualified Persons to have reasonable prospects for economic extraction.
4. These estimates include four (4) low grade gold-bearing mineralized zones.
5. The principal low-grade gold-bearing mineralized zone includes five (5) high-grade gold-bearing zones, one (1) high-grade copper-bearing zone, one (1) high-grade zinc-bearing zone and two (2)
high-grade silver-bearing zones.
6. Resources were compiled at NSR cut-offs of C$50, C$55, C$60, C$65, C$70, C$75, C$80, C$85, C$90, C$95 and C$100 per tonne. The official base case resource is reported at a C$65 per
tonne NSR cut-off.
7. The appropriate NSR cut-off will vary depending on prevailing economic and operational parameters to be determined.
8. NSR estimates are based on the following assumptions: exchange rate of $C1.27/$US, metal prices of (all $US): gold $1,165/oz, silver $15.77, copper $2.53/lb, zinc $0.89/lb (One-year
trailing average as of December 14, 2015). Net recoveries of 84.0% for gold, 75.3% for silver, 71.8% for zinc and 66.5% for copper. Smelting cost (including transportation) C$7.73 per tonne.
9. Gold equivalent calculations assume these same metal prices.
10. Inferred resources are separate from Indicated Resources
11. The quantity and grade of reported Inferred Resources in this estimate are uncertain in nature and there has not been sufficient work to define these Inferred Resources as Indicated or
Measured Resources. It is uncertain if further work will result in upgrading them to an Indicated or Measured mineral resource category.
12. Densities within ENV_A were estimated from Noranda drill hole iron assay data and Falco density data using a 3-pass ID2 interpolation method. Limited density data was available for zones
ENV_B to D and a fixed density of 2.88 t/m3 was assumed for these zones which represent the median of the available data.
13. Compositing was done on drill hole sections falling within the mineralized zones (composite = 3.0 metres).
14. The resource was estimated using Geovia GEMS 6.7. The estimate is based on 4,411 diamond drill holes (323,087 m). For silver the estimates also uses the results of an exhaustive metallurgical
test comprising 2,112 diamond drill holes assayed for silver over a total length of 75,540 meters. A minimum true thickness of 7.0 m was applied, using the grade of the adjacent material when
assayed, or a value of zero when not assayed.
15. Only the silver interpolation in the Inferred resources does not use the material when not assayed.
16. The estimate was based on a three dimensional block model (5x5x5 metre blocks). Within ENV_A. Wireframes of high grade zones were used as hard boundaries to constrain the interpolation of
gold, silver, copper, zinc and density into the block model. Interpolation parameters were derived based on geostatistical analysis conducted on 3 metre composited drill hole data. Block grades
have been estimated using Inverse Distance Squared (ID2) interpolation method and the mineral resources have been classified based on proximity to sample data and the continuity of
mineralization in accordance with CIM best practices.
17. Capping of high grade gold values was done on raw assay data and established on a per zone basis: HG_A: 35 g/t, HG_B: 35g/t, HG_C: 25g/t, HG_D: 35g/t, HG_E: 25g/t, ENV_A: 35g/t, ENV_B:
25g/t, ENV_C: 25g/t, ENV_D: 25g/t and for high grade silver SG_HG:100g/t, HG_D: 165 g/t, ENV_A_SG_Low: 110 g/t, ENV_B: 100 g/t, ENV_C: 100 g/t, ENV_D: 100 g/t. No upper capping was
applied to copper and zinc data.
18. Tonnage estimates were rounded to the nearest hundred tonnes. Any discrepancies in the totals are due to rounding effects. Rounding practice follows the recommendations set out in Form 43-
101F1.
19. CIM definitions and guidelines were followed in estimating mineral resources.
20. InnovExplo is not aware of any known environmental, permitting, legal, title-related, taxation, socio-political, marketing or other relevant issue that could materially affect the mineral resource
estimate.
21. The mineral resources presented herein are categorized as Indicated and Inferred based on geological and grade continuity. A maximum distance to the closest composite of 25 meters was used
for indicated Resources. The average distance to the nearest composite is 8.3 meters for the Indicated resources and 35.2 meters for the Inferred resources.
22. Metal contained in ounces (troy) = metric tonnes x grade / 31.10348. Calculations used metric units (metres, tonnes and g/t). Metal contents are presented in ounces and pounds.
RESOURCE ESTIMATE NOTES
RESOURCE MODELING NOTES

August Investor presentation

  • 1.
    FALCO RESOURCES THE LEADING CANADIANGOLD DEVELOPER Corporate Presentation NEW YORK & MINNEAPOLIS ROADSHOW AUGUST 2016 WWW.FALCORES.COM | FPC:TSXV
  • 2.
    TSXV: FPC |WWW.FALCORES.COM | 2 Disclaimer This presentation contains a review of the Company’s properties in Canada. Viewers are cautioned that the projects are at an early stage of exploration and that estimates and projections contained herein are based on limited and incomplete data. More work is required before the mineralization on the projects and their economic aspects can be confidentially modeled. Therefore, the work results and estimates herein may be considered to be generally indicative only of the nature and quality of the projects. No representation or prediction is intended as to the results of future work, nor can there be any promise that the estimates herein will be confirmed by future exploration or analysis, or that the projects will otherwise prove to be economic. The TSX Venture Exchange has not reviewed and does not accept responsibility for the accuracy or adequacy of this presentation, which has been prepared by management. There can be no assurance that any of the assumptions in the resource estimates will be supported by a Pre-feasibility or Feasibility Study or that any forward looking event will come to pass. The data is incomplete and considerable additional work will be required to complete further evaluation, including but not limited to drilling, engineering and socio-economic studies and investment. This presentation contains information with respect to adjacent or similar mineral properties in respect of which the Company has no interest or rights to explore or mine. Readers are cautioned that the Company has no interest in or right to acquire any interest in any such properties, and that mineral deposits on adjacent or similar properties are not indicative of mineral deposits on the Company’s properties. Past performance is no guarantee of future performance and all investors are urged to consult their investment professionals before making an investment decision. Investors are further cautioned that past performance is no guarantee of future performance Forward-Looking Statements Certain information included in this presentation constitutes forward-looking statements, including any information as to our projects, plans and future performance. All statements, other than statements of historical fact, are forward-looking statements. The words “expect”, “believe”, “anticipate”, “will”, “intend”, “estimate”, “forecast”, “budget”, “schedule” and similar expressions identify forward-looking statements. Forward-looking statements are necessarily based upon a number of factors and assumptions that, while considered reasonable by management, are inherently subject to significant business, economic and competitive uncertainties and contingencies. Known and unknown factors could cause actual results to differ materially from those projected in the forward-looking statements. Such factors include, but are not limited to: changes to current estimates of mineral reserves and resources; labour availability; litigation; availability of and increased costs associated with contractors and exploration equipment; the speculative nature of mineral exploration and development, including the risks of obtaining necessary licenses and permits; contests over title to properties; uncertainty with the Company’s ability to secure capital to execute its business plans; changes in national and local government legislation in Canada; risk of loss due to sabotage and civil disturbances; risks arising from holding derivative instruments; and business opportunities that may be pursued by the company. Many of these uncertainties and contingencies can affect our actual results and could cause actual results to differ materially from those expressed or implied in any forward-looking statements made by, or on behalf of, us. Readers are cautioned that forward-looking statements are not guarantees of future performance. The company disclaims any intention or obligation to update or revise any forward-looking statements whether as a result of new information, future events or otherwise, except as required by applicable law. Cautionary Note to U.S Investors Concerning Measured, Indicated and Inferred Resources This presentation uses the terms “measured,” “indicated” and “inferred resources. We advise investors that while those terms are recognized and required by Canadian regulations, the United States Securities and Exchange commission does not recognize them. Under Canadian rules, estimates of inferred mineral resources may not form the basis of feasibility or other economic studies. United States investors are cautioned not to assume that all or any part of measured or indicated mineral resources will ever be converted into mineral reserves. United States investors are also cautioned not to assume that all or any part of an inferred mineral resource exists, or is economically or legally mineable. CAUTIONARY STATEMENT
  • 3.
    TSXV: FPC |WWW.FALCORES.COM | 33 TSXV:FPC C$120M MARKET CAP ~C$10M CASH & CASH EQUIVALENTS 6.6M GOLD EQ OZ TOTAL RESOURCES 236,000 GOLD OZ ESTIMATED AVERAGE GOLD PRODUCTION US$427 PER GOLD OZ ALL-IN SUSTAINING COST US$680M DEVELOPMENT CAPITAL EXPENDITURE 12 YEARS INITIAL MINE LIFE
  • 4.
    TSXV: FPC |WWW.FALCORES.COM | 4 WHY IT WORKED THE FIRST TIME – CANADIAN MALARTIC 2.0 STRONG & EXPERIENCED TEAM LED BY SEAN ROOSEN & LUC LESSARD (PRESIDENT & CEO) (CHIEF OPERATING OFFICER) GREAT TIMING TO BUILD ACCESS TO TIER 1 LABOUR & CONTRACTORS GREAT ASSET CANADIAN MALARTIC > 10 M OZS STRONG & EXPERIENCED TEAM LED BY SEAN ROOSEN & LUC LESSARD (CHAIRMAN) (PRESIDENT & CEO) GREAT TIMING TO BUILD ACCESS TO TIER 1 LABOUR & CONTRACTORS GREAT ASSET HORNE 5 > 6.6 M OZS & GROWING THEN… …NOW ~$3 BILLION IN RETURNS TO SHAREHOLDERS ?
  • 5.
    TSXV: FPC |WWW.FALCORES.COM | 5 HORNE 5 PROJECT – A QUALITY CANADIAN GOLD DEVELOPER STRONG RESOURCE GROWTH POTENTIAL HIGHLY MECHANIZED, LARGE SCALE & HIGH TONNAGE GOLD PROJECT LOW ALL-IN COST OPERATION PROVEN TEAM & EXPERIENCED MINE BUILDERS
  • 6.
    TSXV: FPC |WWW.FALCORES.COM | 6 ROUYN-NORANDA – THE BEST PLACE TO BUILD A MINE TIER 1 LABOUR POOL TIER 1 SUPPLIERS TIER 1 POWER RAIL & HIGHWAY CLEAR PERMITTING NO CAMP NO WAREHOUSE NO SEASONALITY • Rouyn-Noranda and the region of Abitibi produce in the most experienced miners in the world. With underground and open pit experience & capabilities • Access to tier 1 mining equipment suppliers & mining contractors in the world • ~80% of required suppliers & contractors located within 1 hour from project • Access to one of the cheapest and most reliable power source in the world • Hydro power – clean & renewable • Rail: Reception of equipment, reagents, but also shipment for concentrates • Highway access: Regional suppliers, miners, etc. • Quebec Government: a big supporter of the mining industry • Clear permitting process & BAPE process for operations over 2,000 tpd • Proximity to the town of Rouyn-Noranda eliminates the need for a camp • Access to better & experienced miners; better work-life balance & conditions • Proximity to the town of Rouyn-Noranda eliminates the need for a warehouse • Access to suppliers warehouse; reduced size of required working capital • Weather conditions allow to build and produce all-year round CANADIAN DOLLAR • Majority of costs associated with project build in Canadian dollars • In underground operations >75% of operating costs are in local currency
  • 7.
    TSXV: FPC |WWW.FALCORES.COM | 7 LOCATED NORTH OF THE CITY OF ROUYN-NORANDA HORNE 5 PROJECT LOCATED IN AN INDUSTRIAL PARK City of Rouyn-Noranda Smelter Horne Mine Quemont Shaft Falco Surface Rights Industrial Park Rail Highway
  • 8.
    TSXV: FPC |WWW.FALCORES.COM | 8 HORNE 5 PROJECT| 2016 KEY PEA HIGHLIGHTS ~236,000 OZS OF ANNUAL PRODUCTION POST-TAX NPV $667 MILLION IRR 16.0% (5% DISCOUNT) ALL-IN COST OF $660 PER GOLD OZ (AISC + CAPEX) AISC OF $427 PER GOLD OZ INITIAL 12 YEAR LIFE OF MINE START OF PRODUCTION MID 2020 *All-in Sustaining Costs are presented as defined by the World Gold Council ("WGC") less Corporate G&A Note: Commodity Price Assumptions in US$ - $1,250/oz Au, $17.00/oz AG, $2.85/lb CU, $1.00/lb ZN
  • 9.
    TSXV: FPC |WWW.FALCORES.COM | 9 AFTER TAX NPV AND IRR SENSITIVITY TO GOLD PRICES Gold Price (US$/oz) $1,150 $1,200 $1,250 $1,300 $1,350 $1,400 Pre-Tax NPV 5% C$M $898 $1,015 $1,131 $1,248 $1,364 $1,481 After-Tax NPV 5% C$M $521 $594 $667 $739 $804 $874 Pre-Tax IRR 17.4% 18.7% 20.0% 21.3% 22.5% 23.7% After-Tax IRR 13.8% 15.0% 16.0% 17.1% 18.0% 18.9% Pre-Tax Payback Years 4.4 4.1 3.8 3.5 3.3 3.1 After-Tax Payback Years 4.7 4.4 4.1 3.8 3.6 3.4 HORNE 5 PROJECT| PEA FINANCIAL HIGHLIGHTS Note: Commodity Price Assumptions in US$ - $1,250/oz Au, $17.00/oz AG, $2.85/lb CU, $1.00/lb ZN
  • 10.
    TSXV: FPC |WWW.FALCORES.COM | 10 TOTAL MATERIAL MINED (M tonnes) 63.8 AVERAGE DILUTED GRADE OF MATERIAL (g/t AuEq) 2.60 TOTAL GOLD CONTAINED (M Ozs Au) 3.4 TOTAL GOLD PRODUCED (M Ozs Au) 2.9 PAYABLE GOLD PRODUCED (%) 86.8% NSR / TONNE (C$/tonne) 106 AVERAGE GOLD PRODUCTION LIFE OF MINE (Kozs Au) 236 LIFE OF MINE (Years) 12 HORNE 5 PROJECT | PEA LIFE OF MINE PRODUCTION METRICS THE LARGEST UNDEVELOPED GOLD MINE IN QUEBEC 67% 8% 15% 10% NSR REVENUE SPLIT Gold Silver Zinc Copper Note: Commodity Price Assumptions in US$ - $1,250/oz Au, $17.00/oz AG, $2.85/lb CU, $1.00/lb ZN
  • 11.
    TSXV: FPC |WWW.FALCORES.COM | 11 Margin (US$) -- $200 $400 $600 $800 $1,000 $1,200 $1,400 HORNE 5 PROJECT| LOW ALL-IN SUSTAINING COSTS – PER GOLD OUNCE Cash Cost Summary On-Site Mining $324 On-Site Processing $340 Tailings and water $70 On-Site G&A $47 Smelting and Refining $107 Royalties $35 By-Product Credit ($608) Sustaining $98 Closure $13 Total $427 Gold Margin $823 Gold Margin: US$823 per Au Oz. All-in Sustaining Cash Cost*: US$427 per Au Oz. * All-in Sustaining Costs are presented as defined by the World Gold Council ("WGC") less Corporate G&A
  • 12.
    TSXV: FPC |WWW.FALCORES.COM | 12 HORNE 5 PROJECT| PRE-PRODUCTION CAPITAL COST C$905M / US$680M C$247 C$352 C$21 C$98 C$19 C$109 C$60 Mining Processing Plant Electrical and Communication Site Infrastructure Tailings and Water Management Indirects Contingency TOTAL PRE-PRODUCTION CAPITAL COSTS C$905M US$680M
  • 13.
    TSXV: FPC |WWW.FALCORES.COM | 13 HORNE 5 PROJECT| SITE LAYOUT
  • 14.
    TSXV: FPC |WWW.FALCORES.COM | 14 HORNE 5 PROJECT| MINING APPROACH – 3 PHASE APPROACH ANTICIPATED INITIAL APPROACH FLEXIBILITY TO FURTHER DEEPEN SHAFT
  • 15.
    TSXV: FPC |WWW.FALCORES.COM | 15 HORNE 5 PROJECT| TARGETS TO INCREASE TONNAGE – STRONG GROWTH STRONG POTENTIAL TO INCREASE MINERAL RESOURCES ON THE HORNE 5 DEPOSIT ? ?
  • 16.
    TSXV: FPC |WWW.FALCORES.COM | 16 HORNE 5 PROJECT| NEAR SURFACE TARGETS – QUEMONT TARGET AREA QUEMONT PRODUCTION SHAFT ? WESTERN PLUNGE
  • 17.
    TSXV: FPC |WWW.FALCORES.COM | 17 HORNE 5 PROJECT – FEASIBILITY TEAM AND INDUSTRY PARTNERS Integrator & Mill Design  Integrator for Feasibility Document  Mill Design  120kv Line & Sub-station Geology & Mining Engineering  43-101 Resource Report  Block Model  Mine Design  Mine Operation Opex & Capex Geotechnics, Hydrogeology & TMF  Geotechnical Review & Tests  Hydro-geology & Water Management  Tailings Management Facilities Environment & Mining Infrastructures  Baseline Study and Environmental Impact  Legislation (MDDELCC & ACCE)  Community & Social Impact  Surface Mining Infrastructure  Luc Lessard, Eng.  Former COO of Canadian Malartic Partnership, Former COO and Senior VP of Engineering & Construction for Osisko Mining  Former VP of Engineering & Construction for Iamgold and Former Executive Director of Engineering & Construction for Cambior  Francois Vezina, Eng., MBA, Mine Development – Director, Osisko Technical Services  Former Mine Manager Osisko and Agnico-Eagle; Technical Services Manager for Agnico-Eagle (LaRonde II, Pinos Altos, Kittilä)  Christian Laroche, Eng., Processing & Metallurgy – Director, Osisko Technical Services  Metallurgical engineer with 15 years experience in plant design, engineering, feasibility, construction and commissioning  Robert Wares, P. GEO, Geology – Chief Geologist, Osisko Technical Services  Co-Founder of Osisko Mining Corporation Mine Infrastructures  UG Ore Handling Design  UG Electricity Surface Infrastructures  Mine/administration building facilities  Service infrastructures (gate, storage)  Municipal engineering
  • 18.
    TSXV: FPC |WWW.FALCORES.COM | 18 TIMELINE – ON THE ROAD TO FEASIBILITY ACTIVITIES START COMPLETION PEA COMPLETED Environmental Impact assessment Q2 2016 Q2 2017 Feasibility Study Q2 2016 Q2 2017 Dewatering phase 1 Q3 2016 Q2 2018 Detailed engineering Q1 2017 Q2 2018 Underground permits for underground exploration Q2 2017 Head frame and hoist construction Q3 2017 Q3 2018 Public audiences – “BAPE” Q3 2017 Q1 2019 Permits for project construction Q1 2019 Processing plant construction Q1 2019 First mineralized ore in mine Q3 2020 Full Mine ramp up (Phase 1) Q4 2020 End of process plant construction / plant commissioning Q4 2020 Full process plant ramp up Q2 2021
  • 19.
    TSXV: FPC |WWW.FALCORES.COM | 19 HIGHLY MECHANIZED UNDERGROUND MINING OPERATION - HIGH LEVEL OF AUTOMATION LOW ALL-IN SUSTAINING CASH COST STRONG RESOURCE GROWTH POTENTIAL - ALONG STRIKE & AT DEPTH WELL POSITIONED TO FURTHER DE-RISK AND DEVELOP THE HORNE 5 DEPOSIT HORNE 5 PROJECT– THE LEADING CANADIAN GOLD DEVELOPER
  • 20.
    TSXV: FPC |WWW.FALCORES.COM | 20 HIGH MARGIN PROJECT – HIGHLY MECHANISED PROJECT Goldex (Agnico Eagle) Young-Davidson (Alamos) LaRonde (Agnico Eagle) Horne 5 (Falco) Resource Grade (g/t AuEq) 1.8 2.8 5.1 2.9 Mining Method Long hole Transverse long hole Longitudinal Retreat / Transverse Open Stoping Transverse long hole Depth (m) 800 - 1,500 750 - 1,500 2,000-3,000 600 - 2,300 Stope Size 15-38 x 30 x 50 20-25 x 20 x 30 5-25 x 15 x 30 38 x 15 x 15 Mining Rate 5,100 tpd 8,000 tpd * 7,200 tpd 15,000 tpd Specific Gravity 2.8 2.69 3.3 3.45 Mining Dilution 15% 10%-20% 10%-20% < 4% Operating Cost/NSR $41/t * $53.50/t * $95/t $47.50/T* Annual Production (koz) 71,000 * 200,000 * 230,000 * 236,000* * Projected life-of-mine (LOM) Source: Company website, technical reports and filings from SEDAR
  • 21.
    TSXV: FPC |WWW.FALCORES.COM | 21 Pre-production assets over 5 mm ozs & Capex below $1 bn Company Country Asset EV Resources EV / Resources CAPEX (name) (US$mm) (mmoz Au) (US$/oz) (US$mm) Pretium Canada Brucejack $2,024 20.1 $101 $747 TMAC Canada Hope Bay $1,206 5.9 $203 $175 First Mining Finance Canada Springpole $375 8.1 $46 $438 Victoria Canada Eagle $208 6.4 $33 $411 Sabina Canada Back River $177 7.2 $25 $297 Canadian Average $798 $81 Asanko Gold Ghana Asanko $1,042 9.4 $111 $760 Continental Gold Colombia Buritica $378 9.0 $42 $390 Gold Road Australia Yamarna $371 6.1 $61 $286 Belo Sun Brazil Volta Grande $308 6.9 $44 $298 Lydian Armenia Amulsar $201 5.1 $40 $370 Midas Gold USA Stibnite $190 6.5 $29 $970 Exeter Chile Caspiche $97 25.3 $4 $279 Euro Sun Mining Romania Rovina Valley $44 9.0 $5 $509 Orezone Gold Burkina Faso Bombore $44 5.1 $9 $250 Rest of the World Average $297 $38 Falco Resources Canada Horne 5 $105 6.6 $16 COMPARABLE ANALYSIS – VALUE GAP TO BE BRIDGED Note: Companies with market capitalizations below US$30mm or without a CAPEX figure were not included in the analysis Note 2: Projects which are not controlled by producers were included in the analysis Source: BMO Capital Markets, Company filings, Factset, SNL, As of Close on August 23, 2016 UPSIDE
  • 22.
    TSXV: FPC |WWW.FALCORES.COM | 22 FALCO RESOURCES – CAPITAL SUMMARY & SHAREHOLDER REGISTRY CAPITAL STRUCTURE SHAREHOLDER REGISTRY Osisko Gold Royalties 16.0% Raymond James 6.8% Quebec Funds 5.7% Pate Capital 3.7% US Global 2.5% Tocqueville 2.1% Commodity Discovery Fund 1.1% AgaNola AG 1.0% Insiders (D&O) 3.8% Shares Outstanding (basic) 113,937,797 Stock Options 8,846,319 Warrants 193,402 Shares Outstanding (fully diluted) 122,977,518 Cash Position ~C$10 Million SHARE PRICE PERFORMANCE INITIAL PEA NEW RESOURCE UPDATE 1-month trading average 159,306 3-month trading average 346,146 6-month trading average 430,557 TRADING VOLUME Source: Factset, Bloomberg, public filings and Company estimates
  • 23.
    TSXV: FPC |WWW.FALCORES.COM | 23 FALCO RESOURCES – SENIOR LEADERSHIP TEAM OFFICERS & TECHNICAL TEAM BOARD OF DIRECTORS Sean Roosen, Chairman Mario Caron, Lead Director Luc Lessard, President & CEO, Director Helene Cartier, Director Jim Davidson, Director Claude Ferron, Director Paul Henri-Girard, Director Luc Lessard, President & CEO, Director Vincent Metcalfe, CFO Claude Léveillée, Vice-President Community Relations & HR Claude Bernier, Exploration Manager Sylvain Doire, Environment Claude Pilote, Senior Geologist TECHNICAL TEAM – OSISKO TECHNICAL SERVICES Robert Wares, Chief geologist Francois Vezina, Director – Mining Christian Laroche, Director – Processing Daniel Mathieu – Mechanical Designer Iain Farmer – Project Engineer
  • 24.
    TSXV: FPC |WWW.FALCORES.COM | 24 Head Office Falco Resources Ltd. 1100, avenue des Canadiens-de-Montréal Bureau 300 Montréal, QC H3B 2S2 Tél. : +1.514.905.3162 Toll Free : +1.888.915.2009 Courriel : info@falcores.com Investor Inquiries Vincent Metcalfe, CFO Tel: +1.514.905.3162 Email: vmetcalfe@falcores.com CONTACT US
  • 25.
    TSXV: FPC |WWW.FALCORES.COM | 25 APPENDIX Appendix A – Glencore Back-In Agreement Appendix B – Reserves & Resources Appendix C – PEA Additional Information Appendix D – Resource & Modeling Notes
  • 26.
    TSXV: FPC |WWW.FALCORES.COM | 26 Appendix A – Glencore Back-In Agreement  Glencore will retain its back-in right to acquire a 65% interest on any base metal deposit containing more than 350,000 tonnes copper metal equivalent after presentation of a NI 43-101 compliant resource, under the following conditions:  paying Falco three times the project-specific exploration and development expenditures;  paying Falco three times the Rouyn regional base metal exploration expenditures up to a maximum of $20 million;  Paying 65% of the development Expenditures  Glencore must complete a compliant feasibility study, within a specified period and at no cost to Falco;  Falco will retain a 35% interest; receive a 6-month financing period subsequent to a production decision; and will participate in a JV management committee where unanimous agreement is required on critical mining decision  The back-in right does not apply to any gold deposit, defined as a deposit where the value of gold and silver are three times greater than the value of base metals, using 6-month average metal prices at closing as defined at the date of the agreement. As such, gold deposits are solely to the Falco account.  Glencore retains a 1-2% NSR on all metals on mineral claims transferred to Falco. Where historic royalties exist, the combined royalty is capped at 3 to 4%. In areas with no prior royalties, the NSR is capped at 2%.  Glencore has the right to explore for and exploit smelter materials (e.g. flux) in all areas. Should smelter materials be mined from the Falco properties, Falco will receive a royalty of $0.50 per tonne plus 50% of any gold which may be recovered  Glencore retains their rights of first refusal for custom milling and smelting of base metal production Terms of the Agreement
  • 27.
    TSXV: FPC |WWW.FALCORES.COM | 27 Appendix B – 2016 Reserves and Resources of Horne 5 Deposit Resource Class Cut-off (NSR $C) Tonnes (Mt) AuEq (g/t) Au (g/t) Ag (g/t) Cu (%) ZN (%) Contained AuEq (Moz) Contained Au (Moz) Contained Ag (Moz) Contained Cu (Mlbs) Contained Zn (Mlbs) > 50 82.2 2.53 1.59 14.49 0.18 0.90 6.694 4.212 38.293 328.1 1,638.4 > 55 74.1 2.64 1.66 14.87 0.19 0.94 6.273 3.959 35.397 306.2 1,531.8 > 60 66.0 2.74 1.74 15.26 0.19 0.97 5.823 3.691 32.378 283.1 1,412.1 > 65 58.3 2.86 1.82 15.60 0.20 1.00 5.361 3.418 29.273 260.4 1,284.8 > 70 51.1 2.98 1.91 15.93 0.21 1.02 4.893 3.142 26.163 237.7 1,152.6 Indicated > 75 44.2 3.11 2.01 16.20 0.22 1.04 4.421 2.865 23.048 215.2 1,017.0 > 80 38.0 3.25 2.12 16.46 0.23 1.06 3.962 2.592 20.086 193.4 886.7 > 85 32.3 3.39 2.25 16.69 0.24 1.07 3.525 2.332 17.331 173.0 761.7 > 90 27.5 3.54 2.37 16.88 0.25 1.08 3.129 2.095 14.902 154.0 652.4 > 95 23.3 3.70 2.50 17.04 0.27 1.09 2.775 1.878 12.780 136.8 558.6 > 100 19.7 3.86 2.64 17.25 0.28 1.09 2.452 1.679 10.948 121.1 474.3 > 50 19.2 2.62 1.72 22.47 0.21 0.56 1.616 1.060 13.841 86.6 237.2 > 55 16.6 2.78 1.85 23.78 0.21 0.57 1.483 0.985 12.692 76.6 208.6 > 60 14.5 2.92 1.97 24.99 0.21 0.57 1.367 0.920 11.688 68.6 183.0 > 65 12.7 3.08 2.10 26.26 0.22 0.57 1.254 0.855 10.705 61.7 158.1 > 70 10.9 3.25 2.25 27.60 0.23 0.55 1.139 0.788 9.670 54.7 133.1 Inferred > 75 9.1 3.47 2.46 28.48 0.24 0.53 1.013 0.716 8.307 47.5 106.1 > 80 7.6 3.71 2.69 28.92 0.25 0.50 0.904 0.655 7.055 41.5 83.4 > 85 6.4 3.94 2.91 29.77 0.26 0.47 0.814 0.601 6.146 36.4 67.1 > 90 5.4 4.21 3.15 30.82 0.27 0.46 0.733 0.549 5.372 32.0 54.9 > 95 4.8 4.42 3.35 31.48 0.27 0.45 0.678 0.514 4.835 28.9 47.4 > 100 4.3 4.60 3.51 32.28 0.28 0.45 0.636 0.485 4.460 26.6 42.6 Exchange Rate: CAD/USD = 1.27 , see resource notes in appendix D
  • 28.
    TSXV: FPC |WWW.FALCORES.COM | 28 Appendix B – Longitudinal & Cross Section of Horne 5 Deposit ENV_B ENV_C ENV_D DEPOSIT HIGH GRADE ZONES 5.48 g/t AuEq 3.79 g/t AuEq
  • 29.
    TSXV: FPC |WWW.FALCORES.COM | 29 Appendix B – Historical Drill Density of Horne 5 Deposit 600m HORNEQUEMONT  Exceptional Drill Density  4,384 underground drill holes at 15 spacing (305,788m) drilled by Noranda  Very high confidence in historical drilling  Great upside at Depth – limited drilling vs. upper area
  • 30.
    TSXV: FPC |WWW.FALCORES.COM | 30 Appendix B – Horne 5 Deposit & 2015 Confirmation Drilling Program HORNEQUEMONT
  • 31.
    TSXV: FPC |WWW.FALCORES.COM | 31 • NPV of $1.131 billion at a 5% discount rate and an IRR of 20.0% before taxes and mining duties • NPV of $667 million at a 5% discount rate and an IRR of 16.0% after taxes and mining duties • Peak-year production of 274 kozs and average LOM annual production of 236 kozs of gold • Net payable gold recovery of 86.8% • 3,051,000 gold ounces production at an average diluted grade of 2.60 g/t Au LOM • 2,903,000 ounces of payable gold LOM • 807 million pounds of payable zinc LOM • 194 million pounds of payable copper LOM • 23.8 million ounces of payable silver LOM • All-in sustaining costs* of US$427 PER PAYABLE GOLD OUNCE • All-in cost (CAPEX plus OPEX) is estimated at US$660 per payable gold ounce • Initial CAPEX of C$905 million (including a $60 million contingency) or US$680 million • Payback Period of 3.8 years pre-tax and 4.1 years post-tax • Gross Revenue of $6.8 billion and Operating Cash-flow of $2.6 billion • Start of production in 2020 • Full production in 2021 • Initial mine life of 12 years *All-in Sustaining Costs are presented as defined by the World Gold Council ("WGC") less Corporate G&A Note: Commodity Price Assumptions in US$ - $1,250/oz Au, $17.00/oz AG, $2.85/lb CU, $1.00/lb ZN Appendix C – Horne 5 Project Key Highlights
  • 32.
    TSXV: FPC |WWW.FALCORES.COM | 32 Appendix C – Proposed Flowsheet of Horne 5 Project
  • 33.
    TSXV: FPC |WWW.FALCORES.COM | 33 Appendix C – High Level of Automation for Horne 5 Project Surface control underground operations: • Hoist – production and services • Teleoperation of loaders • Monitoring and management of ventilation requirements • Monitoring of the paste backfill distribution • Water pumping monitoring • Staff & equipment location monitoring
  • 34.
    TSXV: FPC |WWW.FALCORES.COM | 34 Appendix C – Ramp-Up Example for Horne 5 Project • 23,500 tonne stopes (38x15x15) • 20 effective hrs/day • 58-day stope cycle time • 4 mucking faces • 6-7 days mucking per stope
  • 35.
    TSXV: FPC |WWW.FALCORES.COM | 35 Appendix C – Example Sequence for a Single Pyramid – 1st level
  • 36.
    TSXV: FPC |WWW.FALCORES.COM | 36 Appendix C – Example of Active Pyramids during Ramp-up • 4 pyramids will be active (mucking) at any given time • Full production (15,000 tpd) expected to be reached in as quickly as 4.5 months
  • 37.
    TSXV: FPC |WWW.FALCORES.COM | 37 Source: Wood Mackenzie Ltd. And BMO Capital Markets * All-in Sustaining Costs are presented as defined by the World Gold Council ("WGC") less Corporate G&A $0 $500 $1,000 $1,500 $2,000 $2,500 2016 Gold Mine, Composite, Total Cash + Sustaining Capex Cost Grouped By Mine and Ranked By Total Cash plus Sustaining Capex TotalCash+SustainingCapex(US$/oz) 0 500 1000 1500 2000 Paid Gold (t) Horne 5 Project AISC of US$427/oz Appendix C – Low All-In Sustaining Cost, a Top Quartile Asset
  • 38.
    TSXV: FPC |WWW.FALCORES.COM | 38 Appendix D – Mineral Resource Estimates & Modeling Notes 1. The effective date of the resource estimate is January 8, 2016. The Independent and Qualified Persons for the Mineral Resource Estimate as required by National Instrument 43-101 are Carl Pelletier, B.Sc., P.Geo. and Vincent Jourdain, P.Eng., Ph.D., both employees of InnovExplo Inc. 2. Mineral Resources are not Mineral Reserves and have not demonstrated economic viability. 3. While the results are presented undiluted and in situ, the reported mineral resources are considered by the Qualified Persons to have reasonable prospects for economic extraction. 4. These estimates include four (4) low grade gold-bearing mineralized zones. 5. The principal low-grade gold-bearing mineralized zone includes five (5) high-grade gold-bearing zones, one (1) high-grade copper-bearing zone, one (1) high-grade zinc-bearing zone and two (2) high-grade silver-bearing zones. 6. Resources were compiled at NSR cut-offs of C$50, C$55, C$60, C$65, C$70, C$75, C$80, C$85, C$90, C$95 and C$100 per tonne. The official base case resource is reported at a C$65 per tonne NSR cut-off. 7. The appropriate NSR cut-off will vary depending on prevailing economic and operational parameters to be determined. 8. NSR estimates are based on the following assumptions: exchange rate of $C1.27/$US, metal prices of (all $US): gold $1,165/oz, silver $15.77, copper $2.53/lb, zinc $0.89/lb (One-year trailing average as of December 14, 2015). Net recoveries of 84.0% for gold, 75.3% for silver, 71.8% for zinc and 66.5% for copper. Smelting cost (including transportation) C$7.73 per tonne. 9. Gold equivalent calculations assume these same metal prices. 10. Inferred resources are separate from Indicated Resources 11. The quantity and grade of reported Inferred Resources in this estimate are uncertain in nature and there has not been sufficient work to define these Inferred Resources as Indicated or Measured Resources. It is uncertain if further work will result in upgrading them to an Indicated or Measured mineral resource category. 12. Densities within ENV_A were estimated from Noranda drill hole iron assay data and Falco density data using a 3-pass ID2 interpolation method. Limited density data was available for zones ENV_B to D and a fixed density of 2.88 t/m3 was assumed for these zones which represent the median of the available data. 13. Compositing was done on drill hole sections falling within the mineralized zones (composite = 3.0 metres). 14. The resource was estimated using Geovia GEMS 6.7. The estimate is based on 4,411 diamond drill holes (323,087 m). For silver the estimates also uses the results of an exhaustive metallurgical test comprising 2,112 diamond drill holes assayed for silver over a total length of 75,540 meters. A minimum true thickness of 7.0 m was applied, using the grade of the adjacent material when assayed, or a value of zero when not assayed. 15. Only the silver interpolation in the Inferred resources does not use the material when not assayed. 16. The estimate was based on a three dimensional block model (5x5x5 metre blocks). Within ENV_A. Wireframes of high grade zones were used as hard boundaries to constrain the interpolation of gold, silver, copper, zinc and density into the block model. Interpolation parameters were derived based on geostatistical analysis conducted on 3 metre composited drill hole data. Block grades have been estimated using Inverse Distance Squared (ID2) interpolation method and the mineral resources have been classified based on proximity to sample data and the continuity of mineralization in accordance with CIM best practices. 17. Capping of high grade gold values was done on raw assay data and established on a per zone basis: HG_A: 35 g/t, HG_B: 35g/t, HG_C: 25g/t, HG_D: 35g/t, HG_E: 25g/t, ENV_A: 35g/t, ENV_B: 25g/t, ENV_C: 25g/t, ENV_D: 25g/t and for high grade silver SG_HG:100g/t, HG_D: 165 g/t, ENV_A_SG_Low: 110 g/t, ENV_B: 100 g/t, ENV_C: 100 g/t, ENV_D: 100 g/t. No upper capping was applied to copper and zinc data. 18. Tonnage estimates were rounded to the nearest hundred tonnes. Any discrepancies in the totals are due to rounding effects. Rounding practice follows the recommendations set out in Form 43- 101F1. 19. CIM definitions and guidelines were followed in estimating mineral resources. 20. InnovExplo is not aware of any known environmental, permitting, legal, title-related, taxation, socio-political, marketing or other relevant issue that could materially affect the mineral resource estimate. 21. The mineral resources presented herein are categorized as Indicated and Inferred based on geological and grade continuity. A maximum distance to the closest composite of 25 meters was used for indicated Resources. The average distance to the nearest composite is 8.3 meters for the Indicated resources and 35.2 meters for the Inferred resources. 22. Metal contained in ounces (troy) = metric tonnes x grade / 31.10348. Calculations used metric units (metres, tonnes and g/t). Metal contents are presented in ounces and pounds. RESOURCE ESTIMATE NOTES RESOURCE MODELING NOTES