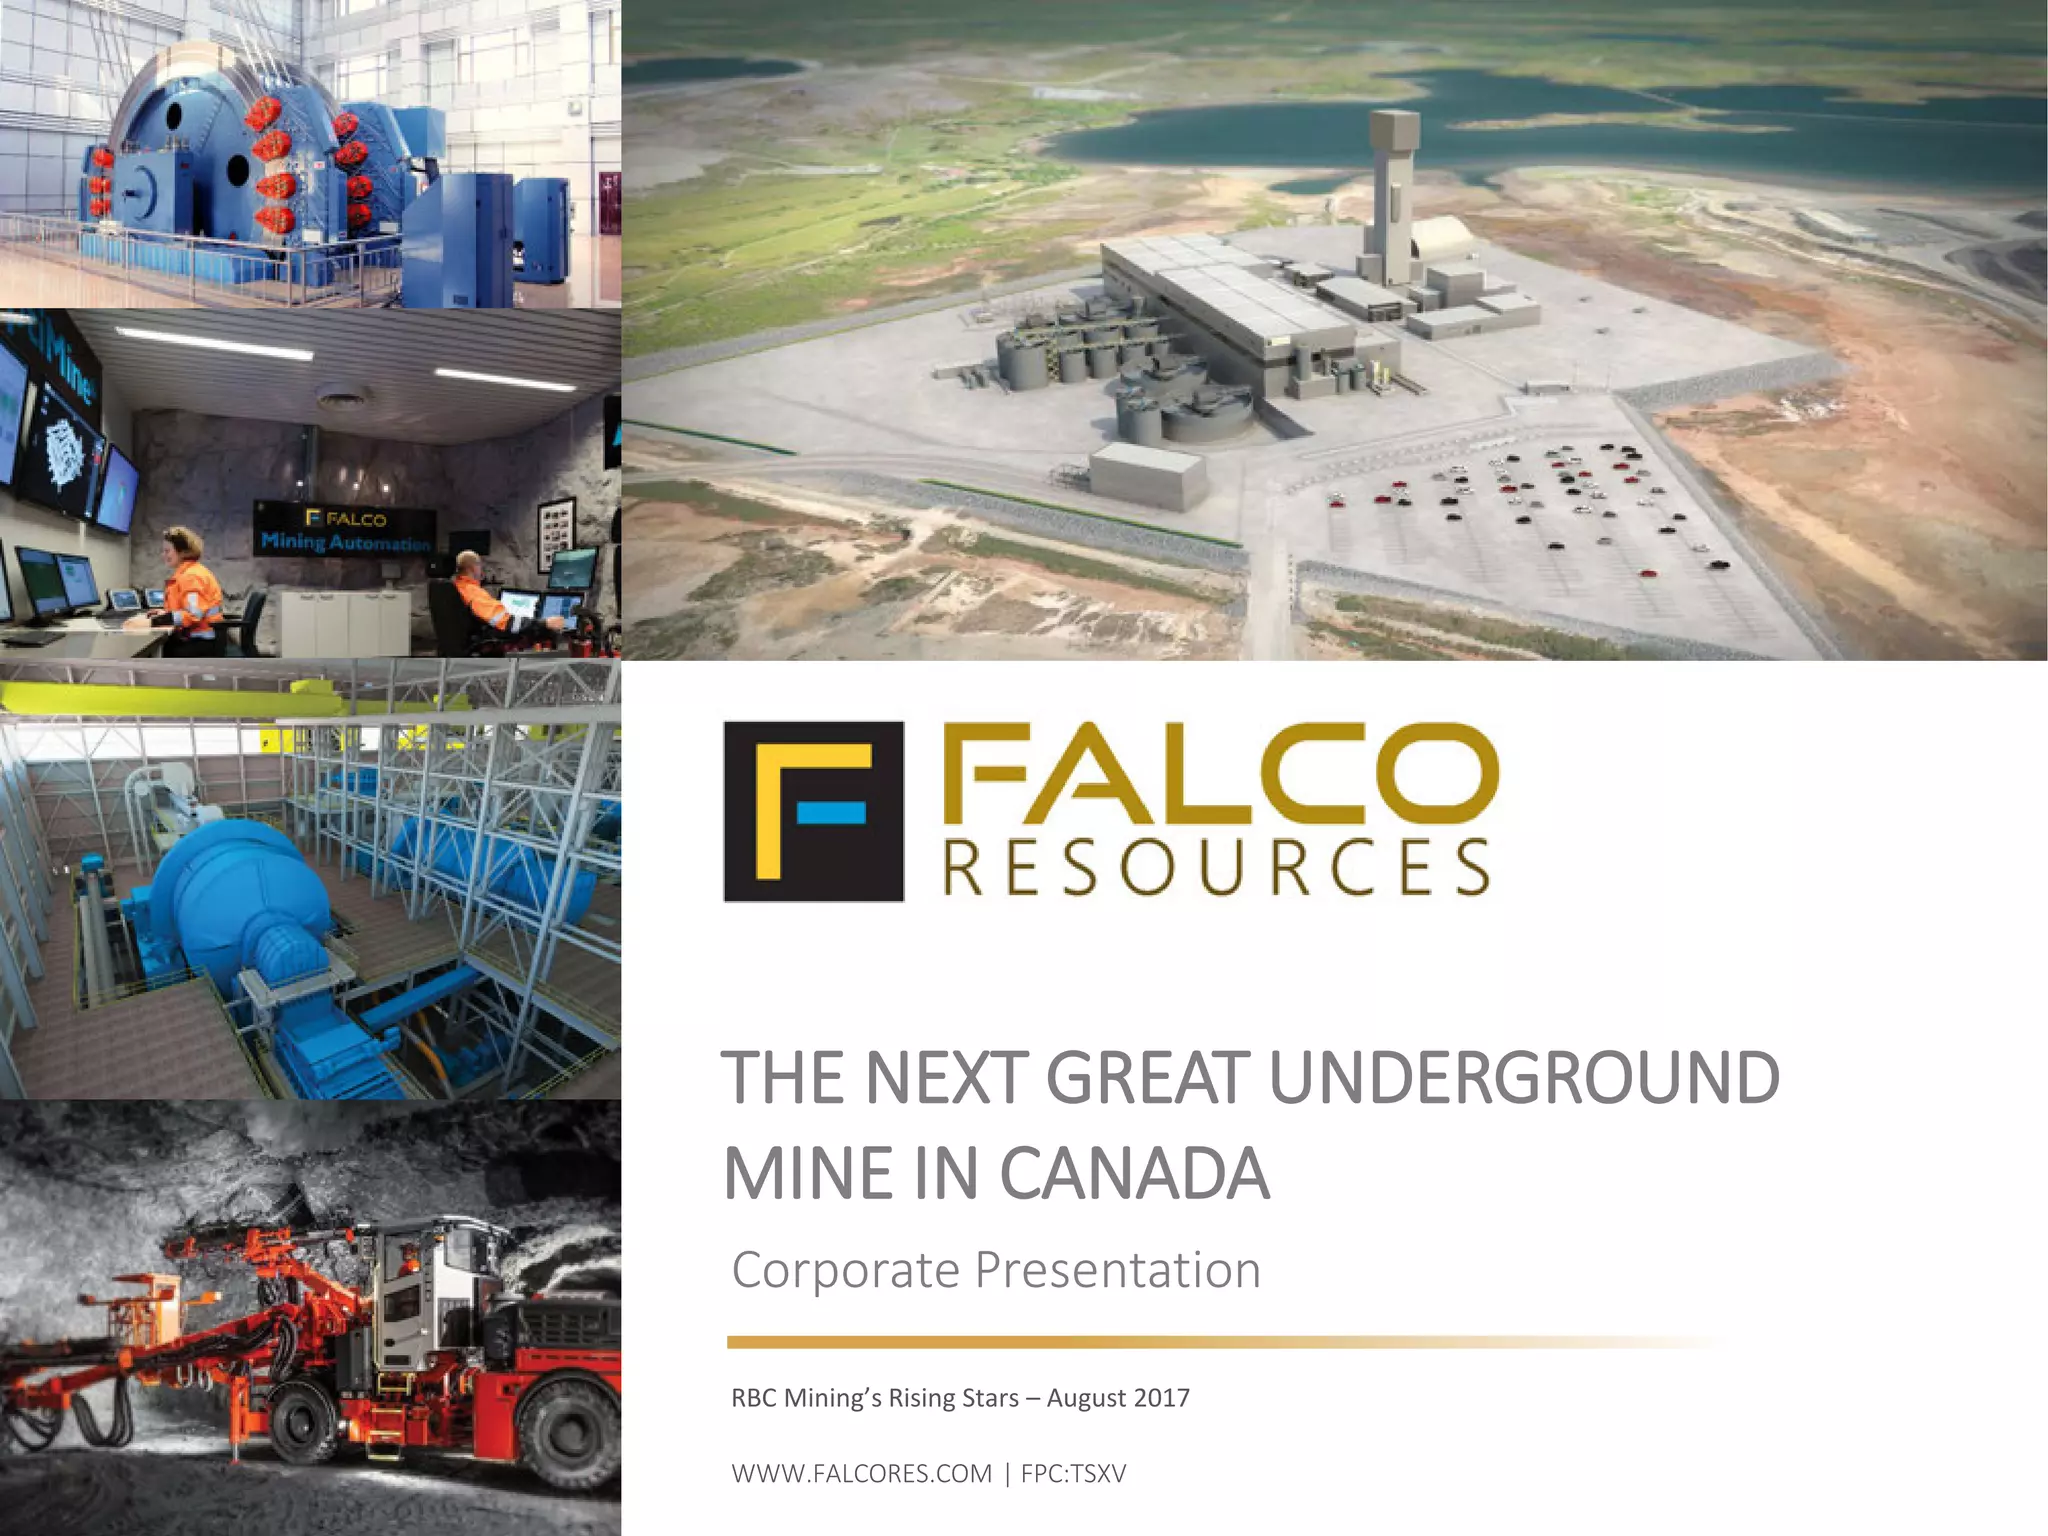
This corporate presentation provides an overview of Falco Resources Ltd.'s Horne 5 mining project in Canada. Key points include:
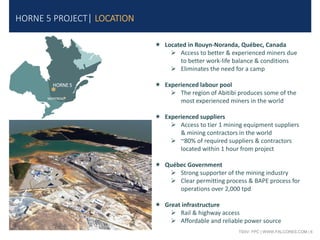
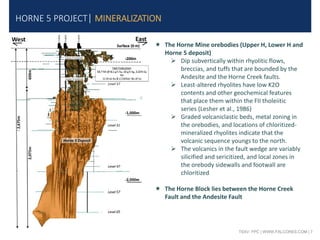
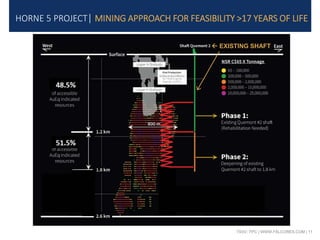
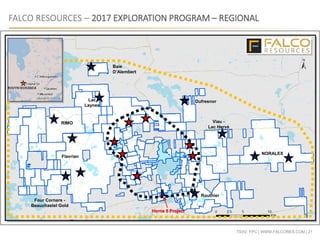
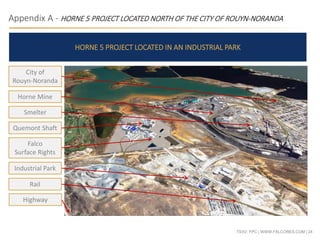
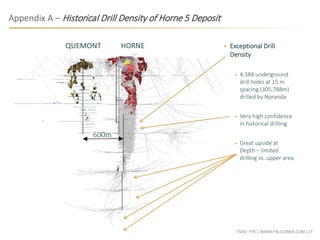
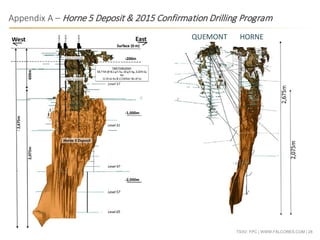
- The project involves developing an underground mining operation at the site of the historic Horne Mine in Rouyn-Noranda, Quebec.
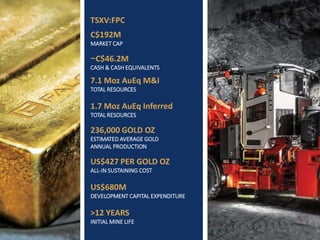
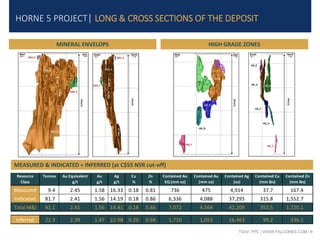
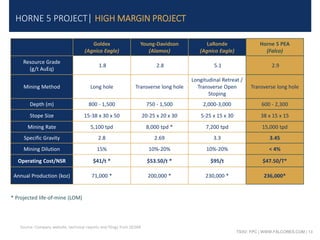
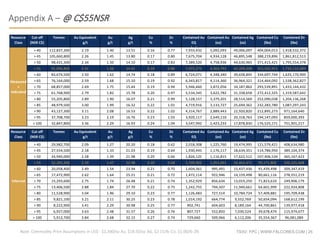
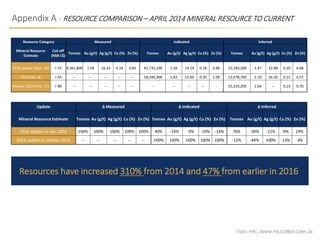
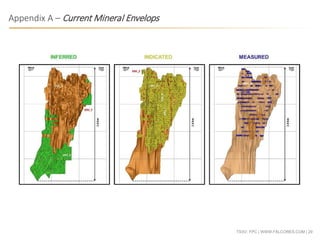
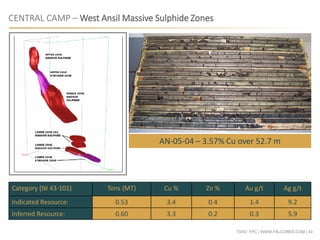
- Measured and indicated resources total over 7 million ounces of gold equivalent, with additional inferred resources of over 1.7 million ounces.
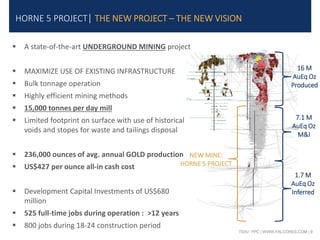
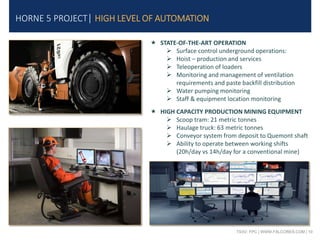
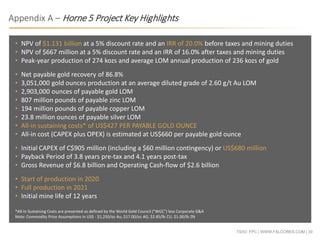
- The plan is for a bulk tonnage, highly automated underground mine producing an average of 236,000 ounces of gold annually over an initial 12+ year mine life.
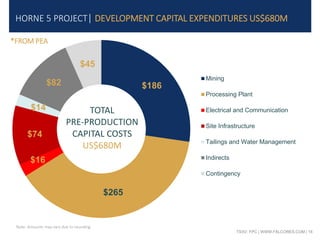
- Total estimated development costs are US$680 million. The project aims to maximize use of existing infrastructure to minimize surface footprint.