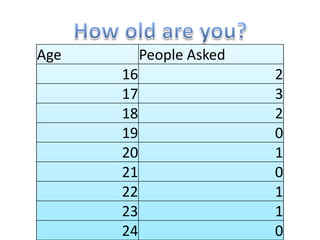
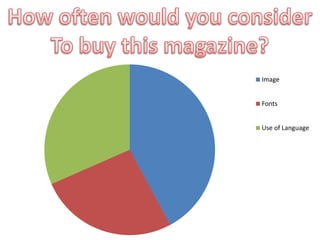
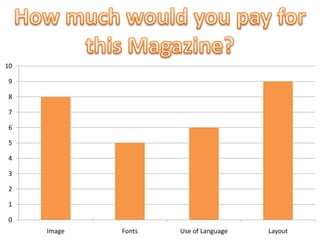
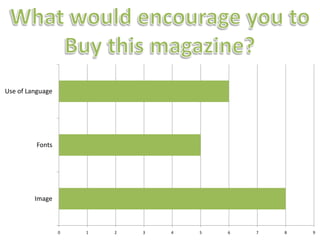
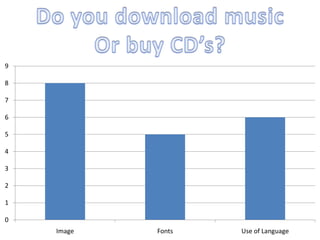
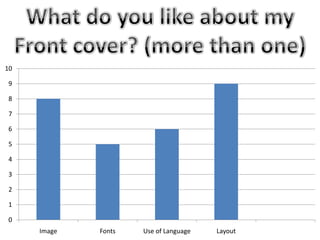
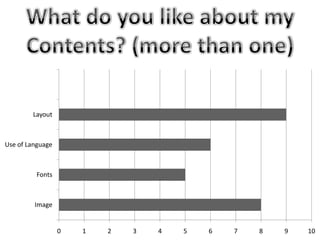
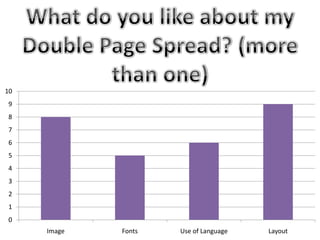
The document contains a table showing the ages of people asked and the number of people for each age, with the highest responses being for ages 16, 17, and 18. It also contains several bar graphs comparing factors like image, fonts, use of language, and layout, with use of language generally rated highest and image lowest.