Download to read offline

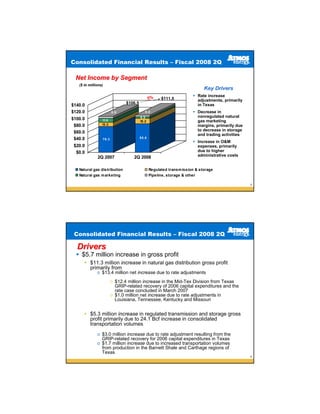
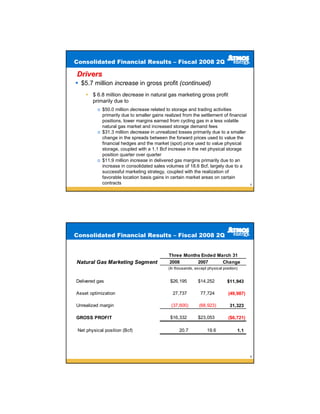
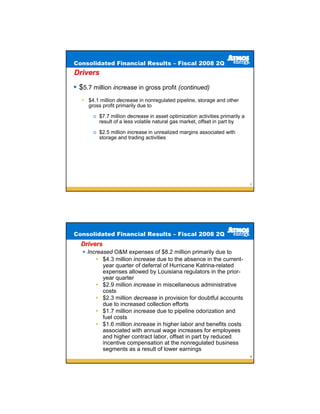
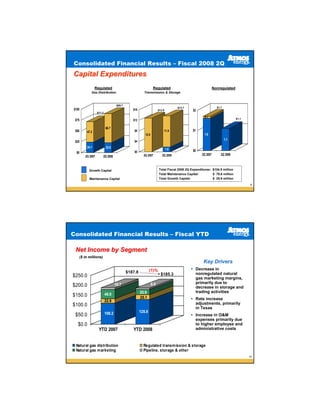
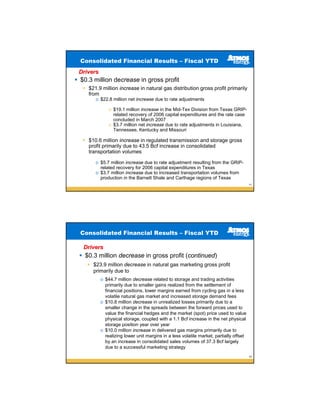
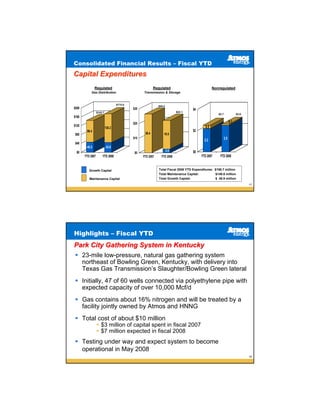
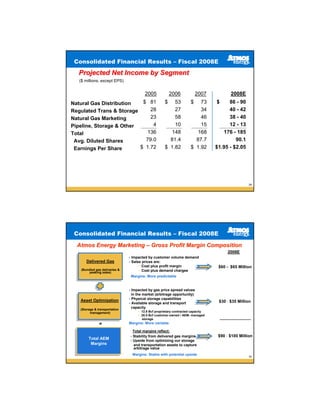
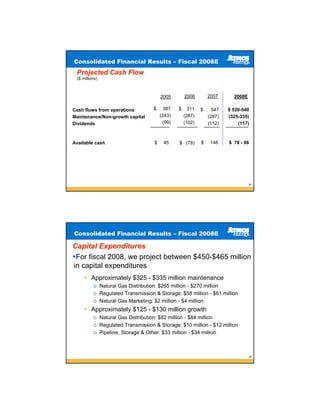
The document summarizes a conference call to review the company's fiscal 2008 second quarter financial results. It provides details on net income by segment, with a 5% increase in natural gas distribution due to rate adjustments. It also discusses drivers for a $5.7 million increase in gross profit, including an $11.3 million rise in natural gas distribution from rate cases. Capital expenditures totaled $104.5 million for the quarter, with $89.7 million for gas distribution and $13.7 million for regulated transmission and storage.


