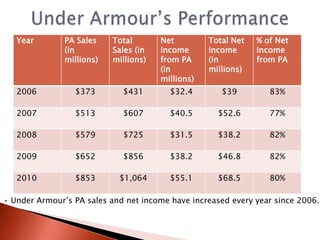
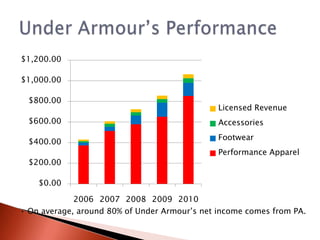
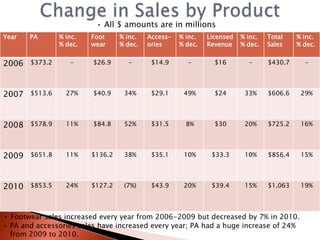
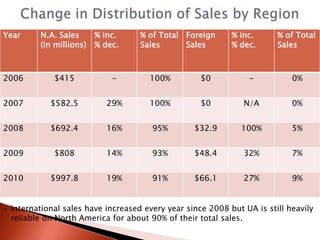
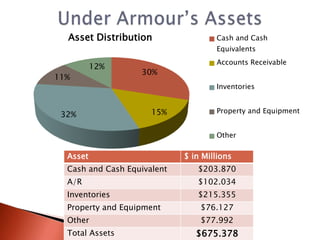
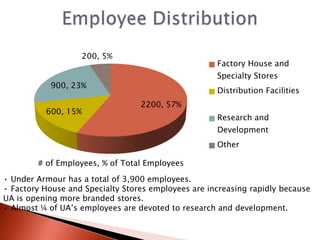
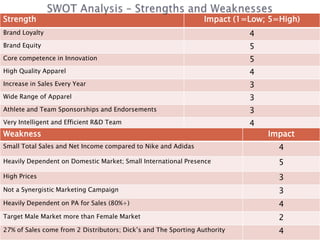
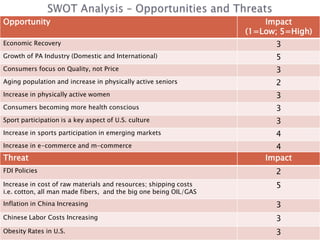
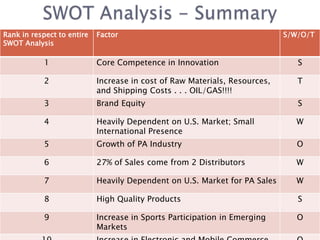
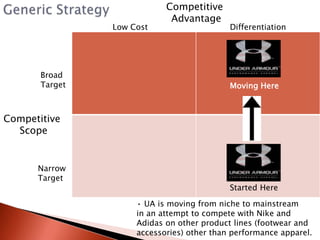
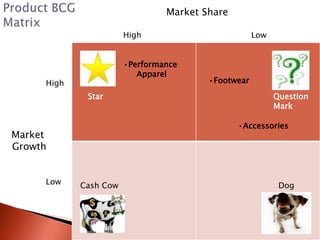
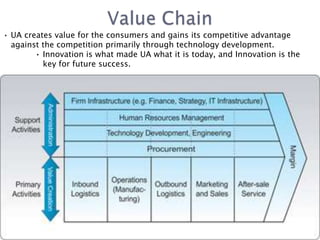
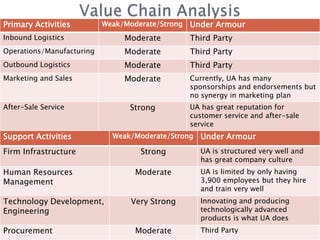
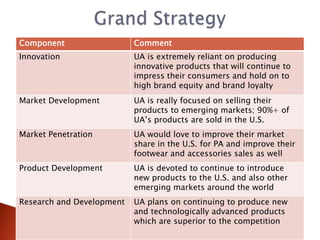
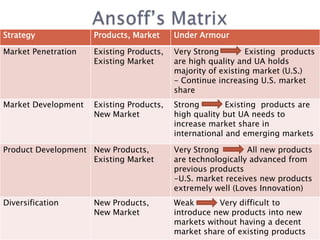
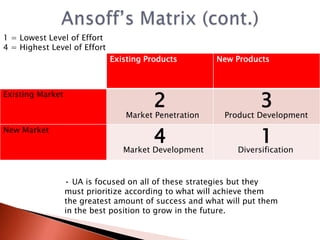
Under Armour:
      Internal Analysis,
        SWOT Analysis,
  Competitive Position, and
Conclusions/Recommendations
              Brian Teufel
             MGT 490-004
            Assignment #3
         Professor McDermott
            March 17, 2011
Year        PA Sales    Total       Net         Total Net   % of Net
               (in         Sales (in   Income      Income      Income
               millions)   millions)   from PA     (in         from PA
                                       (in         millions)
                                       millions)
   2006          $373        $431        $32.4        $39         83%

   2007          $513        $607        $40.5       $52.6        77%

   2008          $579        $725        $31.5       $38.2        82%

   2009          $652        $856        $38.2       $46.8        82%

   2010          $853       $1,064       $55.1       $68.5        80%

• Under Armour’s PA sales and net income have increased every year since 2006.
$1,200.00

$1,000.00

  $800.00
                                               Licensed Revenue
  $600.00                                      Accessories
                                               Footwear
  $400.00
                                               Performance Apparel
  $200.00

    $0.00

             2006 2007 2008 2009 2010
• On average, around 80% of Under Armour’s net income comes from PA.
• All $ amounts are in millions
Year   PA       % inc.   Foot     % inc.   Access-   % inc.   Licensed   % inc.   Total    % inc.
                % dec.   wear     % dec.   ories     % dec.   Revenue    % dec.   Sales    % dec.


2006   $373.2      -     $26.9      -       $14.9      -        $16        -      $430.7     -


2007   $513.6     27%    $40.9     34%      $29.1     49%       $24       33%     $606.6    29%


2008   $578.9     11%    $84.8     52%      $31.5      8%       $30       20%     $725.2    16%


2009   $651.8     11%    $136.2    38%      $35.1     10%      $33.3      10%     $856.4    15%


2010   $853.5     24%    $127.2    (7%)     $43.9     20%      $39.4      15%     $1,063    19%


• Footwear sales increased every year from 2006-2009 but decreased by 7% in 2010.
• PA and accessories sales have increased every year; PA had a huge increase of 24%
  from 2009 to 2010.
Year     N.A. Sales      % inc.     % of Total Foreign      % inc.      % of Total
         (in millions)   % dec.     Sales      Sales        % dec.      Sales


2006         $415            -        100%          $0           -          0%


2007        $582.5         29%        100%          $0         N/A          0%


2008        $692.4         16%         95%        $32.9       100%          5%


2009         $808          14%         93%        $48.4        32%          7%


2010        $997.8         19%         91%        $66.1        27%          9%


• International sales have increased every year since 2008 but UA is still heavily
  reliable on North America for about 90% of their total sales.
Asset Distribution                 Cash and Cash
                                     Equivalents
                                     Accounts Receivable
          12%
                   30%
11%
                                     Inventories


                      15%            Property and Equipment
 32%

                                     Other

  Asset                      $ in Millions
  Cash and Cash Equivalent      $203.870
  A/R                           $102.034
  Inventories                   $215.355
  Property and Equipment         $76.127
  Other                          $77.992
  Total Assets                  $675.378
200, 5%
                                                     Factory House and
                                                     Specialty Stores
           900, 23%
                                                     Distribution Facilities
                                  2200, 57%
          600, 15%
                                                     Research and
                                                     Development
                                                     Other

        # of Employees, % of Total Employees

• Under Armour has a total of 3,900 employees.
• Factory House and Specialty Stores employees are increasing rapidly because
UA is opening more branded stores.
• Almost ¼ of UA’s employees are devoted to research and development.
Strength                                                         Impact (1=Low; 5=High)
Brand Loyalty                                                              4
Brand Equity                                                               5
Core competence in Innovation                                              5
High Quality Apparel                                                       4
Increase in Sales Every Year                                               3
Wide Range of Apparel                                                      3
Athlete and Team Sponsorships and Endorsements                             3
Very Intelligent and Efficient R&D Team                                    4
Weakness                                                                       Impact
Small Total Sales and Net Income compared to Nike and Adidas                      4
Heavily Dependent on Domestic Market; Small International Presence                5
High Prices                                                                       3
Not a Synergistic Marketing Campaign                                              3
Heavily Dependent on PA for Sales (80%+)                                          4
Target Male Market more than Female Market                                        2
27% of Sales come from 2 Distributors; Dick’s and The Sporting Authority          4
Opportunity                                                           Impact
                                                                  (1=Low; 5=High)
Economic Recovery                                                       3
Growth of PA Industry (Domestic and International)                      5
Consumers focus on Quality, not Price                                   3
Aging population and increase in physically active seniors              2
Increase in physically active women                                     3
Consumers becoming more health conscious                                3
Sport participation is a key aspect of U.S. culture                     3
Increase in sports participation in emerging markets                    4
Increase in e-commerce and m-commerce                                   4
Threat                                                                Impact
FDI Policies                                                            2
Increase in cost of raw materials and resources; shipping costs         5
i.e. cotton, all man made fibers, and the big one being OIL/GAS
Inflation in China Increasing                                           3
Chinese Labor Costs Increasing                                          3
Obesity Rates in U.S.                                                   3
Rank in respect to entire   Factor                                          S/W/O/T
SWOT Analysis

            1               Core Competence in Innovation                      S

            2               Increase in cost of Raw Materials, Resources,      T
                            and Shipping Costs . . . OIL/GAS!!!!
            3               Brand Equity                                       S

            4               Heavily Dependent on U.S. Market; Small           W
                            International Presence
            5               Growth of PA Industry                              O

            6               27% of Sales come from 2 Distributors             W

            7               Heavily Dependent on U.S. Market for PA Sales     W

            8               High Quality Products                              S

            9               Increase in Sports Participation in Emerging       O
                            Markets
Competitive
                             Advantage
                Low Cost                    Differentiation


       Broad
       Target                               Moving Here


Competitive
  Scope


      Narrow
      Target
                                            Started Here

                     • UA is moving from niche to mainstream
                     in an attempt to compete with Nike and
                     Adidas on other product lines (footwear and
                     accessories) other than performance apparel.
Market Share

                       High                         Low


                       •Performance
                          Apparel
     High                               •Footwear
             Star                                         Question
                                                          Mark

                                               •Accessories
Market
Growth


     Low    Cash Cow                                       Dog
• UA creates value for the consumers and gains its competitive advantage
  against the competition primarily through technology development.
        • Innovation is what made UA what it is today, and Innovation is the
          key for future success.
Primary Activities         Weak/Moderate/Strong   Under Armour
Inbound Logistics               Moderate          Third Party
Operations/Manufacturing        Moderate          Third Party
Outbound Logistics              Moderate          Third Party
Marketing and Sales             Moderate          Currently, UA has many
                                                  sponsorships and endorsements but
                                                  no synergy in marketing plan
After-Sale Service               Strong           UA has great reputation for
                                                  customer service and after-sale
                                                  service
Support Activities           Weak/Moderate/Strong    Under Armour
Firm Infrastructure                 Strong           UA is structured very well and
                                                     has great company culture
Human Resources                    Moderate          UA is limited by only having
Management                                           3,900 employees but they hire
                                                     and train very well
Technology Development,           Very Strong        Innovating and producing
Engineering                                          technologically advanced
                                                     products is what UA does
Procurement                        Moderate          Third Party
Component                  Comment
Innovation                 UA is extremely reliant on producing
                           innovative products that will continue to
                           impress their consumers and hold on to
                           high brand equity and brand loyalty
Market Development         UA is really focused on selling their
                           products to emerging markets; 90%+ of
                           UA’s products are sold in the U.S.
Market Penetration         UA would love to improve their market
                           share in the U.S. for PA and improve their
                           footwear and accessories sales as well
Product Development        UA is devoted to continue to introduce
                           new products to the U.S. and also other
                           emerging markets around the world
Research and Development   UA plans on continuing to produce new
                           and technologically advanced products
                           which are superior to the competition
Strategy             Products, Market     Under Armour

Market Penetration   Existing Products,   Very Strong        Existing products
                     Existing Market      are high quality and UA holds
                                          majority of existing market (U.S.)
                                          - Continue increasing U.S. market
                                          share
Market Development   Existing Products,   Strong        Existing products are
                     New Market           high quality but UA needs to
                                          increase market share in
                                          international and emerging markets

Product Development New Products,         Very Strong        All new products
                    Existing Market       are technologically advanced from
                                          previous products
                                          -U.S. market receives new products
                                          extremely well (Loves Innovation)
Diversification      New Products,        Weak       Very difficult to
                     New Market           introduce new products into new
                                          markets without having a decent
                                          market share of existing products
1 = Lowest Level of Effort
4 = Highest Level of Effort
                              Existing Products        New Products


                                         2                         3
Existing Market

                                  Market Penetration     Product Development


                                         4                         1
New Market

                                 Market Development          Diversification


                  • UA is focused on all of these strategies but they
                  must prioritize according to what will achieve them
                  the greatest amount of success and what will put them
                  in the best position to grow in the future.
     Domestic Sponsorships/Endorsements
Athlete/Team              Association/Sport   Type of Deal

All Teams                 NFL                 Official supplier of Footwear
Auburn, Boston College,   NCAA                Official Outfitter
Maryland

Brandon Jennings          NBA                 Endorsement

Lindsey Vonn              Skiing              Endorsement
Tom Brady                 NFL                 Endorsement
Michael Phelps            Swimming            Endorsement
Hunter Mahan              PGA                 Endorsement
Cam Newton                NCAA/NFL            Endorsement


           International Sponsorships/Endorsements
Athlete/Team              Association/Sport    Type of Deal
Tottenham                 Champions League     PA and Accessories Provider
Hockey Canada             National Team        Official Outfitter
Hanover 96                Bundesliga           PA and Accessories Provider
All Teams                 Welsh Rugby Union    PA and Accessories Provider
   PA sales and overall sales have increased every year
    since Under Armour has been founded.
   PA sales account for more than 80% of total sales.
   International sales account for less than 10% of sales
    but they have been increasing slightly since 2008.
   Under Armour is attempting to make a push into
    international and emerging markets.
   The two main strengths for Under Armour are its core
    competence in innovation and its brand equity.
   UA is moving from niche to mainstream in an attempt
    to compete with Nike and Adidas on other product
    lines (footwear and accessories) other than
    performance apparel.
   Under Armour’s primary focus should be to
    increase their U.S. market share in other products
    such as footwear and accessories while
    maintaining market leadership in PA.
   Under Armour should move into international
    and emerging markets with caution to assure
    they do not expand too quickly.
   Under Armour needs to continue to provide value
    to consumers through innovation and research
    and development.
   Under Armour needs to integrate their marketing
    plan and make sure than all sponsorships and
    endorsements contribute to the value of the
    brand.

Assignment%20#3 Under Armour Internal And Swot Analysis

  • 1.
    Under Armour: Internal Analysis, SWOT Analysis, Competitive Position, and Conclusions/Recommendations Brian Teufel MGT 490-004 Assignment #3 Professor McDermott March 17, 2011
  • 2.
    Year PA Sales Total Net Total Net % of Net (in Sales (in Income Income Income millions) millions) from PA (in from PA (in millions) millions) 2006 $373 $431 $32.4 $39 83% 2007 $513 $607 $40.5 $52.6 77% 2008 $579 $725 $31.5 $38.2 82% 2009 $652 $856 $38.2 $46.8 82% 2010 $853 $1,064 $55.1 $68.5 80% • Under Armour’s PA sales and net income have increased every year since 2006.
  • 3.
    $1,200.00 $1,000.00 $800.00 Licensed Revenue $600.00 Accessories Footwear $400.00 Performance Apparel $200.00 $0.00 2006 2007 2008 2009 2010 • On average, around 80% of Under Armour’s net income comes from PA.
  • 4.
    • All $amounts are in millions Year PA % inc. Foot % inc. Access- % inc. Licensed % inc. Total % inc. % dec. wear % dec. ories % dec. Revenue % dec. Sales % dec. 2006 $373.2 - $26.9 - $14.9 - $16 - $430.7 - 2007 $513.6 27% $40.9 34% $29.1 49% $24 33% $606.6 29% 2008 $578.9 11% $84.8 52% $31.5 8% $30 20% $725.2 16% 2009 $651.8 11% $136.2 38% $35.1 10% $33.3 10% $856.4 15% 2010 $853.5 24% $127.2 (7%) $43.9 20% $39.4 15% $1,063 19% • Footwear sales increased every year from 2006-2009 but decreased by 7% in 2010. • PA and accessories sales have increased every year; PA had a huge increase of 24% from 2009 to 2010.
  • 5.
    Year N.A. Sales % inc. % of Total Foreign % inc. % of Total (in millions) % dec. Sales Sales % dec. Sales 2006 $415 - 100% $0 - 0% 2007 $582.5 29% 100% $0 N/A 0% 2008 $692.4 16% 95% $32.9 100% 5% 2009 $808 14% 93% $48.4 32% 7% 2010 $997.8 19% 91% $66.1 27% 9% • International sales have increased every year since 2008 but UA is still heavily reliable on North America for about 90% of their total sales.
  • 6.
    Asset Distribution Cash and Cash Equivalents Accounts Receivable 12% 30% 11% Inventories 15% Property and Equipment 32% Other Asset $ in Millions Cash and Cash Equivalent $203.870 A/R $102.034 Inventories $215.355 Property and Equipment $76.127 Other $77.992 Total Assets $675.378
  • 7.
    200, 5% Factory House and Specialty Stores 900, 23% Distribution Facilities 2200, 57% 600, 15% Research and Development Other # of Employees, % of Total Employees • Under Armour has a total of 3,900 employees. • Factory House and Specialty Stores employees are increasing rapidly because UA is opening more branded stores. • Almost ¼ of UA’s employees are devoted to research and development.
  • 8.
    Strength Impact (1=Low; 5=High) Brand Loyalty 4 Brand Equity 5 Core competence in Innovation 5 High Quality Apparel 4 Increase in Sales Every Year 3 Wide Range of Apparel 3 Athlete and Team Sponsorships and Endorsements 3 Very Intelligent and Efficient R&D Team 4 Weakness Impact Small Total Sales and Net Income compared to Nike and Adidas 4 Heavily Dependent on Domestic Market; Small International Presence 5 High Prices 3 Not a Synergistic Marketing Campaign 3 Heavily Dependent on PA for Sales (80%+) 4 Target Male Market more than Female Market 2 27% of Sales come from 2 Distributors; Dick’s and The Sporting Authority 4
  • 9.
    Opportunity Impact (1=Low; 5=High) Economic Recovery 3 Growth of PA Industry (Domestic and International) 5 Consumers focus on Quality, not Price 3 Aging population and increase in physically active seniors 2 Increase in physically active women 3 Consumers becoming more health conscious 3 Sport participation is a key aspect of U.S. culture 3 Increase in sports participation in emerging markets 4 Increase in e-commerce and m-commerce 4 Threat Impact FDI Policies 2 Increase in cost of raw materials and resources; shipping costs 5 i.e. cotton, all man made fibers, and the big one being OIL/GAS Inflation in China Increasing 3 Chinese Labor Costs Increasing 3 Obesity Rates in U.S. 3
  • 10.
    Rank in respectto entire Factor S/W/O/T SWOT Analysis 1 Core Competence in Innovation S 2 Increase in cost of Raw Materials, Resources, T and Shipping Costs . . . OIL/GAS!!!! 3 Brand Equity S 4 Heavily Dependent on U.S. Market; Small W International Presence 5 Growth of PA Industry O 6 27% of Sales come from 2 Distributors W 7 Heavily Dependent on U.S. Market for PA Sales W 8 High Quality Products S 9 Increase in Sports Participation in Emerging O Markets
  • 11.
    Competitive Advantage Low Cost Differentiation Broad Target Moving Here Competitive Scope Narrow Target Started Here • UA is moving from niche to mainstream in an attempt to compete with Nike and Adidas on other product lines (footwear and accessories) other than performance apparel.
  • 12.
    Market Share High Low •Performance Apparel High •Footwear Star Question Mark •Accessories Market Growth Low Cash Cow Dog
  • 13.
    • UA createsvalue for the consumers and gains its competitive advantage against the competition primarily through technology development. • Innovation is what made UA what it is today, and Innovation is the key for future success.
  • 14.
    Primary Activities Weak/Moderate/Strong Under Armour Inbound Logistics Moderate Third Party Operations/Manufacturing Moderate Third Party Outbound Logistics Moderate Third Party Marketing and Sales Moderate Currently, UA has many sponsorships and endorsements but no synergy in marketing plan After-Sale Service Strong UA has great reputation for customer service and after-sale service Support Activities Weak/Moderate/Strong Under Armour Firm Infrastructure Strong UA is structured very well and has great company culture Human Resources Moderate UA is limited by only having Management 3,900 employees but they hire and train very well Technology Development, Very Strong Innovating and producing Engineering technologically advanced products is what UA does Procurement Moderate Third Party
  • 15.
    Component Comment Innovation UA is extremely reliant on producing innovative products that will continue to impress their consumers and hold on to high brand equity and brand loyalty Market Development UA is really focused on selling their products to emerging markets; 90%+ of UA’s products are sold in the U.S. Market Penetration UA would love to improve their market share in the U.S. for PA and improve their footwear and accessories sales as well Product Development UA is devoted to continue to introduce new products to the U.S. and also other emerging markets around the world Research and Development UA plans on continuing to produce new and technologically advanced products which are superior to the competition
  • 16.
    Strategy Products, Market Under Armour Market Penetration Existing Products, Very Strong Existing products Existing Market are high quality and UA holds majority of existing market (U.S.) - Continue increasing U.S. market share Market Development Existing Products, Strong Existing products are New Market high quality but UA needs to increase market share in international and emerging markets Product Development New Products, Very Strong All new products Existing Market are technologically advanced from previous products -U.S. market receives new products extremely well (Loves Innovation) Diversification New Products, Weak Very difficult to New Market introduce new products into new markets without having a decent market share of existing products
  • 17.
    1 = LowestLevel of Effort 4 = Highest Level of Effort Existing Products New Products 2 3 Existing Market Market Penetration Product Development 4 1 New Market Market Development Diversification • UA is focused on all of these strategies but they must prioritize according to what will achieve them the greatest amount of success and what will put them in the best position to grow in the future.
  • 18.
    Domestic Sponsorships/Endorsements Athlete/Team Association/Sport Type of Deal All Teams NFL Official supplier of Footwear Auburn, Boston College, NCAA Official Outfitter Maryland Brandon Jennings NBA Endorsement Lindsey Vonn Skiing Endorsement Tom Brady NFL Endorsement Michael Phelps Swimming Endorsement Hunter Mahan PGA Endorsement Cam Newton NCAA/NFL Endorsement  International Sponsorships/Endorsements Athlete/Team Association/Sport Type of Deal Tottenham Champions League PA and Accessories Provider Hockey Canada National Team Official Outfitter Hanover 96 Bundesliga PA and Accessories Provider All Teams Welsh Rugby Union PA and Accessories Provider
  • 19.
    PA sales and overall sales have increased every year since Under Armour has been founded.  PA sales account for more than 80% of total sales.  International sales account for less than 10% of sales but they have been increasing slightly since 2008.  Under Armour is attempting to make a push into international and emerging markets.  The two main strengths for Under Armour are its core competence in innovation and its brand equity.  UA is moving from niche to mainstream in an attempt to compete with Nike and Adidas on other product lines (footwear and accessories) other than performance apparel.
  • 20.
    Under Armour’s primary focus should be to increase their U.S. market share in other products such as footwear and accessories while maintaining market leadership in PA.  Under Armour should move into international and emerging markets with caution to assure they do not expand too quickly.  Under Armour needs to continue to provide value to consumers through innovation and research and development.  Under Armour needs to integrate their marketing plan and make sure than all sponsorships and endorsements contribute to the value of the brand.