Download to read offline
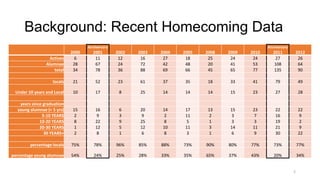
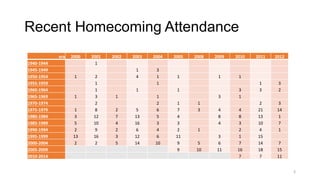
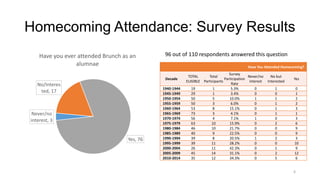
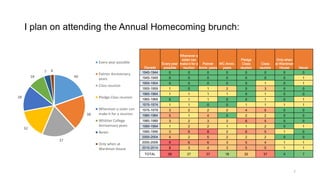
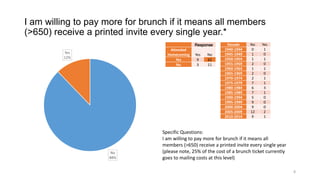
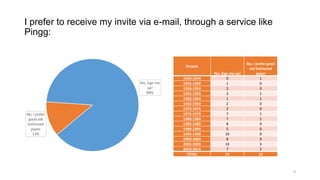
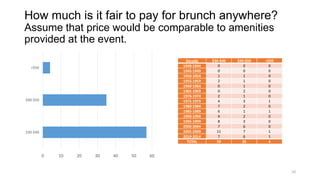
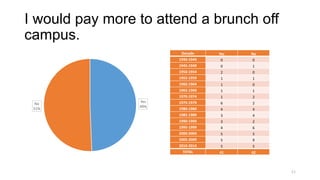
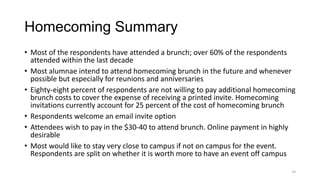

The Palmer Alumnae Leadership Council conducted a needs assessment survey in 2012 regarding homecoming attendance and preferences. The results indicated that a majority of alumnae have attended homecoming in the past decade and show a strong interest in future events, particularly during reunions, while expressing a preference for email invitations over printed ones. Additionally, most respondents are unwilling to pay extra for brunch expenses but indicated a fair price range of $30-40 for attending such events.


