Download to read offline
![O. O. Omotayo et al./ Journal of Soft Computing in Civil Engineering 8-4 (2024) 116-140 117
1. Introduction
One material widely known for its use in construction is concrete. This material has fared
advantageously in construction compared to other materials [1]. This is because of the many
benefits that can be derived from its use, some of which include buildability, ease of
construction, durability, material obtainability, and its lower cost in comparison to steel. It is
therefore an important material widely adopted by professionals in the building construction
sector [2]. Concrete is generally produced when cement is mixed with fine and coarse aggregates
in the presence of water, with the addition of admixtures where and when necessary. One
important indicator for assessing the quality of concrete is its compressive strength. However, the
process of measuring this parameter can be very cumbersome, time consuming and sometimes
inaccurate due to probability of human errors [3,4]. Hence, it is desirable to be able to determine
very quickly and in a relatively accurate manner the compressive strength of concrete.
As a means to achieving this, concrete's compressive strength has been modelled and predicted
by researchers through different methods. This is typically a challenging task, as well, due to the
highly complex nature of concrete and wide variations in concrete compressive strength data
obtained from literature [5]. These variations in compressive strength values can be related to
various causes. Examples of such include the variations in material use, climatic variations,
variations in design mix ratios and material properties, and the volatile nature of compressive
strength test results. Traditionally, mathematical methods such as multiple linear regression
analysis have been adopted in the past [6–9]. However, these methods have not been able to
handle concrete data, which usually has widely varied, inaccurate and incomplete nature. In
recent times, focus has gradually shifted to using artificially intelligent models called machine
learning algorithms which are more robust, efficient and versatile in dealing with incomplete or
sometimes inconsistent data [10,11]. Several researchers in different fields of civil engineering,
in recent times, have taken advantage of the power of machine learning algorithms in prediction,
classification and modelling tasks, such as prediction of landslide susceptibility, discharge
coefficients of hydraulic gates, relative energy dissipation in hydraulic drops, classification of
discontinuous rock slopes, prediction of normal and high performance concrete strength,
prediction of bond strength of corroded bars etc. [12–16].
In spite of the impressive ability of machine learning methods to forecast the expected strength
of concrete, the results are usually varying for different models. Also, the materials constituting
the concrete matrix contribute in varying levels to the expected concrete strength. It is therefore a
matter of interest to be able to contrast the outcomes of various machine-learning techniques in
predicting concrete strength, and to determine to what extent certain materials or other
considerable factors affect concrete compressive strength. This research therefore sought,
utilizing various machine learning techniques, to forecast the compressive strength of concrete,
and to evaluate the different input factors influencing concrete's compressive strength, and to
identify which among these factors have the most prominent effects upon slight variation.
Some researchers have made attempts to use machine learning techniques to forecast the
compressive strength of concrete [17–21]. Four machine learning methods were employed by
Jiang et al. [22] to forecast the compressive strength of fly-ash concrete. The models used were](https://image.slidesharecdn.com/sccevolume8issue4pages116-140-250603082102-023bd7e3/75/Assessment-of-Machine-Learning-Methods-for-Concrete-Compressive-Strength-Prediction-2-2048.jpg)
![118 O. O. Omotayo et al./ Journal of Soft Computing in Civil Engineering 8-4 (2024) 116-140
random forest, support vector regression (SVR), extreme learning machine, and SVR model
optimized hybrid model. Cao et al. [21] made use of Support vector machine (SVM), multilayer
perceptron (MLP), and XGBoost (XGB) algorithms to predict fly ash modified concrete
compressive strength. Ahmad et al. [23] utilized artificial neural network and gene expression
programming to forecast the compressive strength of concrete made from recycled aggregates.
Comparing the effectiveness of the gene expression programming technique and ensemble
random forest approach, a study was done by Farooq et al. [24] to forecast how well high
strength concrete (HSC) would perform in terms of compressive strength. In a study by Pandey
et al. [25], the usage of four machine learning models (decision tree, support vector regression,
multivariable linear regression, and artificial neural network) was attempted in seeking for a
method of mixing concrete alternative to the conventional methods. Results based on the models
showed decision tree as the preferred model for determining the quantity of materials required in
a design mix. Cihan [26] employed decision tree, artificial neural networks, support vector
machine, random forest, bagging, partial least squares, and fuzzy logic algorithms in forecasting
the slump and compressive strength of concrete. According to the study, fuzzy logic fared better
at predicting values than other commonly used regression techniques.
A number of researchers have also worked on the sensitivity analysis of factors affecting
concrete compressive strength. Thus, the water-cement ratio was found by Nikoo et al. [27] to be
the most sensitive factor impacting concrete strength when forecasting the compression strength
of concrete utilizing evolutionary neural networks. Chen et al. [28] performed sensitivity
analysis, by means of support vector machine (SVM), based on a method by Liong et al. [29] to
assess the factors affecting the compressive strength of concrete exposed to attack by sulfates.
The research showed that exposure time, sulfate content, and w/c ratio were the most significant
factors affecting the compressive strength prediction. Ly et al. [30] used a Gaussian Process
Regression for evaluating factors influencing how high performance concrete strength is
predicted. Cement content and age were the top-ranked positively influencing parameters, while
the water-content was identified as the most prominent negative contributor to concrete strength.
Huynh et al. [31] using a deep residual neural network (Res-Net) assessed the parameters
affecting the compressive strength prediction of geopolymer-based concrete. Noticeable factors
that offer significant contribution to concrete strength based on the outcomes of the research
include fly ash/aggregate ratio, age of curing, levels of NaOH and temperature of curing, in that
order. Table 1 presents a list of machine learning methods that have been applied in concrete
strength prediction and their merits and demerits.
In previous studies, most models have been trained on datasets having a relative average of 200-
500 data points. In this study, however, a larger number of datasets than the previous literature
studies (a total of 1760) have been used for better model outputs. An attempt has also been made
to evaluate the comparative efficiency of boosted trees, especially the recently developed
CatBoost algorithm, as against conventional regression models in predicting concrete
compressive strength. Furthermore, the sensitivity of concrete compressive strength to specific
parameters was examined in comparison with results from previous literature studies. In the
following sections, the information on the data, an explanation of the working principle of the
models used, the methodology adopted in this study, the results obtained are presented and
discussed, as well as relevant conclusions.](https://image.slidesharecdn.com/sccevolume8issue4pages116-140-250603082102-023bd7e3/75/Assessment-of-Machine-Learning-Methods-for-Concrete-Compressive-Strength-Prediction-3-2048.jpg)
![O. O. Omotayo et al./ Journal of Soft Computing in Civil Engineering 8-4 (2024) 116-140 119
Table 1
Machine learning methods applied in concrete strength prediction.
S/N Ref. ML Algorithms Dataset
Predicted
Property
Observations Limitations
1 [17]
Gene Expression Programming
(GEP), Artificial Neural Network
(ANN), Decision Trees (DT)
98
Concrete
compressive
strength
Bagging
algorithm had
high accuracy
Experimental
dataset was
primarily used
2 [18]
Artificial Neural Network (ANN),
Support Vector Machine (SVM),
124
Recycled
aggregate
concrete
compressive
strength
SVM performed
best
Focus was on
RAC only using
experimental
data
3 [19]
Artificial Neural Network (ANN),
Support Vector Machine (SVM),
Adaptive Boosting (Adaboost)
1030
Concrete
compressive
strength
Adaptive
boosting
algorithm
enhanced the
overall accuracy
Adaboost was
the only boosted
tree algorithm
examined
4 [20]
Artificial Neural Network (ANN),
Genetic Programming (GP)
147
Concrete
compressive
strength with
and without
fly-ash
ANN performed
better than GP
Boosted tree
algorithms were
not considered
5 [21]
Support Vector Machine (SVM),
Multilayer Perceptron (MLP),
XGBoost (XGB)
151
Geopolymer
concrete
compressive
strength
XGB gave better
predictions
Focus was on
geopolymer
concrete based
on fly ash
6 [22]
Extreme Learning Machine, Random
forest, Support Vector Regression
(SVR), SVR optimized with grid
search algorithm
270
Fly ash
concrete
strength
Optimized
hybrid model
gave better
predictions
Boosted tree
algorithms were
not considered
7 [23]
Gene expression programming
(GEP), Artificial Neural Network
(ANN)
344
Recycled
coarse
aggregate
concrete
compressive
strength
GEP model
showed better
performance
compared to
ANN
Focus was on
RCA concrete
and on two ML
algorithms
8 [24]
Ensemble Random Forest (RF), Gene
Expression Programming (GEP),
Decision Trees (DT), Artificial
Neural Network (ANN)
357
Compressive
strength of
High
strength
concrete
(HSC)
Random forest
Focus was on
HSC and use of
four ML
algorithms
9 [25]
Multi-variable linear regression,
Support Vector regression (SVR),
Decision Tree Regression (DTR) and
Artificial Neural Network (ANN)
800
Water,
Cement,
Sand, Coarse
aggreagate
and
Plasticizer
Decision tree
model was
preferred to
other models
evaluated
Four models
were used,
boosted trees
were not
considered
10 [26]
Decision Tree, Random Forest,
support vector machine, partial least
squares, artificial neural networks,
bootstrap aggregation (bagging),
Fuzzy Logic and K-nearest
neighbours
Compressive
strength and
slump of
normal
concrete
Fuzzy logic
method gave
better
predictions
Boosted trees
were not
considered](https://image.slidesharecdn.com/sccevolume8issue4pages116-140-250603082102-023bd7e3/75/Assessment-of-Machine-Learning-Methods-for-Concrete-Compressive-Strength-Prediction-4-2048.jpg)
![120 O. O. Omotayo et al./ Journal of Soft Computing in Civil Engineering 8-4 (2024) 116-140
2. Research methodology
2.1 Data information
A total of 1760 data points were gathered from literature on concrete compressive strength as
presented in Table 2, with the input features being water-binder ratio, cement, water content, fine
aggregate, superplasticizer, coarse aggregate, pozzolan content and curing age, while the
compressive strength was the output parameter.
Table 2
Dataset gathered from literature and their sources.
S/N Source No. of Dataset
1. Nwofor & Eme (2016) [32] 18
2. Chopra et al. (2015) [33] 147
3. Chopra et al. (2016) [34] 81
4. Yeh (2007) [35] 103
5. Meddah et al. (2010) [36] 16
6. Janković et al. (2011) [37] 45
7. Lee (2003) [38] 12
8. Unamba et al. (2021) [39] 12
9. Chiemela et al. (2014) [40] 20
10. Arundas & Dewangan (2016) [41] 10
11. Samui (2013) [42] 144
12. Zheng & Liu (2020) [43] 46
13. Ghazal et al. (2021) [44] 5
14. Eneowaji & Ucheowaji (2021) [45] 33
15. Ozioko & Mbadike (2016) [46] 12
16. Osei et al. (2019) [47] 18
17. Bu et al. (2021) [48] 8
18. Yeh (1998) [49] 1030
Total 1760
2.2 Machine learning algorithms
In forecasting the compressive strength of concrete in this research, six machine learning
methods were used. These include gradient boost (GB), categorical boost (CatBoost), decision
trees (DT), random forest (RF), support vector machine (SVM), and linear regression.
Linear regression
One of the most well-known and established machine learning modelling methods is the simple
or multiple linear regression technique. In this technique, the line delineating the link between a
number of independent variables (x) and a dependent variable (y) is represented by Equation (1)
or (2):
𝑦 = 𝑎 + 𝑏𝑥 + 𝑒 (1)
𝑦 = 𝑎 + 𝑏1𝑥1 + 𝑏2𝑥2 + ⋯ + 𝑏𝑛𝑥𝑛 + 𝑒 (2)](https://image.slidesharecdn.com/sccevolume8issue4pages116-140-250603082102-023bd7e3/75/Assessment-of-Machine-Learning-Methods-for-Concrete-Compressive-Strength-Prediction-5-2048.jpg)
![O. O. Omotayo et al./ Journal of Soft Computing in Civil Engineering 8-4 (2024) 116-140 121
where the target dependent variable is represented by y, the independent input variables are
represented by x1,x2, x3, …, xn, the intercept is represented by a, and b represents the slope of the
line, e being the standard error. Equation (1) can be employed in determining the value of a target
based on a single independent variable, while Equation (2) is useful in prediction of a target
variable based on several independent variables.
Support vector machine
Cortes and Vapnik [50] created the learning algorithm known as the Support Vector Machine,
and applicable to both regression and classification tasks. Support Vector Regression (SVR)
seeks to locate a linear regression formula that fits to all observations and minimizes the overall
variance of the observations from the regression hyperplane [51]. Using a non-linear mapping
function, a set of input data (x) is converted into a high-dimensional feature space by the
algorithm. Then a linear model is created in this linear space based on Equation (3) [52]:
g(x, w) = ∑ wkφ(xi) + b
m
k=1 (3)
where wk represents the adjustable model weights and the bias term is b. One measure for
determining the accuracy of an SVR model is the (linear)-insensitive loss function L(x, y, w)
defined in Equation (4) and the quadratic (ε)-insensitivity loss function defined by Vapnik [53] in
Equation (5) as:
𝐿𝜀(𝑥, 𝑦, 𝑔) = |𝑦 − 𝑔(𝑥)|𝜀 = {
0
|𝑦 − 𝑔(𝑥)| − 𝜀
𝑖𝑓|𝑦 − 𝑔(𝑥)| ≤ 𝜀
𝑜𝑡ℎ𝑒𝑟𝑤𝑖𝑠𝑒
(4)
𝐿(𝑦, 𝑔(𝑥, 𝑤)) = |𝑦 − 𝑔(𝑥)|𝜀
2
𝐿2
𝜀 (𝑥, 𝑦, 𝑔) = |𝑦 − 𝑔(𝑥)|𝜀
2
(5)
where g represents a real-valued function on x, and the loss function L(y, g(x,w)) determines the
model accuracy. For linear regression problems, using the (ε)-insensitivity loss function, an
attempt is made by SVM to minimize ‖𝜔‖2
. (Non-negative) slack variables represented by
𝜉𝑖, 𝜉𝑖
∗
, 𝑖 = 1, 2, … , 𝑛 are introduced to determine how far away the training data is from the ε-
zone. The SVR model is thus minimized based on Equations (6) [54]:
1
2
‖𝜔‖2
+ 𝑐 ∑(𝜉𝑖 + 𝜉𝑖
∗
)
𝑛
𝑖=1
subject to {
𝑦𝑖 − [𝜔 ∙ 𝜑(𝑥𝑖) + 𝑏] ≤ 𝜀 + 𝜉𝑖
𝜔 ∙ 𝜑(𝑥𝑖) + 𝑏 − 𝑦𝑖 ≤ 𝜀 + 𝜉𝑖
∗
,
𝜉𝑖, 𝜉𝑖
∗
≥ 0
𝑖 = 1, 2, … , 𝑛
(6)
By applying a Lagrange multiplier to turn this optimization problem into a dual problem, it can
be resolved as given in Equation (7):](https://image.slidesharecdn.com/sccevolume8issue4pages116-140-250603082102-023bd7e3/75/Assessment-of-Machine-Learning-Methods-for-Concrete-Compressive-Strength-Prediction-6-2048.jpg)
![122 O. O. Omotayo et al./ Journal of Soft Computing in Civil Engineering 8-4 (2024) 116-140
𝑀𝑎𝑥𝑖𝑚𝑖𝑠𝑒 𝑅(𝛼𝑖, 𝛼𝑖
∗)
= −
1
2
∑ ∑(𝛼𝑖 − 𝛼𝑖
∗)
𝑁
𝑗=1
(𝛼𝑗 − 𝛼𝑗
∗
)𝐾(𝑥𝑖, 𝑥𝑗)
𝑁
𝑖=1
− 𝜀 ∑(𝛼𝑖 + 𝛼𝑖
∗) +
𝑁
𝑖=1
∑ 𝑦𝑖(𝛼𝑖 − 𝛼𝑖
∗)
𝑁
𝑖=1
subject to ∑(𝛼𝑖 − 𝛼𝑖
∗) = 0; 0 ≤
𝑁
𝑖=1
𝛼𝑖, 𝛼𝑖
∗
≤ 𝐶
(7)
where 𝛼𝑖, 𝛼𝑖
∗
and K(𝑥𝑖, 𝑥𝑗) represent the Lagrange multipliers, with K(𝑥𝑖, 𝑥𝑗) standing for the
kernel function. The most often utilized kernel functions are sigmoid, radial basis, and linear
functions.
Decision trees
In a decision tree (DT), regression or classification models are described using a tree diagram
[55]. It is known as a DT because of its structure, which resembles a tree in that it begins at the
root node and grows in proportion to the number of branches [56]. A decision tree has leaf nodes,
branches and a root node. A characteristic or feature is represented by the root node, decision
rules are represented by the branches, and the results are represented by the leaf nodes [57]. In
the DT, the data samples are divided into several segments. The difference between the desired
and the predicted values at each point of division is calculated by the algorithm being used. At
every point of division, The fitness function having the variable with the lowest value is chosen
as a split point, errors are identified, and the procedure is then repeated. [56]. Figure 1 shows an
illustration of a decision tree [58].
Fig. 1. Diagrammatic illustration of a Decision tree [58].](https://image.slidesharecdn.com/sccevolume8issue4pages116-140-250603082102-023bd7e3/75/Assessment-of-Machine-Learning-Methods-for-Concrete-Compressive-Strength-Prediction-7-2048.jpg)
![O. O. Omotayo et al./ Journal of Soft Computing in Civil Engineering 8-4 (2024) 116-140 123
Random forest
This method is generally considered an improved method of classification and regression. This
approach offers more speed and adaptability when establishing the link between the input and
output functions [24]. It is a method that tries to decrease the volatility of single trees by building
a collection of several regression trees. Two strategies are employed by RF to address the
instability problem. Using the idea of bootstrap aggregation (otherwise known as Bagging), first,
it creates numerous datasets that are comparable to the original dataset but were sampled from
different parts of it. Each of these datasets results in a distinct tree inside the ensemble. Then, in
order to reduce the level of correlation between ensembles’ individual trees, randomization is
incorporated in the tree learning phase [59]. In contrast to straightforward regression trees,
random forests have the drawback of being more difficult to perceive and analyze. Furthermore,
they tend to overfit training data. One crucial technique for preventing this issue is error pruning
[60]. The plots of variable importance can also show how important the predictor variables are
relative to one another [59].
Gradient Boost (GB)
The Gradient boosting method is an ensemble method deployed as an improvement on the
decision tree technique. While decision trees may be regarded as weak learners, Gradient
boosting creates a single strong learner by fusing a number of weak learners [61]. The idea
behind this technique is to construct first base trees having single nodes. Then, subsequent trees
are built based on the errors of the preceding trees. Employing a specified learning rate, a scaling
process is done for the trees, and successive trees are combined with the previous trees in order
to forecast the output. Repetition of this cycle continues until the greatest number of trees is
arrived at, or there is no further improvement in the resulting response [62]. Based on this idea,
the predictive action of weak learner models can be summarized by Equation (8), where each
successive model fm+1(x) is created based on the fm(x) of the previous learning model in addition
to a new weak learner hm(x) [63].
𝑓𝑚+1(𝑥) = 𝑓𝑚(𝑥) + ℎ𝑚(𝑥), 𝑚 𝜖 [1, 𝑀] (8)
where x represents the vector having input features, and m represents the number of iterations.
hm(x) can be represented mathematically by Equation (9).
ℎ𝑚(𝑥) = 𝑦 − 𝑓𝑚(𝑥) (9)
where y represents the target output.
Categorical Gradient Boost (CatBoost)
CatBoost is an enhanced gradient boosting technique proposed to handle biases, target leakage
and prediction shift issues involved in standard gradient boosting [64,65]. It was proposed by
Dorogush et al. [66] as a means of dealing with categorical features in gradient boosting during
training as against before training. Using a tree-splitting procedure and integrating one hot](https://image.slidesharecdn.com/sccevolume8issue4pages116-140-250603082102-023bd7e3/75/Assessment-of-Machine-Learning-Methods-for-Concrete-Compressive-Strength-Prediction-8-2048.jpg)
![124 O. O. Omotayo et al./ Journal of Soft Computing in Civil Engineering 8-4 (2024) 116-140
encoding, categorical features are altered into numeric features with a number of incidences. In
the case of composite features, the mean target is swapped with the classes. In order to avoid
overfitting, this technique supports a configurable boosting arrangement determined by the
ordering principle functional to the categorical features [67].
2.3 Machine learning models and training process
The collected data were fed into built machine learning models, namely linear regression (LR),
random forest (RF), decision trees (DT), Gradient Boost (GB), support vector machine (SVM),
and Categorical Gradient Boost (CatBoost). Input variables in the model were key factors
contributing to concrete compressive strength, including cement, water-binder ratio, fine and
coarse aggregate proportion, pozzolan composition, and curing age, while the compressive
strength was taken as output variable. The collected data were cleaned first by dropping the null
values. This reduced the number of records in the dataset to 1703. Since the focus of the research
dealt specifically with prediction of the compressive strength of ordinary Portland cement (OPC)
concrete, data points in which supplementary cementitious materials (or pozzolans) were used
were dropped, leaving a total number of 526 data points. These data points were then used in
training the models. The dataset was split into 70% for training, 15% for validation and 15% for
testing.
During training, the dataset's input variables are taken in by the nodes of the input layer, from
where they are transmitted to the output layer via a transitory hidden layer. Weights are given to
each node to adjust the influence of the input data and reduce the difference between the
observed and desired outputs. Grid search algorithm was used and the results compared to those
of the default hyperparameters of the models, this aided the selection of the best learning
parameters. During testing, the remaining data are fed into the trained model and checked for
errors. The parameters employed to assess the model’s effectiveness include mean absolute error
(MAE), mean squared error (MSE), root mean squared error (RMSE), and coefficient of
determination (R2
) represented by Equations (10) to (13). Low results of RMSE, MSE and MAE
and R2
values close to 1 indicate good performance of the models.
𝑀𝑆𝐸 =
1
𝑛
∑ (𝑡 − 𝑦)2
𝑛
𝑖=1 (10)
𝑅𝑀𝑆𝐸 = √
1
𝑛
∑ (𝑡 − 𝑦)2
𝑛
𝑖=1 (11)
𝑀𝐴𝐸 =
1
𝑛
∑ (𝑡 − 𝑦)
𝑛
𝑖=1 (12)
𝑅2
=
(∑ (𝑡−𝑡̅)(𝑦−𝑦
̅)
𝑛
𝑖=1 )
2
∑ (𝑡−𝑡̅)2
𝑛
𝑖=1 ∑ (𝑦−𝑦
̅)2
𝑛
𝑖=1
(13)
where y represents the predicted value, t represents the experimental value, 𝑦
̅ denotes the average
of y, 𝑡̅ denotes the average of t.](https://image.slidesharecdn.com/sccevolume8issue4pages116-140-250603082102-023bd7e3/75/Assessment-of-Machine-Learning-Methods-for-Concrete-Compressive-Strength-Prediction-9-2048.jpg)
![O. O. Omotayo et al./ Journal of Soft Computing in Civil Engineering 8-4 (2024) 116-140 125
2.4 Sensitivity analysis
A sensitivity assessment was conducted to assess the effect of the input features on the
compression strength of concrete utilizing the machine learning models. It helps to determine to
what degree the compressive strength is varied upon variation of a certain input feature. The
approach adopted is called input perturbation, which examines the impact of varying one input
feature on the compressive strength of concrete while maintaining other features at their means.
The purpose of this was to assist in determining which factors should be taken into account the
most when preparing the concrete design mixes. The approach adopted from [21] can be
mathematically represented in Equations (14) and (15) thus:
𝑁𝑖 = 𝑓
𝑚𝑎𝑥(𝑥𝑖) − 𝑓𝑚𝑖𝑛(𝑥𝑖) (14)
𝑆𝑖 =
𝑁𝑖
∑ 𝑁𝑗
𝑛
𝑗−𝑖
(15)
where 𝑓𝑚𝑎𝑥
(𝑥𝑖) and 𝑓𝑚𝑖𝑛
(𝑥𝑖) represent the highest and least values of the ith
input respectively,
while keeping other input features fixed at their average values. Si represents the sensitivity value
for the selected feature.
3. Results and discussion
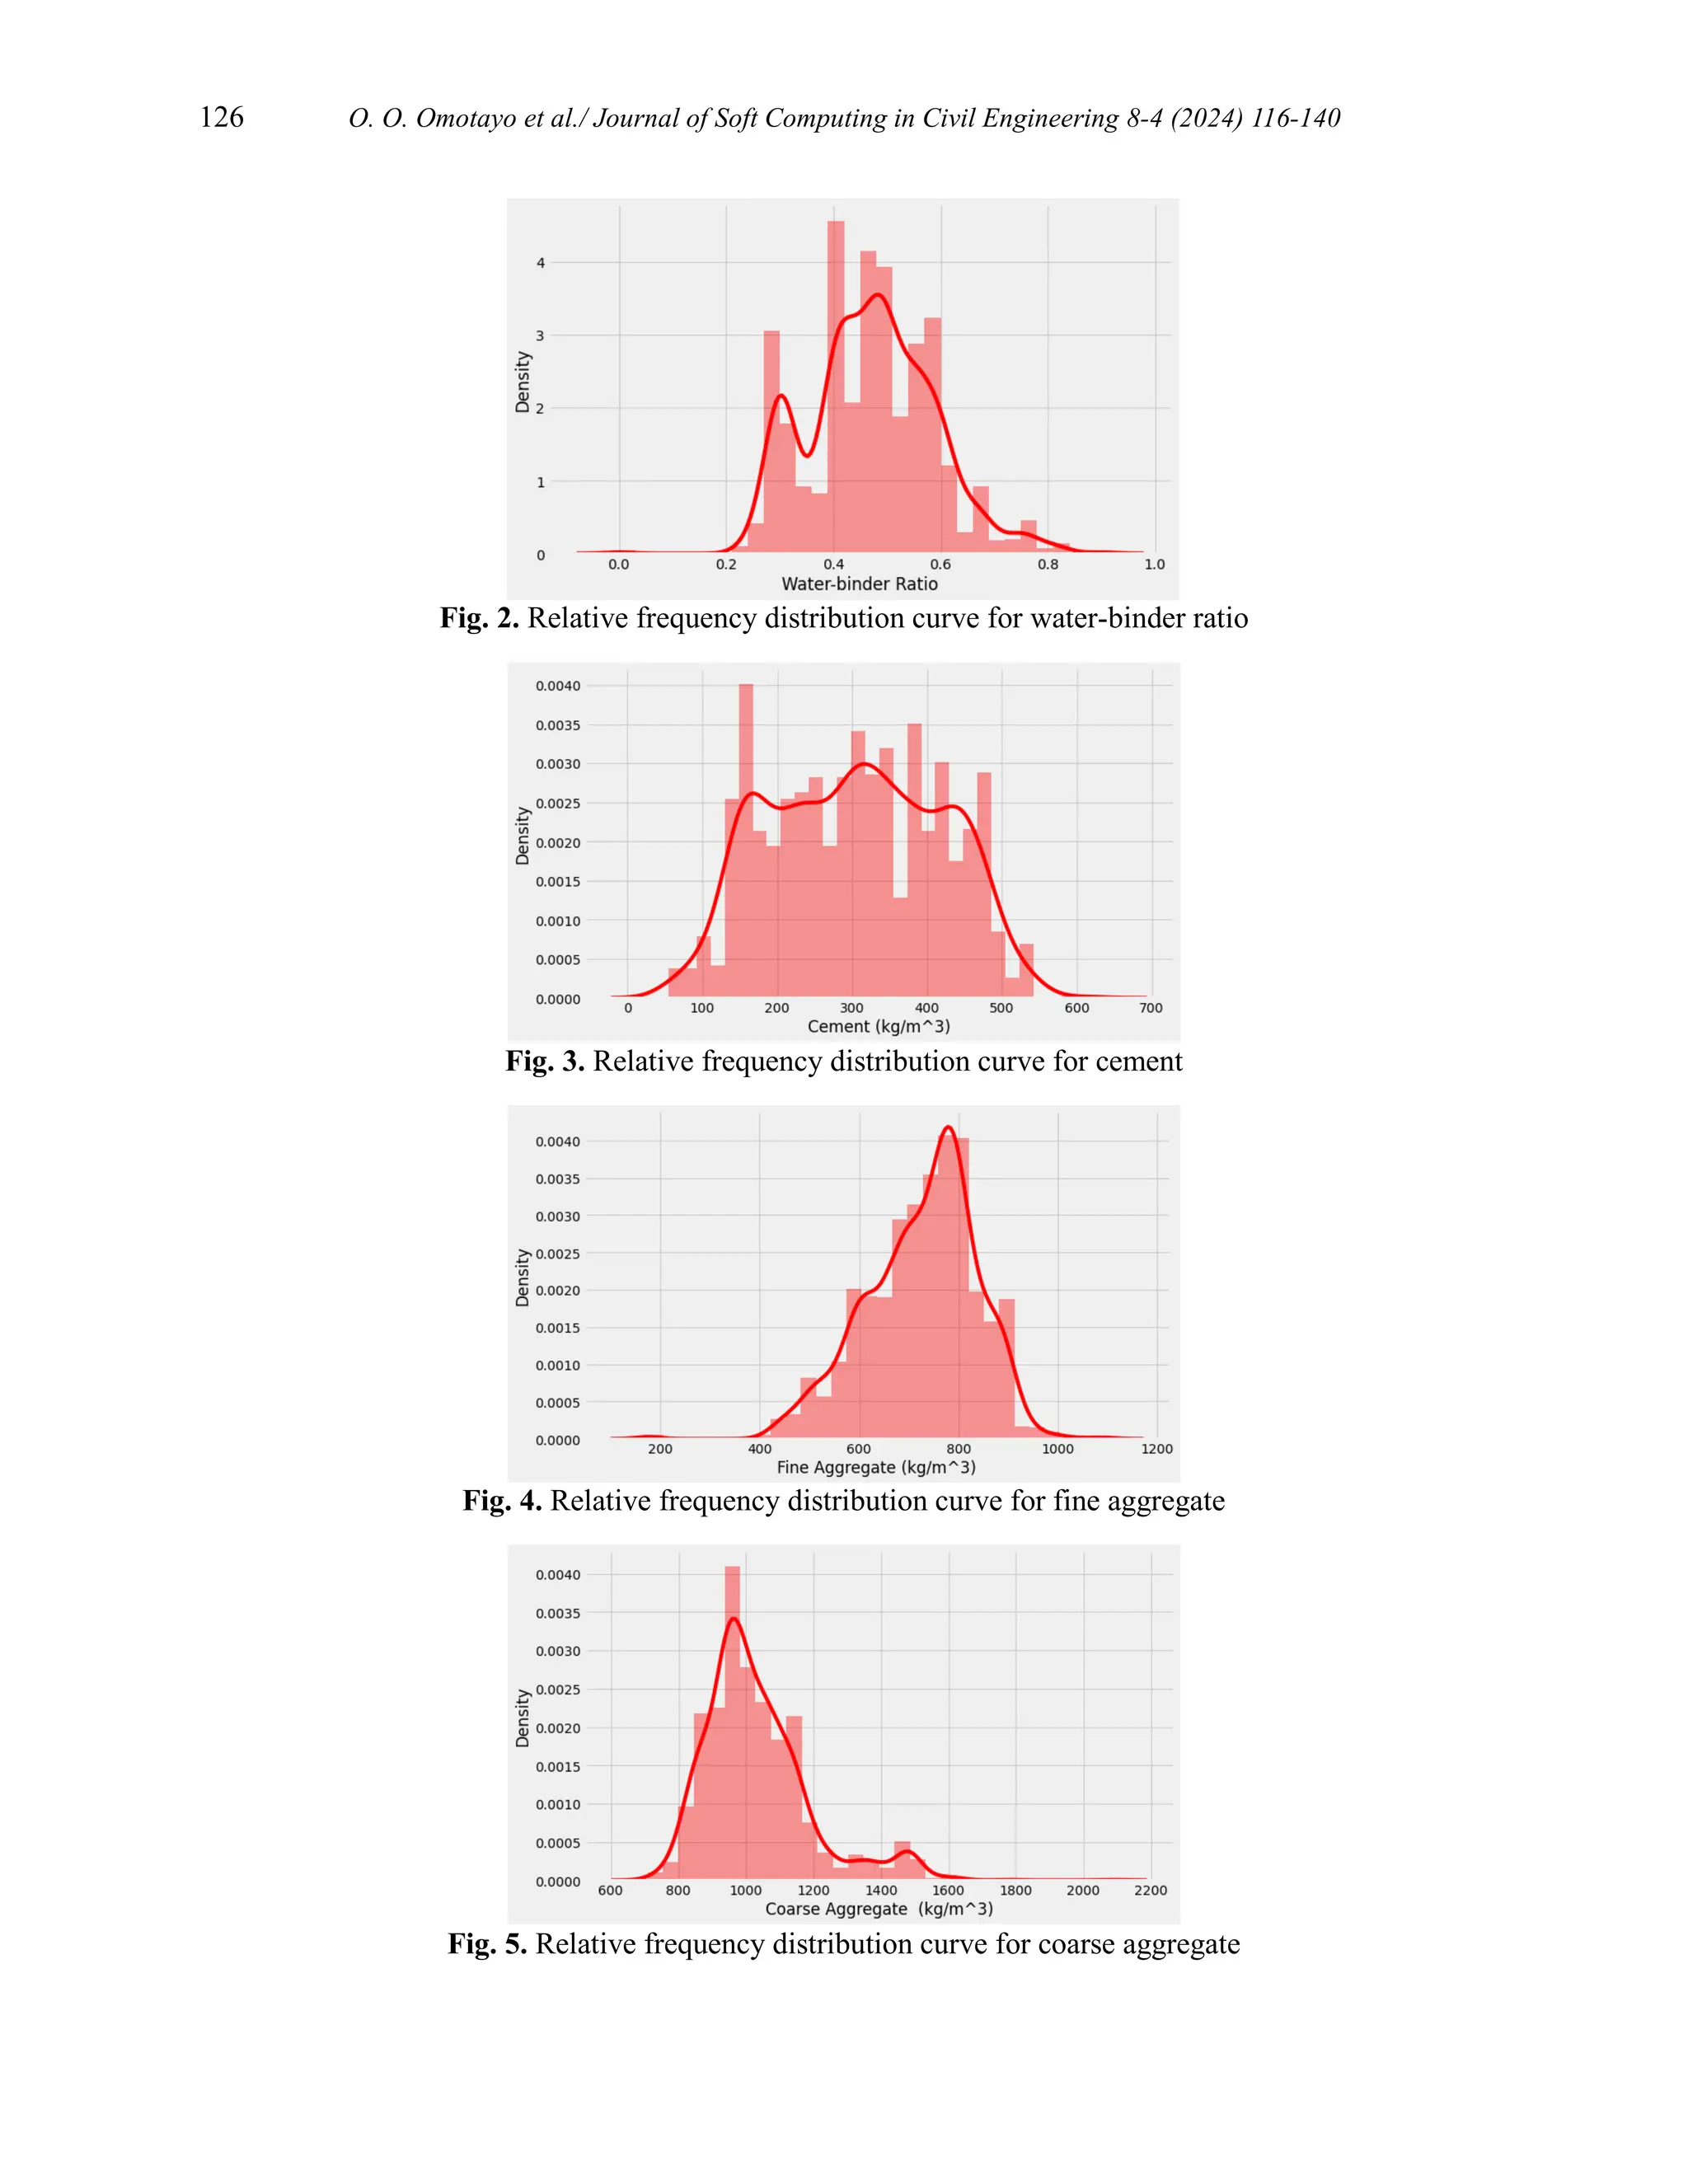
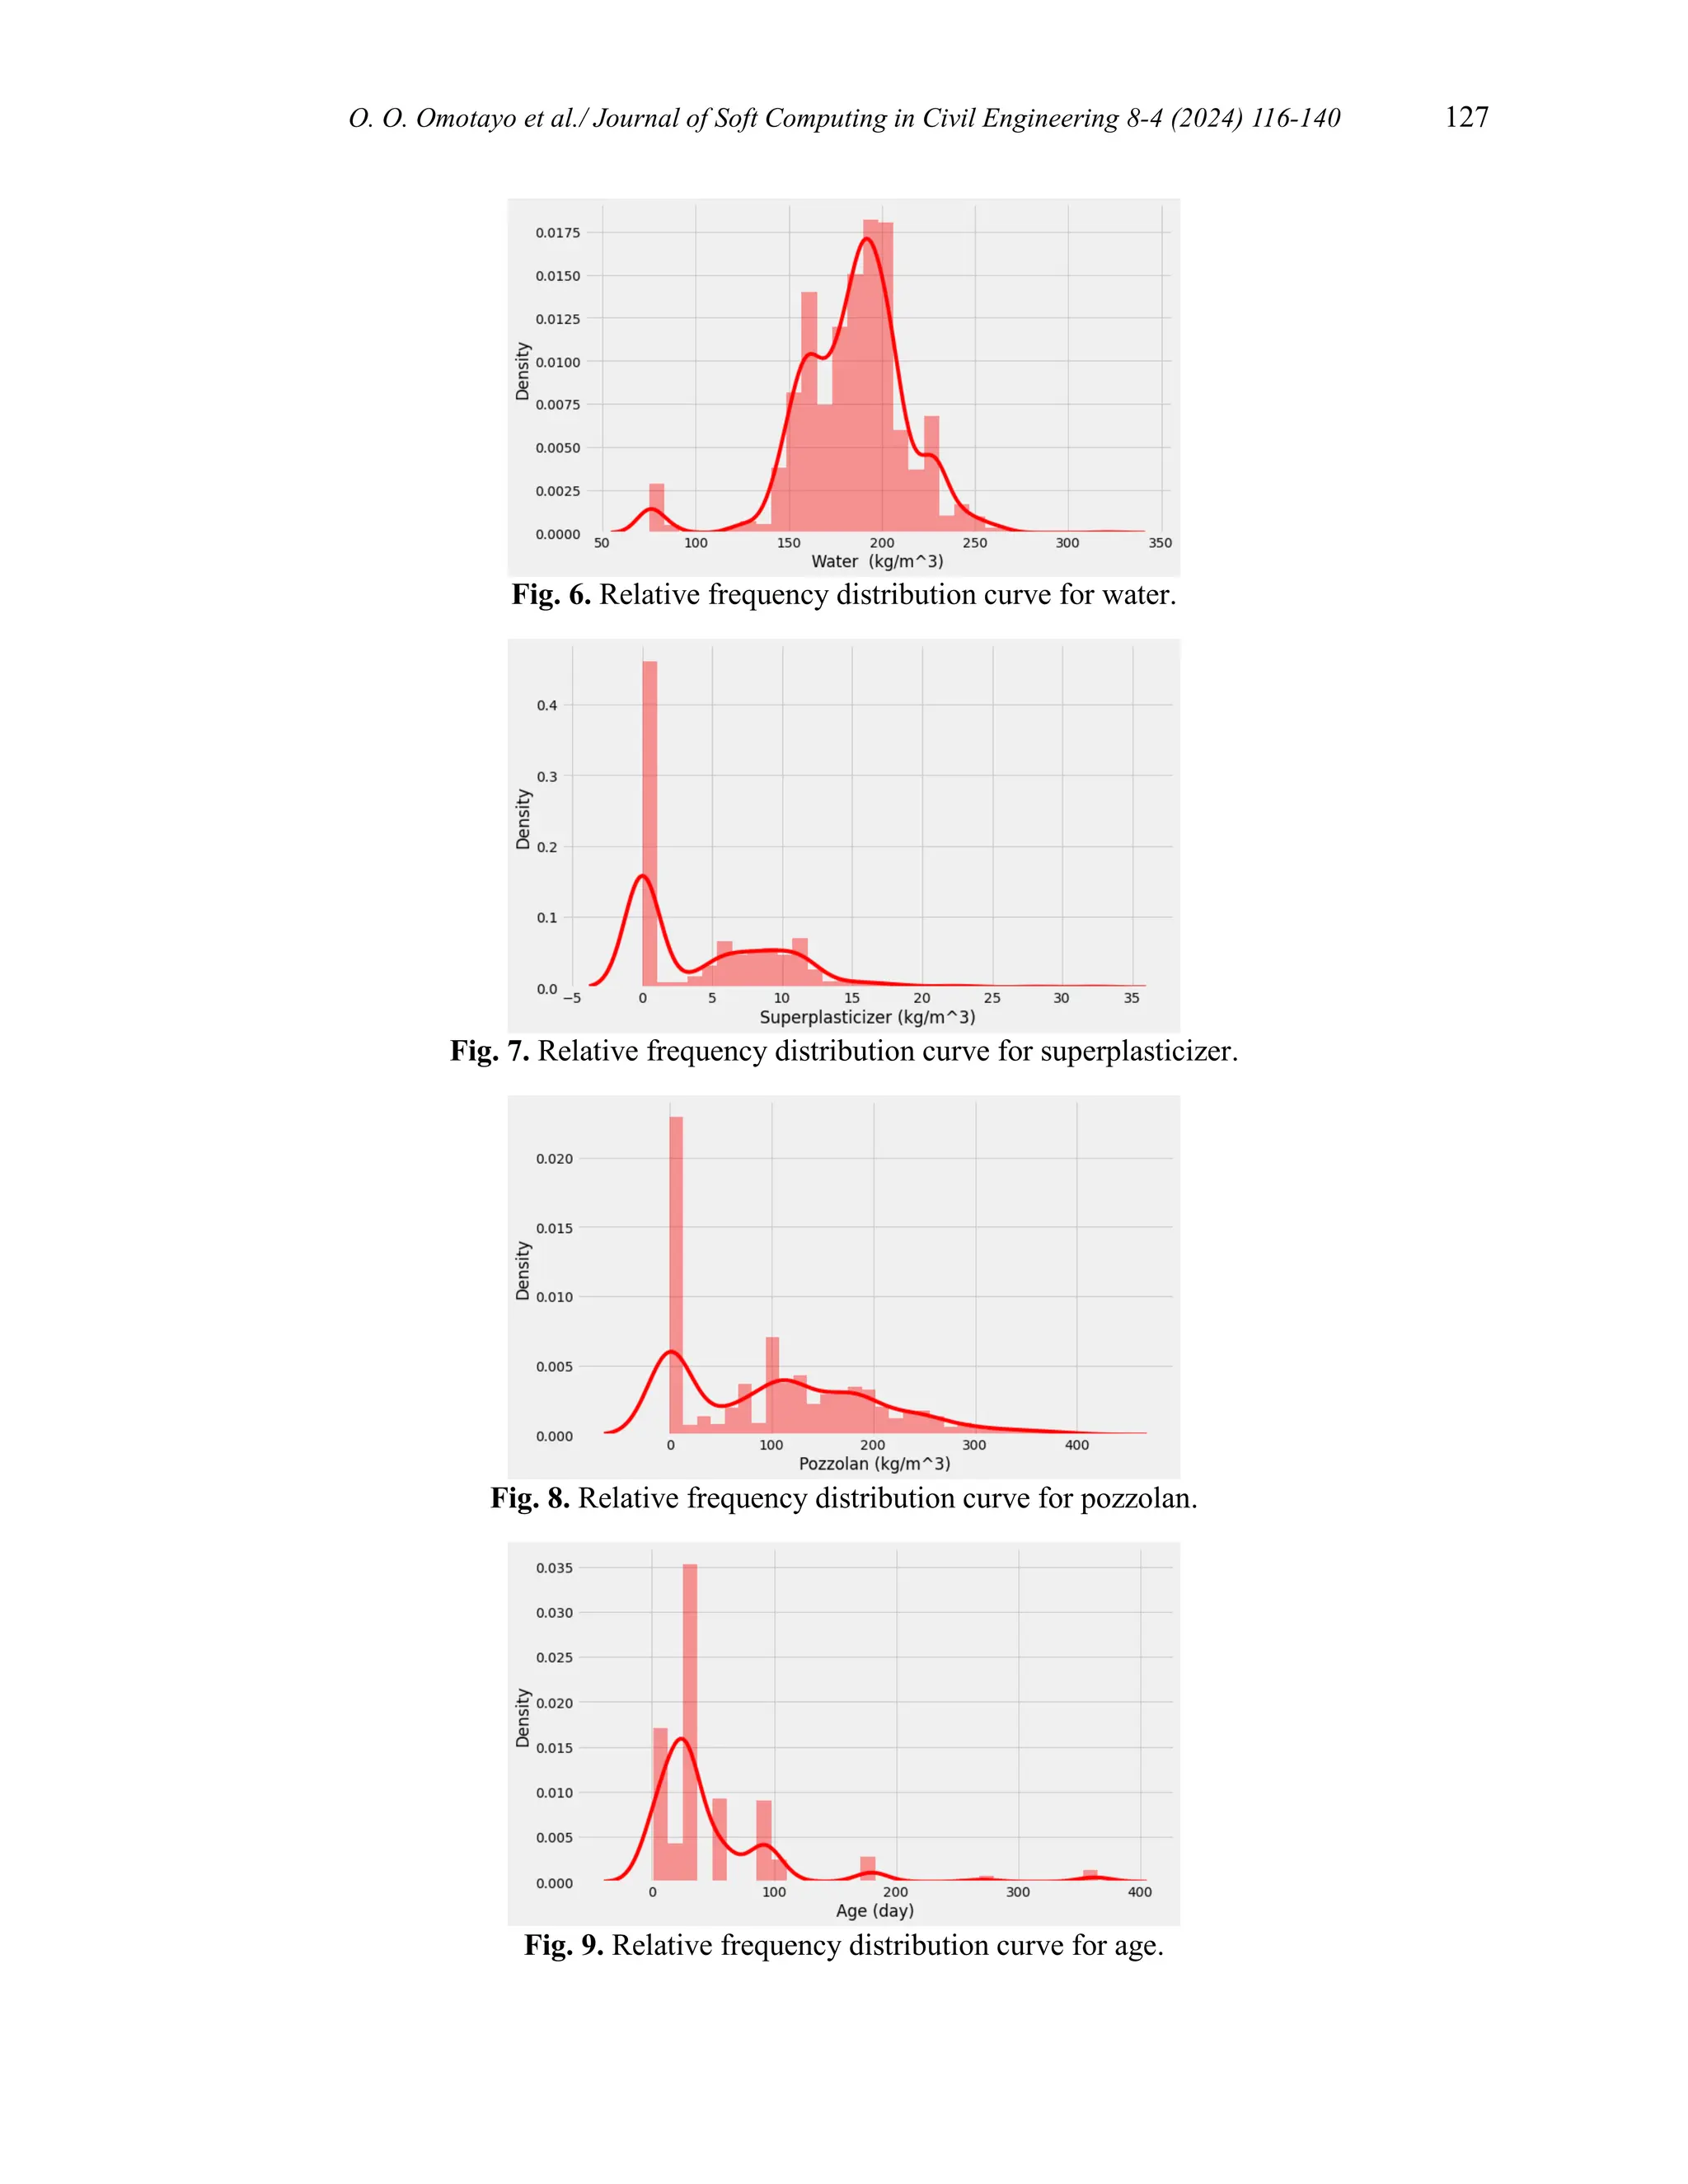
3.1. Descriptive analysis of input features
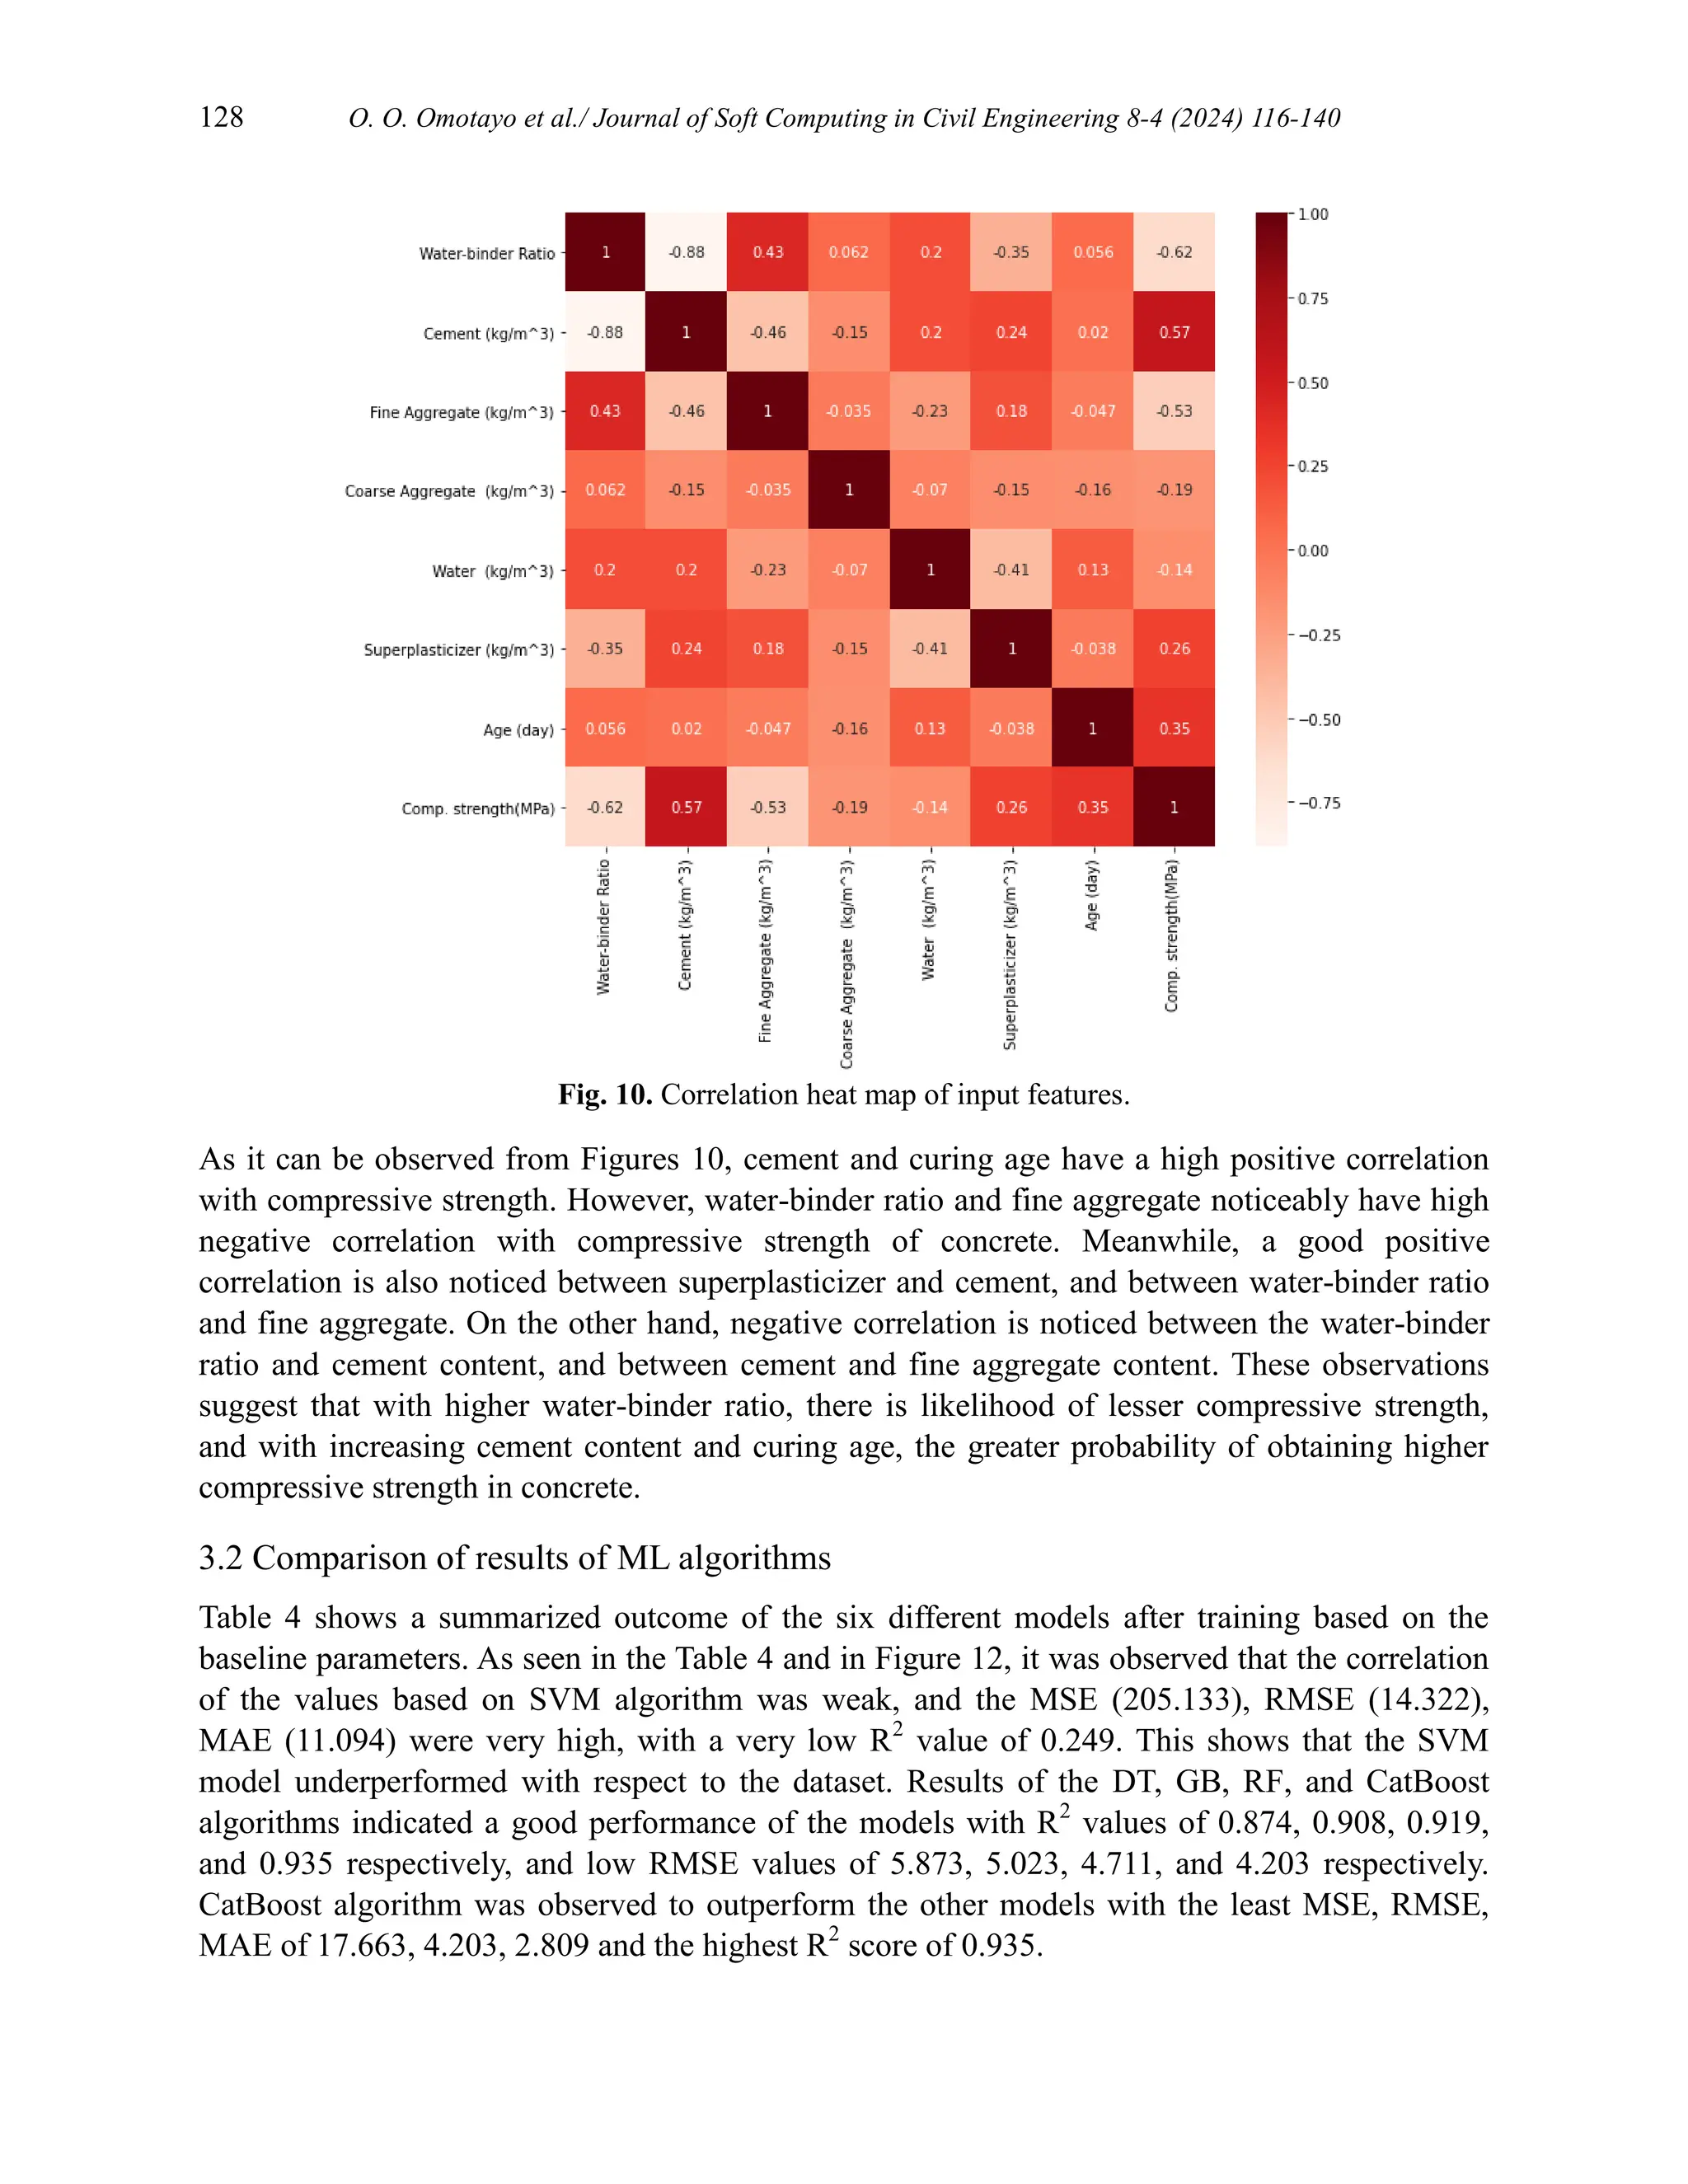
A descriptive analysis of the collected data is summarized in Table 3. Figures 2 to 9 show the
relative frequency distribution curves of the input features. Figure 10 represents the Pearson
correlation between the input features showing how a particular feature affects other features.
Table 3
Description of input features.
Parameter Mean Standard Deviation Minimum Maximum
Input Variable
Water-binder ratio 0.47 0.12 0.24 0.9
Cement (kg/m3
) 307.29 113 213.72 616.96
Fine Agg. (kg/m3
) 725.64 111.26 655 1096.3
Coarse Agg. (kg/m3
) 1035.51 161.82 935.4 2080.2
Water (kg/m3
) 183.46 30.28 164.77 320.82
Superplasticizer (kg/m3
) 4.61 5.51 0 32.2
Pozzolan (kg/m3
) 103.35 95.58 0 404.0
Age (days) 46.97 58.56 1 365
Compressive Strength (MPa) 38.51 17.61 25.13 107.8](https://image.slidesharecdn.com/sccevolume8issue4pages116-140-250603082102-023bd7e3/75/Assessment-of-Machine-Learning-Methods-for-Concrete-Compressive-Strength-Prediction-10-2048.jpg)
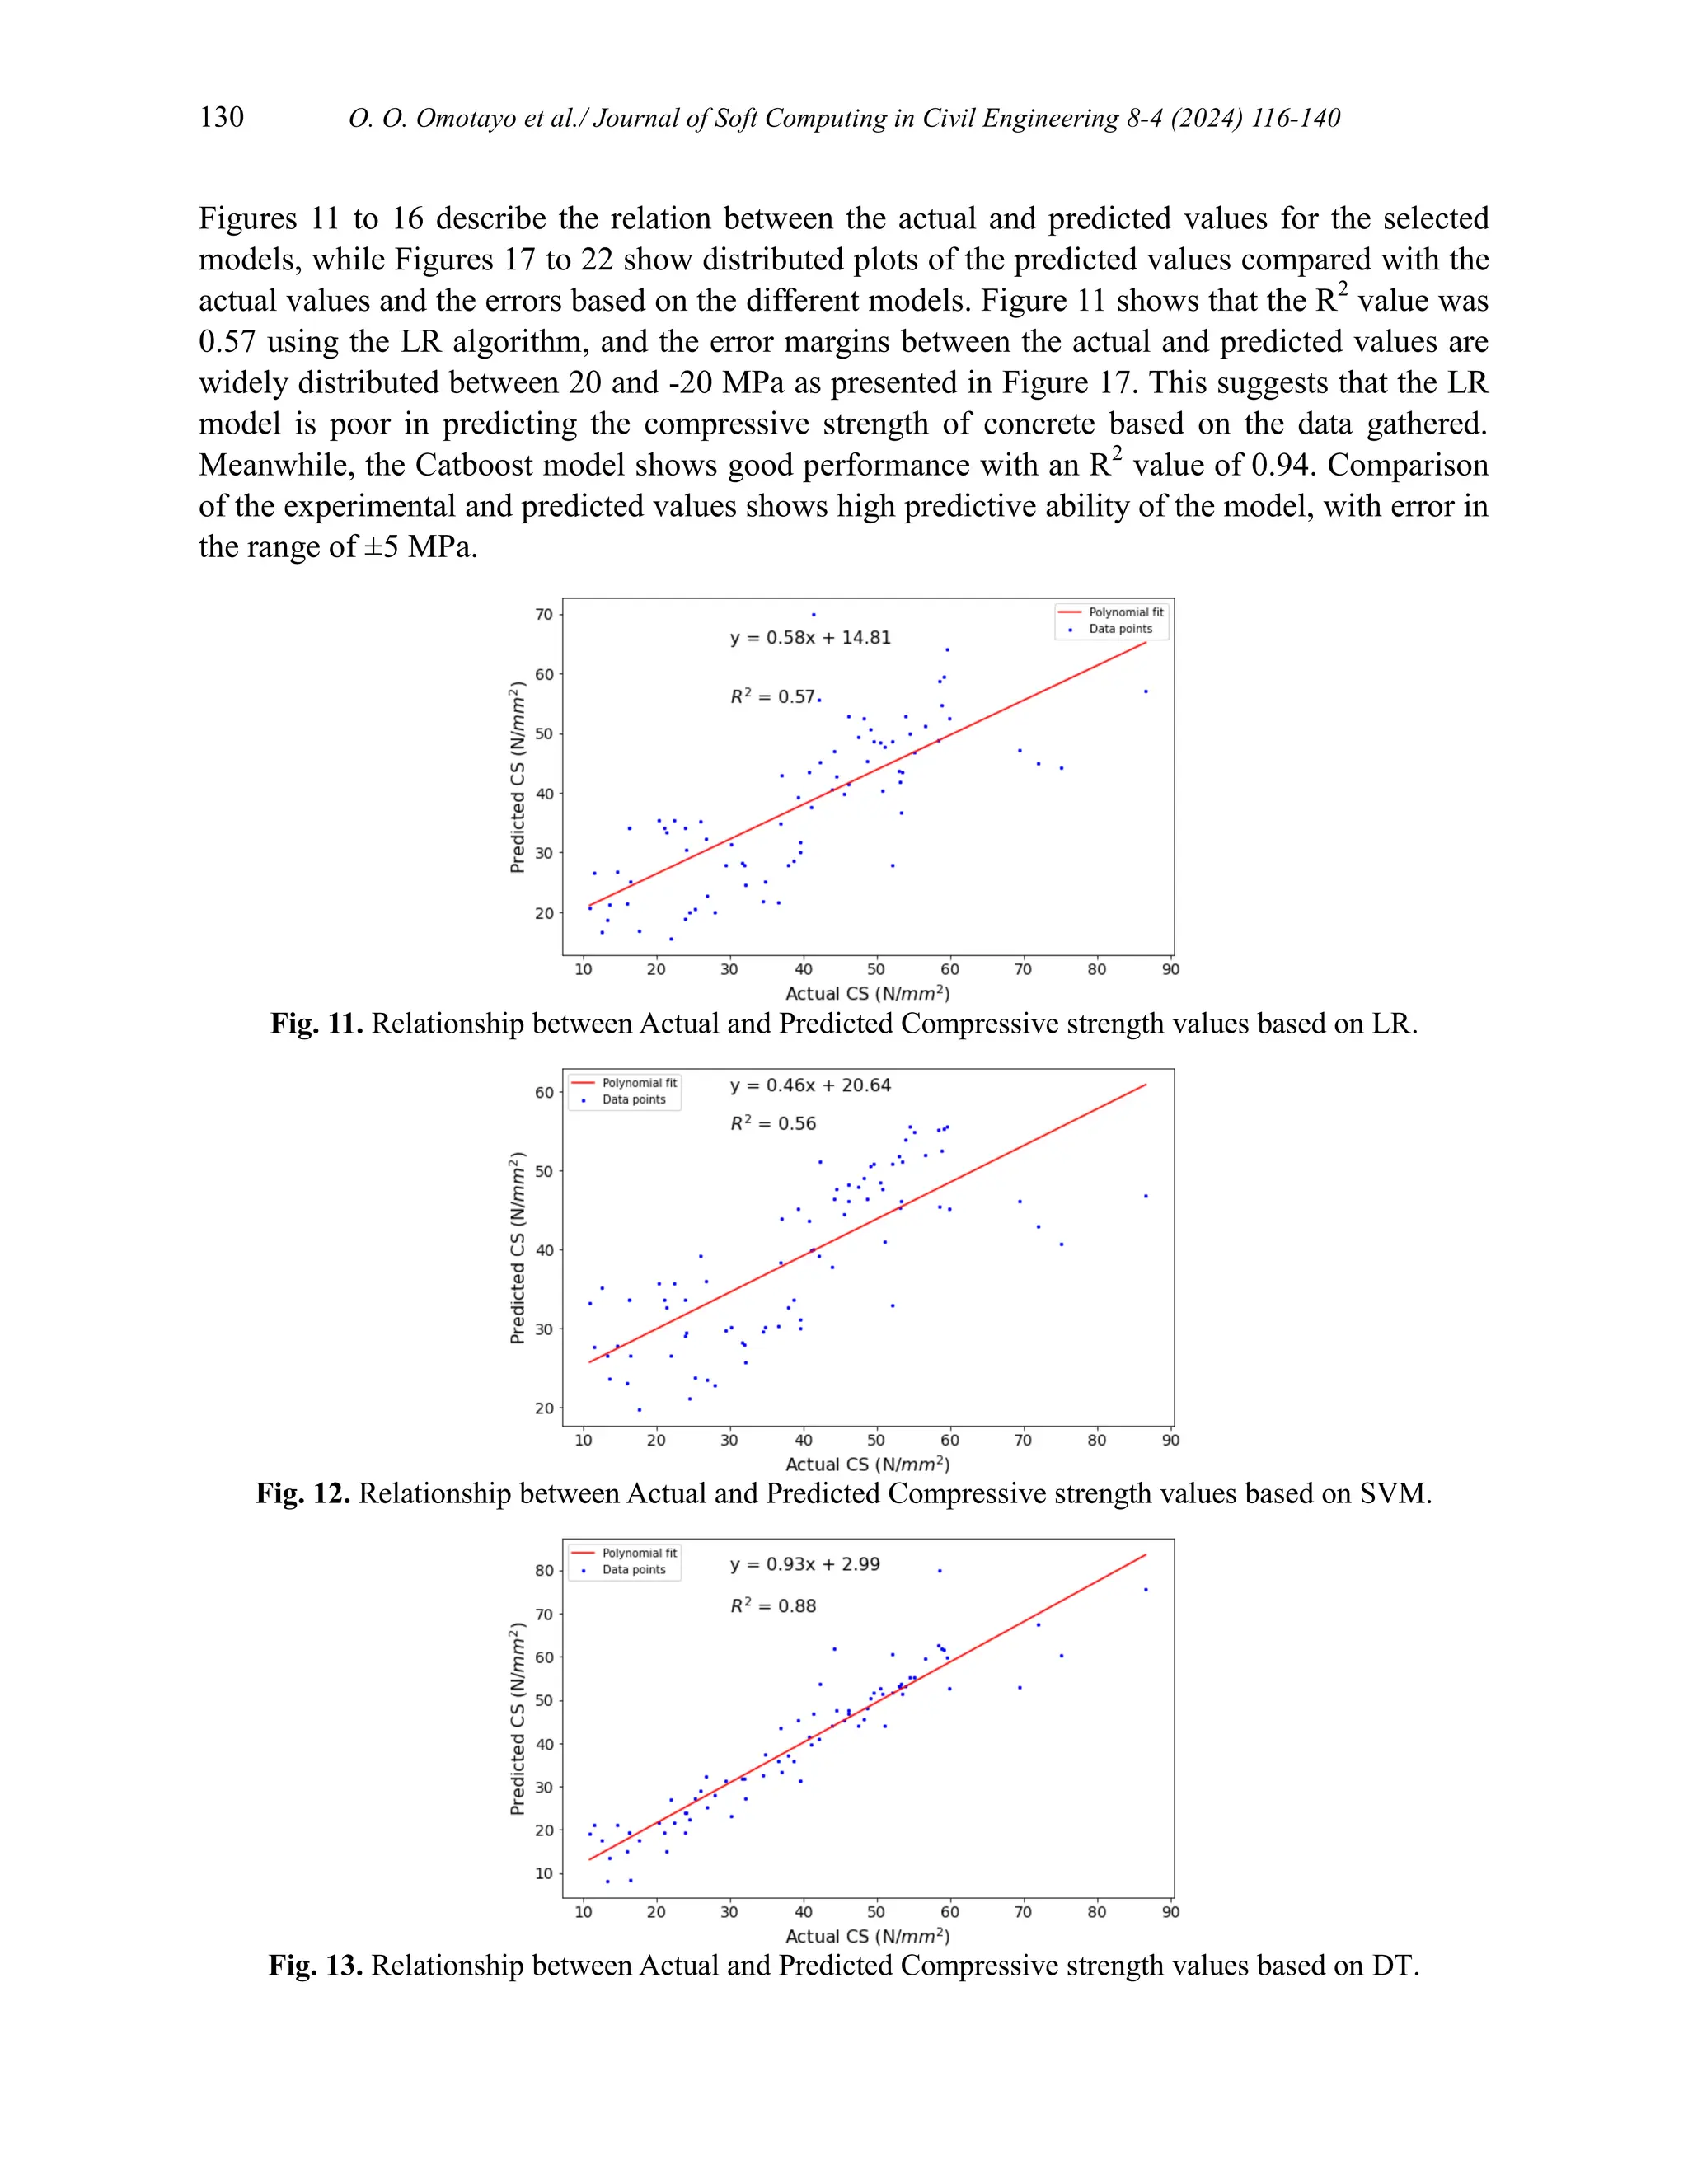
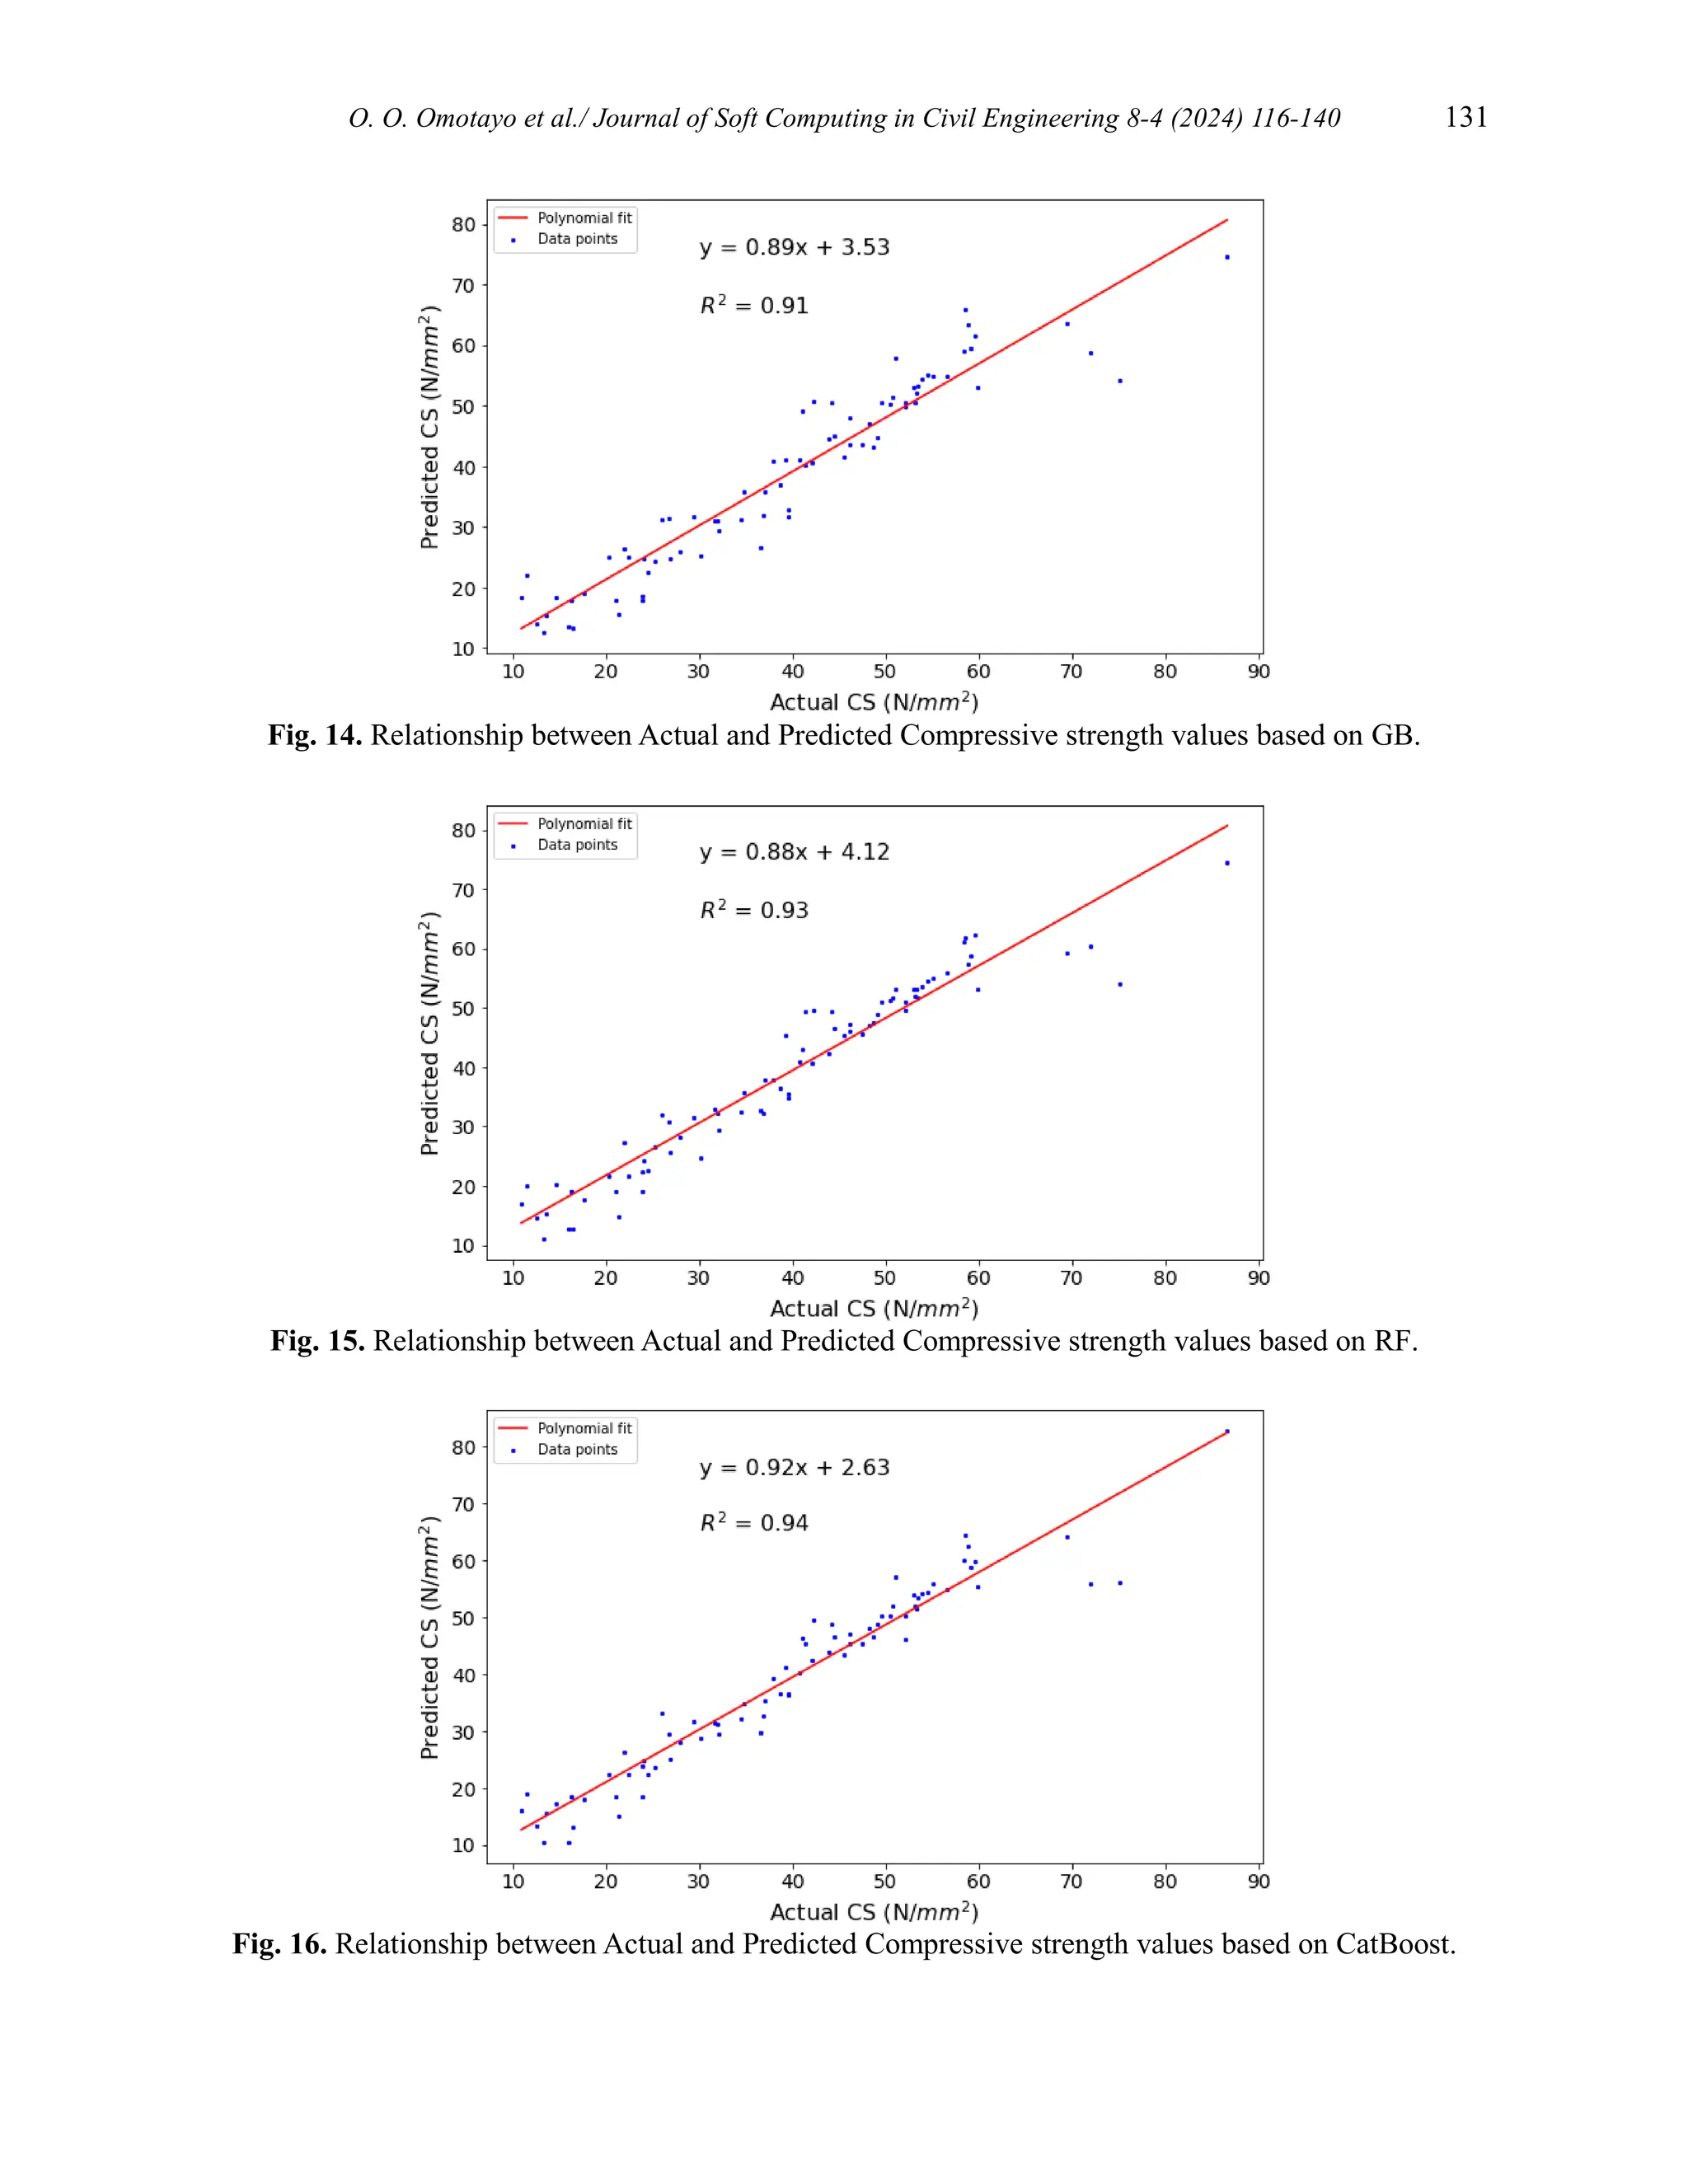
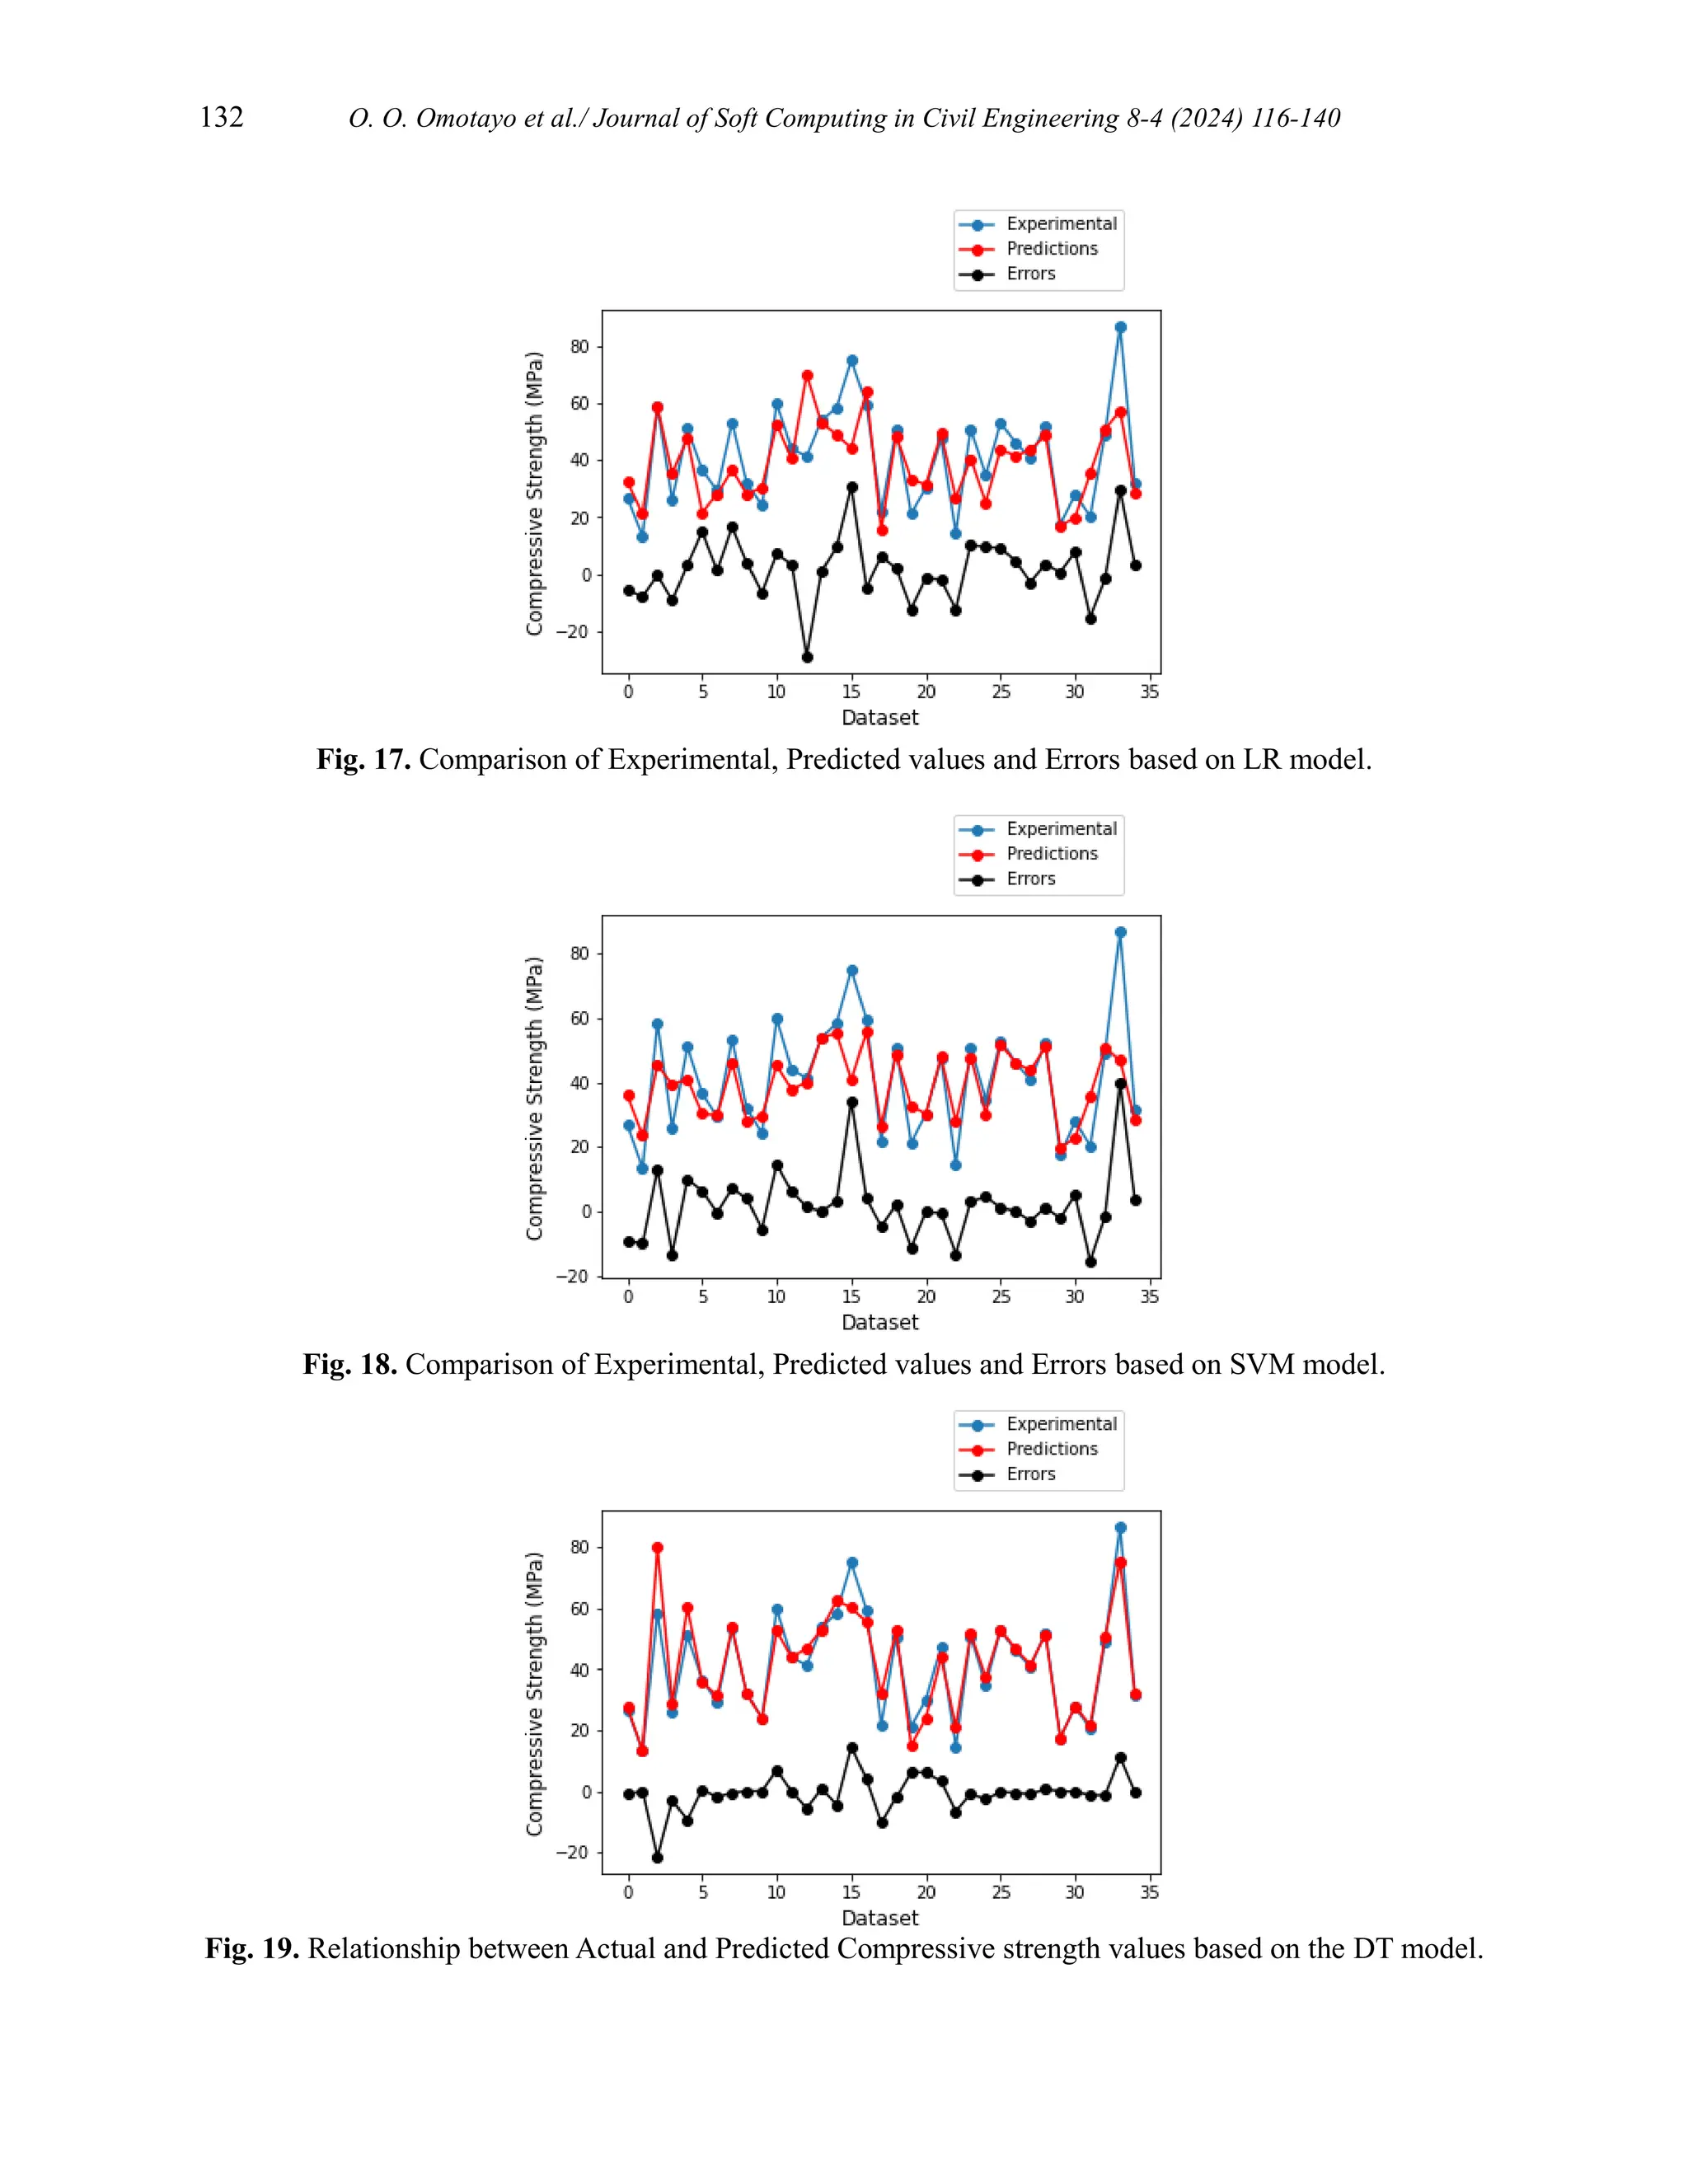
![O. O. Omotayo et al./ Journal of Soft Computing in Civil Engineering 8-4 (2024) 116-140 129
Table 4
Performance Evaluation of the Six Models using Baseline parameters.
Model Training Results Model Test Results
Models
Train
accuracy
Test
accuracy
MSE RMSE MAE R2 Train
accuracy
Test
accuracy
MSE RMSE MAE R2
Support
Vector
Machine
0.323 0.369 177.371 13.318 10.982 0.369 0.323 0.249 205.133 14.322 11.094 0.249
Linear
Regression
0.676 0.664 94.394 9.716 7.755 0.664 0.676 0.571 117.271 10.829 8.298 0.571
Decision
Trees
0.996 0.913 24.344 4.934 3.623 0.913 0.996 0.874 34.489 5.873 3.918 0.874
Random
forest
0.985 0.942 16.198 4.025 2.709 0.942 0.985 0.919 22.196 4.711 3.045 0.919
Gradient
Boost
0.976 0.944 15.708 3.963 3.230 0.944 0.976 0.908 25.235 5.023 3.574 0.908
CatBoost 0.992 0.963 10.483 3.238 2.281 0.963 0.992 0.935 17.663 4.203 2.809 0.935
In order to avoid subjectivity or uncertainty and ensure reliable performance of the models, some
improvement methods were examined including scaling all features using Standard scaler,
scaling selected features, feature engineering and sensitivity analysis. With the inclusion of two
engineered features, concrete mix (a sum of cement, fine aggregate, coarse aggregate and water)
and weighted cement aggregate mix (a sum of weighted cement, aggregates, and water), the
models were re-trained. Scaling the input features showed considerable improvement in the
performance of the models especially for SVM model which had an improved R2
score from
0.249 to 0.558, MAE reduced from 11.094 to 7.687, MSE reduced from 205.133 to 120.654 and
RMSE from 14.322 to 10.984. This is seen in Table 5. It was also observed that there was no
significant improvement in the performance of LR, GB, RF and CatBoost compared to the
baseline models. Feature engineering did not also improve the performance of the models. The
SVM model rather showed lower performance with R2
decreased from 0.558 to 0.151, and MSE,
RMSE and MAE increased from 120.654 to 231.960, 10.984 to 11.495 and 7.687 to 11.495
respectively. These results suggest that the results obtained from the models are accurate and
reliable, with CatBoost showing the best performance with an R2
value of 0.935, MSE of 17.663,
RMSE of 4.203, and MAE of 2.809. Results from studies by [65,68,69] show similar trends.
Table 5
Performance of Models after Scaling (using Standard Scaler).
Model Training Results Model Test Results
Models
Train
accuracy
Test
accuracy
MSE RMSE MAE R2 Train
accuracy
Test
accuracy
MSE RMSE MAE R2
Support
Vector
Machine
0.635 0.664 94.385 9.715 7.003 0.664 0.635 0.558 120.654 10.984 7.687 0.558
Linear
Regression
0.676 0.664 94.394 9.716 7.755 0.664 0.676 0.571 117.271 10.829 8.298 0.571
Decision
Trees
0.996 0.917 23.192 4.816 3.563 0.917 0.996 0.875 34.019 5.833 3.964 0.875
Random
forest
0.986 0.942 16.235 4.029 2.651 0.942 0.984 0.915 23.211 4.818 3.117 0.915
Gradient
Boost
0.976 0.944 15.714 3.964 3.232 0.944 0.976 0.906 25.582 5.058 3.588 0.906
CatBoost 0.992 0.963 10.483 3.238 2.281 0.963 0.992 0.935 17.663 4.203 2.809 0.935](https://image.slidesharecdn.com/sccevolume8issue4pages116-140-250603082102-023bd7e3/75/Assessment-of-Machine-Learning-Methods-for-Concrete-Compressive-Strength-Prediction-14-2048.jpg)
![134 O. O. Omotayo et al./ Journal of Soft Computing in Civil Engineering 8-4 (2024) 116-140
The summary of the important model hyperparameters are presented in Table 6.
Table 6
Hyperparameters used in training the models.
Model Hyperparameter
Linear Regression: fit_intercept: True
normalize: False
Support Vector Machine (SVM): C: 1.0
kernel: rbf
Decision Trees: criterion: mse
max_depth: None
min_samples_split: 2
Gradient Boost: learning_rate: 0.1
n_estimators: 100
max_depth: 3
Random Forest: n_estimators: 100
max_features: auto
min_samples_split: 2
Cat Boost: loss_function: RMSE
verbose: False
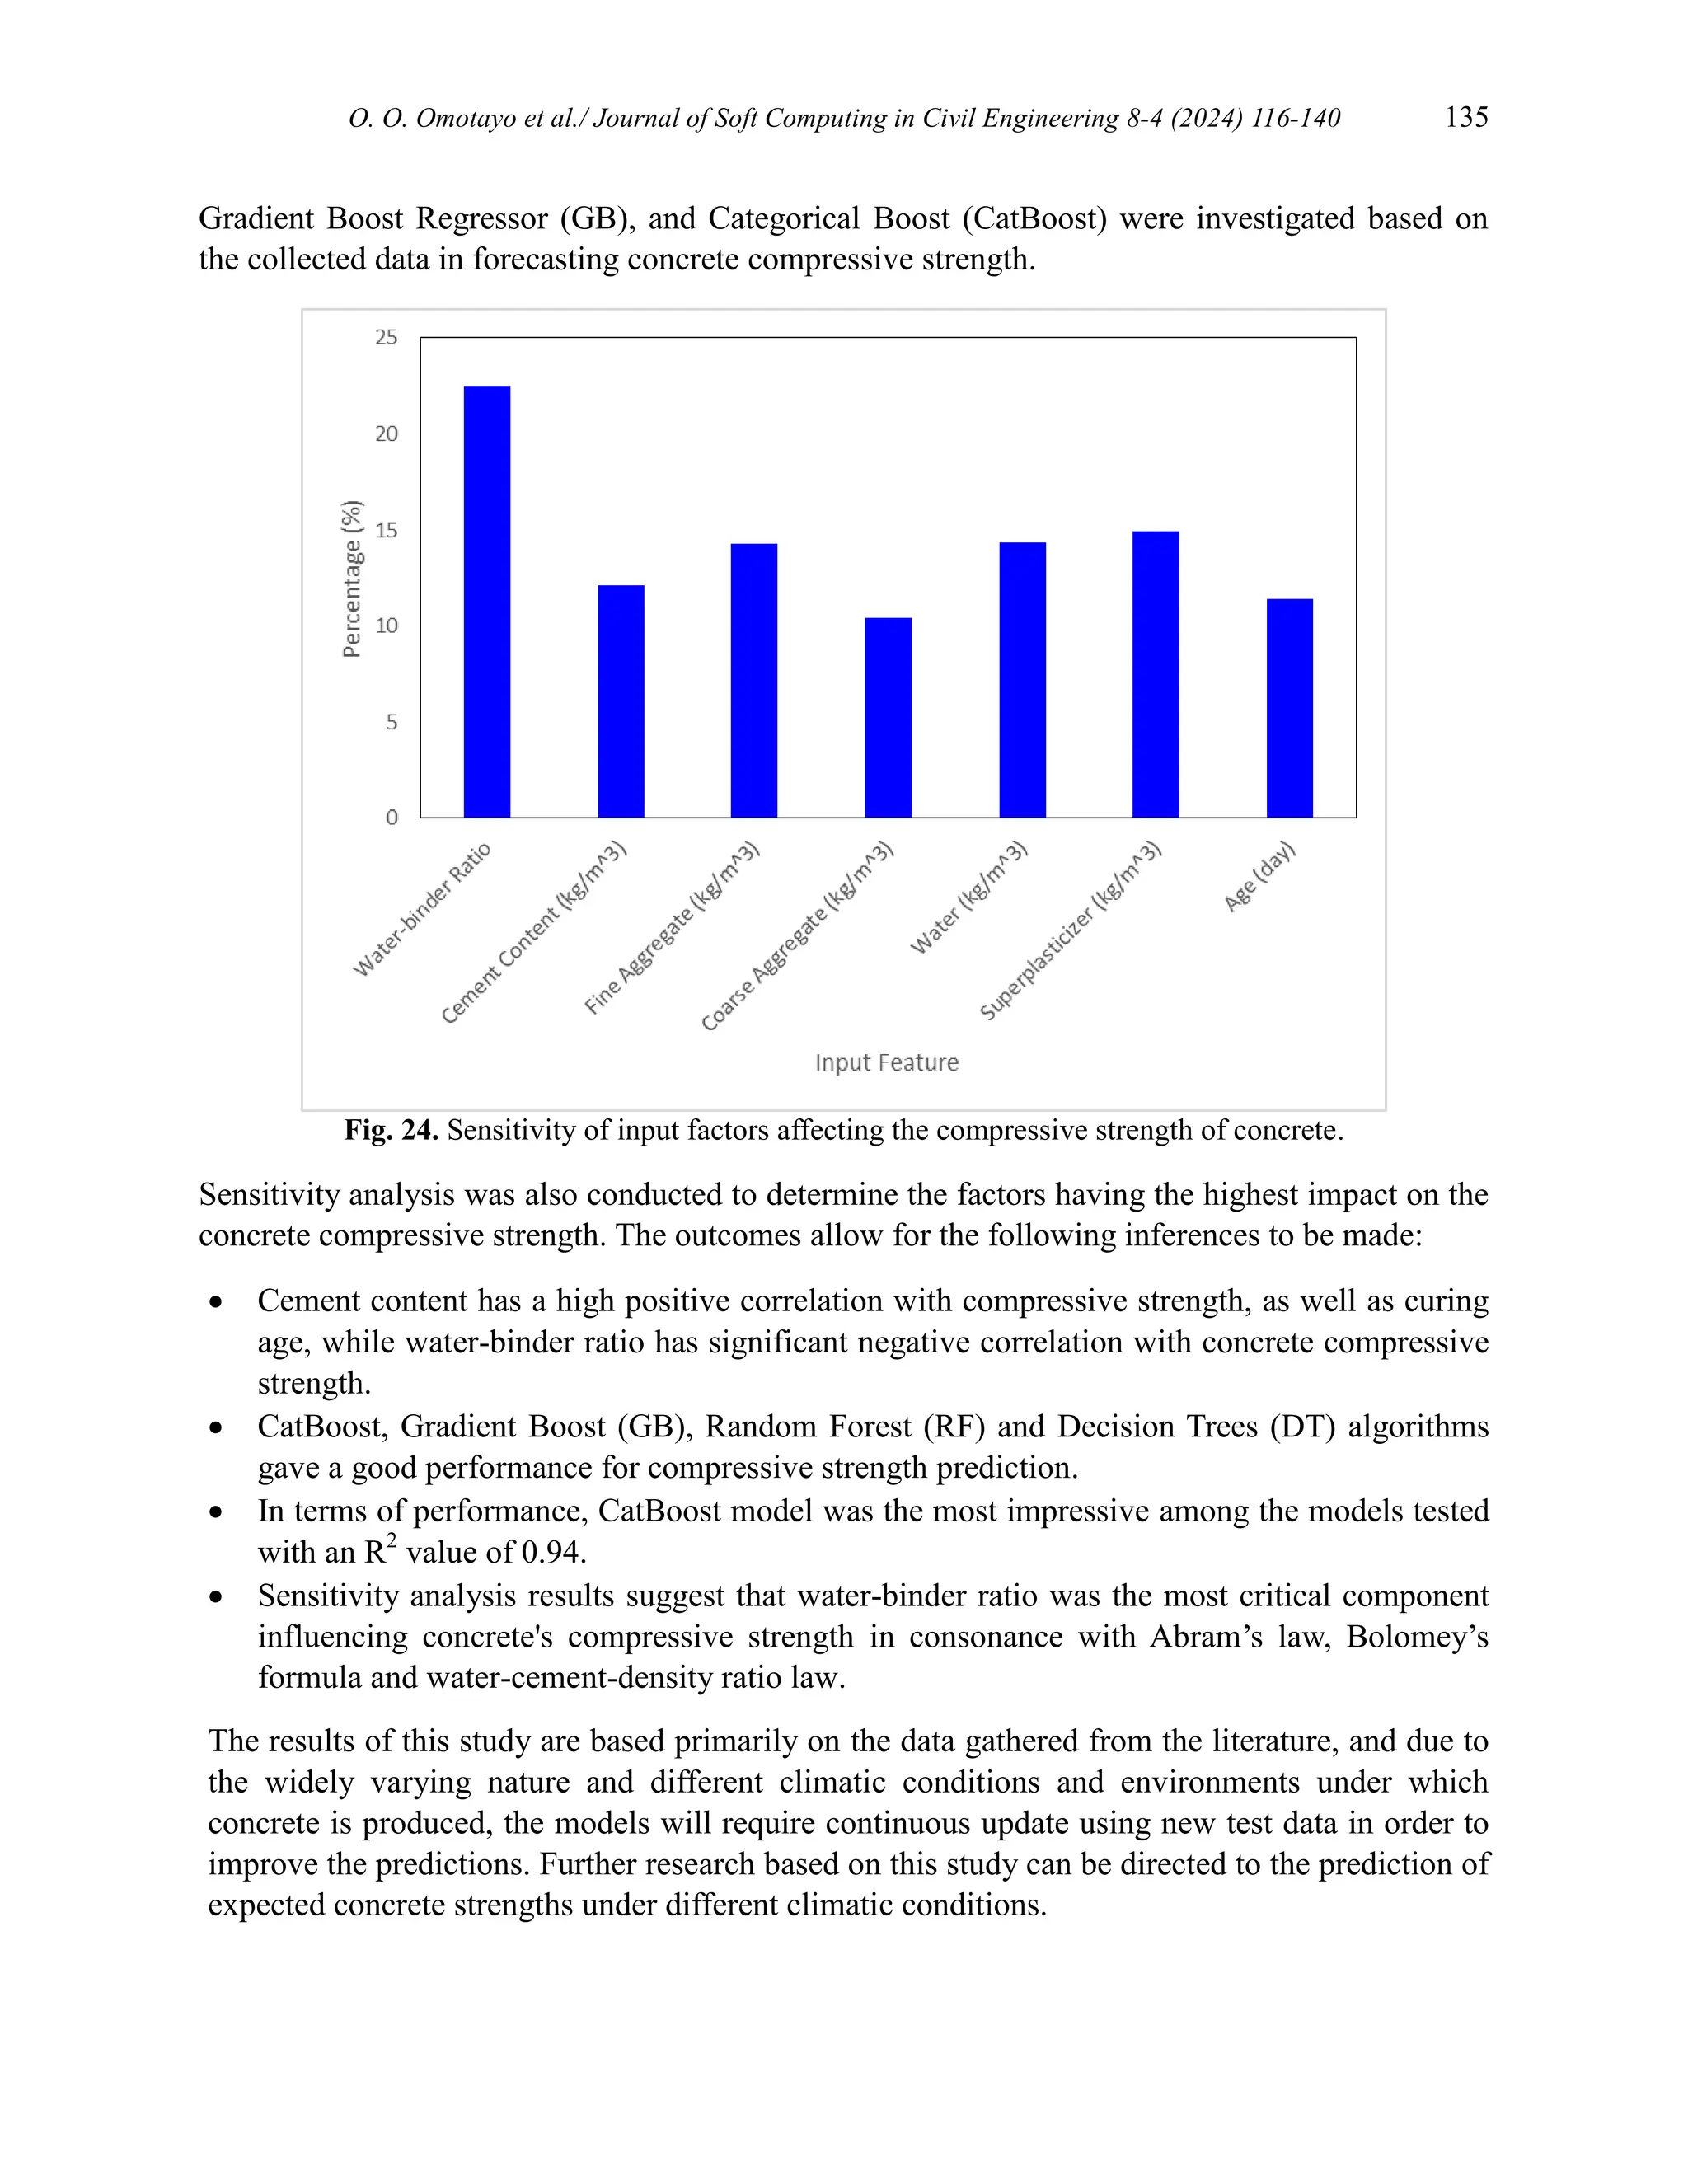
3.2. Sensitivity analysis of input features
Results of the sensitivity analysis performed is represented by the bar chart shown in Figure 23.
The findings show that the most significant element influencing concrete's compressive strength
is the water-binder ratio with a sensitivity value of 22.5%, other factors also contribute to the
compressive strength including curing age, cement content, fine aggregate content, coarse
aggregate content, water and superplasticizer content with sensitivity values of 11.4%, 12.1%,
14.3%, 10.5%, 14.3% and 14.95% respectively. This suggests that the water-binder ratio plays a
very critical role in determination of the compressive strength of concrete. This is in consonance
with Abram’s law, Bolomey’s formula and the water-cement-density ratio law [70]. This is
comparable to the outcome that Barkhordari et al. [71] had where the dominant factors
contributing to compressive strength of fly-ash concrete include curing age, cement content,
water content and water/cement ratio in order. Jiang et al. [22] and Alzubi et al. [72] also
observed analogous results.
4. Conclusions
This study investigated how various machine learning algorithms could be used to predict the
compressive strength of concrete as well as how input variables affected that strength. A total of
1760 datasets were gathered from literature, six machine learning techniques including Linear
Regression (LR), Decision Trees (DT), Random Forest (RF), Support Vector Machine (SVM),](https://image.slidesharecdn.com/sccevolume8issue4pages116-140-250603082102-023bd7e3/75/Assessment-of-Machine-Learning-Methods-for-Concrete-Compressive-Strength-Prediction-19-2048.jpg)
![136 O. O. Omotayo et al./ Journal of Soft Computing in Civil Engineering 8-4 (2024) 116-140
Acknowledgments
We wish to acknowledge F. Oyerinde, for technical support in the analysis of the data.
Funding
There was no external support for this study.
Conflicts of interest
No conflicts of interest are disclosed by the authors.
Authors contribution statement
OO, CA: Conceptualization; OO: Data curation; OO: Formal analysis; OO, CA: Investigation;
OO, CA: Methodology; OO, CA, CMI: Project administration; OO, CA: Resources and
Software; CA, CMI: Supervision; CA, CMI: Validation; OO: Visualization; OO: Roles/Writing –
original draft; OO, CA, CMI: Writing – review & editing.
References
[1] Omotayo OO, Arum C. Challenges and Prospects of Widespread Adoption of Pozzolans for
Building Construction: A Statistical Assessment. Int J Eng 2022;35:1929–40.
https://doi.org/10.5829/ije.2022.35.10a.12.
[2] Scrivener KL. Options for the future of cement. Indian Concr J 2014;88:11–21.
[3] Paixão RCF da, Penido RE-K, Cury AA, Mendes JC. Comparison of machine learning techniques
to predict the compressive strength of concrete and considerations on model generalization. Rev
IBRACON Estruturas e Mater 2022;15. https://doi.org/10.1590/s1983-41952022000500003.
[4] Prakash M, Manikandan S, Surenther I, Aswin Kumar MN, Ilakkiya S, Menaka D. Speculation of
compressive strength of concrete in real-time. Int J Recent Technol Eng 2019;7:988–92.
[5] Ahmed M, Hadi KM El, Hasan MA, Mallick J, Ahmed A. Evaluating the co-relationship between
concrete flexural tensile strength and compressive strength. Int J Struct Eng 2014;5:115.
https://doi.org/10.1504/IJSTRUCTE.2014.060902.
[6] Zain MFM, Abd SM, Sopian K, Jamil M, Che-Ani AI. Mathematical regression model for the
prediction of concrete strength. WSEAS Int. Conf. Proceedings. Math. Comput. Sci. Eng., vol. 10,
WSEAS; 2008, p. 313–30.
[7] Chopra P, Sharma RK, Kumar M. PREDICTING COMPRESSIVE STRENGTH OF CONCRETE
FOR VARYING WORKABILITY USING REGRESSION MODELS. Int J Eng Appl Sci
2014;6:10–10. https://doi.org/10.24107/ijeas.251233.
[8] Chore HS, Shelke NL. Prediction of compressive strength of concrete using multiple regression
model. Struct Eng Mech An Int J 2013;45:837–51.
[9] Kiambigi M, Gwaya AO, Koteng D. Concrete strength prediction using multi-linear regression
model: a case study of nairobi metropolitan. Int J Soft Comput Eng 2019;8:11–20.
[10] Málaga-Chuquitaype C. Machine Learning in Structural Design: An Opinionated Review. Front
Built Environ 2022;8. https://doi.org/10.3389/fbuil.2022.815717.
[11] Murphy KP. Machine learning: a probabilistic perspective. MIT press; 2012.
[12] Daneshfaraz R, Norouzi R, Abbaszadeh H, Kuriqi A, Di Francesco S. Influence of Sill on the](https://image.slidesharecdn.com/sccevolume8issue4pages116-140-250603082102-023bd7e3/75/Assessment-of-Machine-Learning-Methods-for-Concrete-Compressive-Strength-Prediction-21-2048.jpg)
![O. O. Omotayo et al./ Journal of Soft Computing in Civil Engineering 8-4 (2024) 116-140 137
Hydraulic Regime in Sluice Gates: An Experimental and Numerical Analysis. Fluids 2022;7:244.
https://doi.org/10.3390/fluids7070244.
[13] Daneshfaraz R, Norouzi R, Abbaszadeh H. Effect of geometric shapes of chimney weir on
discharge coefficient. J Appl Water Eng Res 2024;12:27–38.
https://doi.org/10.1080/23249676.2023.2192977.
[14] Azarafza M, Azarafza M, Akgün H, Atkinson PM, Derakhshani R. Deep learning-based landslide
susceptibility mapping. Sci Rep 2021;11:24112. https://doi.org/10.1038/s41598-021-03585-1.
[15] Chen H, Li X, Wu Y, Zuo L, Lu M, Zhou Y. Compressive Strength Prediction of High-Strength
Concrete Using Long Short-Term Memory and Machine Learning Algorithms. Buildings
2022;12:302. https://doi.org/10.3390/buildings12030302.
[16] Mousavi SM, Bahr Peyma A, Mousavi SR, Moodi Y. Predicting the Ultimate and Relative Bond
Strength of Corroded Bars and Surrounding Concrete by Considering the Effect of Transverse
Rebar Using Machine Learning. Iran J Sci Technol Trans Civ Eng 2023;47:193–219.
https://doi.org/10.1007/s40996-022-00909-7.
[17] Song H, Ahmad A, Farooq F, Ostrowski KA, Maślak M, Czarnecki S, et al. Predicting the
compressive strength of concrete with fly ash admixture using machine learning algorithms.
Constr Build Mater 2021;308:125021. https://doi.org/10.1016/j.conbuildmat.2021.125021.
[18] Salimbahrami SR, Shakeri R. Experimental investigation and comparative machine-learning
prediction of compressive strength of recycled aggregate concrete. Soft Comput 2021;25:919–32.
https://doi.org/10.1007/s00500-021-05571-1.
[19] Feng D-C, Liu Z-T, Wang X-D, Chen Y, Chang J-Q, Wei D-F, et al. Machine learning-based
compressive strength prediction for concrete: An adaptive boosting approach. Constr Build Mater
2020;230:117000. https://doi.org/10.1016/j.conbuildmat.2019.117000.
[20] Chopra P, Sharma RK, Kumar M, Chopra T. Comparison of Machine Learning Techniques for the
Prediction of Compressive Strength of Concrete. Adv Civ Eng 2018;2018:1–9.
https://doi.org/10.1155/2018/5481705.
[21] Cao R, Fang Z, Jin M, Shang Y. Application of Machine Learning Approaches to Predict the
Strength Property of Geopolymer Concrete. Materials (Basel) 2022;15:2400.
https://doi.org/10.3390/ma15072400.
[22] Jiang Y, Li H, Zhou Y. Compressive Strength Prediction of Fly Ash Concrete Using Machine
Learning Techniques. Buildings 2022;12:690. https://doi.org/10.3390/buildings12050690.
[23] Ahmad A, Chaiyasarn K, Farooq F, Ahmad W, Suparp S, Aslam F. Compressive Strength
Prediction via Gene Expression Programming (GEP) and Artificial Neural Network (ANN) for
Concrete Containing RCA. Buildings 2021;11:324. https://doi.org/10.3390/buildings11080324.
[24] Farooq F, Nasir Amin M, Khan K, Rehan Sadiq M, Faisal Javed MF, Aslam F, et al. A
Comparative Study of Random Forest and Genetic Engineering Programming for the Prediction of
Compressive Strength of High Strength Concrete (HSC). Appl Sci 2020;10:7330.
https://doi.org/10.3390/app10207330.
[25] Pandey S, Kumar V, Kumar P. Application and Analysis of Machine Learning Algorithms for
Design of Concrete Mix with Plasticizer and without Plasticizer. J Soft Comput Civ Eng
2021;5:19–37.
[26] Timur Cihan M. Prediction of Concrete Compressive Strength and Slump by Machine Learning
Methods. Adv Civ Eng 2019;2019. https://doi.org/10.1155/2019/3069046.
[27] Nikoo M, Torabian Moghadam F, Sadowski Ł. Prediction of Concrete Compressive Strength by
Evolutionary Artificial Neural Networks. Adv Mater Sci Eng 2015;2015:1–8.
https://doi.org/10.1155/2015/849126.
[28] Chen H, Qian C, Liang C, Kang W. An approach for predicting the compressive strength of
cement-based materials exposed to sulfate attack. PLoS One 2018;13:e0191370.](https://image.slidesharecdn.com/sccevolume8issue4pages116-140-250603082102-023bd7e3/75/Assessment-of-Machine-Learning-Methods-for-Concrete-Compressive-Strength-Prediction-22-2048.jpg)
![138 O. O. Omotayo et al./ Journal of Soft Computing in Civil Engineering 8-4 (2024) 116-140
[29] Liong S-Y, Lim W-H, Paudyal GN. River Stage Forecasting in Bangladesh: Neural Network
Approach. J Comput Civ Eng 2000;14:1–8. https://doi.org/10.1061/(ASCE)0887-
3801(2000)14:1(1).
[30] Ly H-B, Nguyen T-A, Pham BT. Investigation on factors affecting early strength of high-
performance concrete by Gaussian Process Regression. PLoS One 2022;17:e0262930.
[31] Huynh AT, Nguyen QD, Xuan QL, Magee B, Chung T, Tran KT, et al. A Machine Learning-
Assisted Numerical Predictor for Compressive Strength of Geopolymer Concrete Based on
Experimental Data and Sensitivity Analysis. Appl Sci 2020;10:7726.
https://doi.org/10.3390/app10217726.
[32] Nwofor TC, Eme DB. Appraisal on The Strength of Concrete Produced with Varying Aggregate
Size. Int J Civ Eng Technol 2016;7.
[33] Chopra P, Sharma RK, Kumar M. Artificial neural networks for the prediction of compressive
strength of concrete. Int J Appl Sci Eng 2015;13:187–204.
[34] Chopra P, Sharma RK, Kumar M. Prediction of Compressive Strength of Concrete Using Artificial
Neural Network and Genetic Programming. Adv Mater Sci Eng 2016;2016:1–10.
https://doi.org/10.1155/2016/7648467.
[35] Yeh I-C. Modeling slump flow of concrete using second-order regressions and artificial neural
networks. Cem Concr Compos 2007;29:474–80.
https://doi.org/10.1016/j.cemconcomp.2007.02.001.
[36] Meddah MS, Zitouni S, Belâabes S. Effect of content and particle size distribution of coarse
aggregate on the compressive strength of concrete. Constr Build Mater 2010;24:505–12.
https://doi.org/10.1016/j.conbuildmat.2009.10.009.
[37] Jankovic K, Nikolic D, Bojovic D, Loncar L, Romakov Z. The estimation of compressive strength
of normal and recycled aggregate concrete. Facta Univ - Ser Archit Civ Eng 2011;9:419–31.
https://doi.org/10.2298/FUACE1103419J.
[38] Lee S-C. Prediction of concrete strength using artificial neural networks. Eng Struct 2003;25:849–
57. https://doi.org/10.1016/S0141-0296(03)00004-X.
[39] Unamba UK, Nwajagu ES, Abutu J, Agbo-Anike OJ. Predictive model of the compressive strength
of concrete containing coconut shell ash as partial replacement of cement using multiple
regression analysis. Int J Innov Sci Res Technol 2021;6:600–8.
[40] Chiemela C, Igwegbe W, Ibearugbulem O, Okoye P, Oke M. Comparing the compressive
strenghths of concrete made with river sand and quarry dust as fine aggregates. Int Lett Nat Sci
2014;15.
[41] Arundas PH, Dewangan UK. Compressive strength of concrete based on ultrasonic and impact
echo test. Indian J Sci Technol 2016;9:1–7.
[42] Samui P. Determination of compressive strength of concrete by statistical learning algorithms. Eng
J 2013;17:111–20.
[43] Zheng J, Liu G. The Influence and Application of Slag, Fly Ash, and Limestone Flour on
Compressive Strength of Concrete Based on the Concrete Compressive Strength Development
over Time (CCSDOT) Model. Appl Sci 2020;10:3572. https://doi.org/10.3390/app10103572.
[44] Ghazal AI, El-Sheikh MY, Abd El-Rahim AH. Effects of Seawater on Setting Time and
Compressive Strength of Concretes with Different Richness. Civ Eng J 2021;7:857–65.
[45] Eneowaji DO, Ucheowaji O. Effect of Exposure of Cement on the Compressive Strength of
Concrete. J Eng Res Reports 2021:24–32. https://doi.org/10.9734/jerr/2021/v20i617324.
[46] H. O. Ozioko EMM. Comparative Analysis of Compressive Strength of Concrete made from
Various Sizes of Coarse Aggregates. Umudike J Eng Technol 2016;2:86–92.
[47] Osei DY, Mustapha Z, Zebilila MDH. Compressive strength of concrete using different curing
methods. J Soc Dev Sci 2019;10:30–8.](https://image.slidesharecdn.com/sccevolume8issue4pages116-140-250603082102-023bd7e3/75/Assessment-of-Machine-Learning-Methods-for-Concrete-Compressive-Strength-Prediction-23-2048.jpg)
![O. O. Omotayo et al./ Journal of Soft Computing in Civil Engineering 8-4 (2024) 116-140 139
[48] Bu L, Du G, Hou Q. Prediction of the Compressive Strength of Recycled Aggregate Concrete
Based on Artificial Neural Network. Materials (Basel) 2021;14:3921.
https://doi.org/10.3390/ma14143921.
[49] Yeh I-C. Modeling of strength of high-performance concrete using artificial neural networks. Cem
Concr Res 1998;28:1797–808. https://doi.org/10.1016/S0008-8846(98)00165-3.
[50] Cortes C, Vapnik V. Support-vector networks. Mach Learn 1995;20:273–97.
https://doi.org/10.1007/BF00994018.
[51] Tang F, Wu Y, Zhou Y. Hybridizing Grid Search and Support Vector Regression to Predict the
Compressive Strength of Fly Ash Concrete. Adv Civ Eng 2022;2022.
https://doi.org/10.1155/2022/3601914.
[52] Kabiru OA, Owolabi TO, Ssennoga T, Olatunji SO. Performance comparison of SVM and ANN in
predicting compressive strength of concrete 2014.
[53] Çevik A, Kurtoğlu AE, Bilgehan M, Gülşan ME, Albegmprli HM. SUPPORT VECTOR
MACHINES IN STRUCTURAL ENGINEERING: A REVIEW. J Civ Eng Manag 2015;21:261–
81. https://doi.org/10.3846/13923730.2015.1005021.
[54] Mishra M, Bhatia AS, Maity D. Support vector machine for determining the compressive strength
of brick-mortar masonry using NDT data fusion (case study: Kharagpur, India). SN Appl Sci
2019;1:564. https://doi.org/10.1007/s42452-019-0590-5.
[55] Ahmad M, Hu J-L, Ahmad F, Tang X-W, Amjad M, Iqbal MJ, et al. Supervised Learning Methods
for Modeling Concrete Compressive Strength Prediction at High Temperature. Materials (Basel)
2021;14:1983. https://doi.org/10.3390/ma14081983.
[56] Ahmad A, Ahmad W, Aslam F, Joyklad P. Compressive strength prediction of fly ash-based
geopolymer concrete via advanced machine learning techniques. Case Stud Constr Mater
2022;16:e00840. https://doi.org/10.1016/j.cscm.2021.e00840.
[57] Patel HH, Prajapati P. Study and analysis of decision tree based classification algorithms. Int J
Comput Sci Eng 2018;6:74–8.
[58] Sarker IH. Machine Learning: Algorithms, Real-World Applications and Research Directions. SN
Comput Sci 2021;2:160. https://doi.org/10.1007/s42979-021-00592-x.
[59] DeRousseau MA, Laftchiev E, Kasprzyk JR, Rajagopalan B, Srubar WV. A comparison of
machine learning methods for predicting the compressive strength of field-placed concrete. Constr
Build Mater 2019;228:116661. https://doi.org/10.1016/j.conbuildmat.2019.08.042.
[60] Silva PFS, Moita GF, Arruda VF. Machine learning techniques to predict the compressive strength
of concrete. Métodos Numéricos Para Cálculo y Diseño En Ing Rev Int 2020;36:1–14.
[61] Shatnawi A, Alkassar HM, Al-Abdaly NM, Al-Hamdany EA, Bernardo LFA, Imran H. Shear
Strength Prediction of Slender Steel Fiber Reinforced Concrete Beams Using a Gradient Boosting
Regression Tree Method. Buildings 2022;12:550. https://doi.org/10.3390/buildings12050550.
[62] Gayathri R, Rani SU, Čepová L, Rajesh M, Kalita K. A Comparative Analysis of Machine
Learning Models in Prediction of Mortar Compressive Strength. Processes 2022;10:1387.
https://doi.org/10.3390/pr10071387.
[63] Li D, Tang Z, Kang Q, Zhang X, Li Y. Machine Learning-Based Method for Predicting
Compressive Strength of Concrete. Processes 2023;11:390. https://doi.org/10.3390/pr11020390.
[64] Safaei N, Safaei B, Seyedekrami S, Talafidaryani M, Masoud A, Wang S, et al. E-CatBoost: An
efficient machine learning framework for predicting ICU mortality using the eICU Collaborative
Research Database. PLoS One 2022;17:e0262895.
[65] Mansouri E, Manfredi M, Hu J-W. Environmentally Friendly Concrete Compressive Strength
Prediction Using Hybrid Machine Learning. Sustainability 2022;14:12990.
https://doi.org/10.3390/su142012990.
[66] Dorogush AV, Ershov V, Gulin A. CatBoost: gradient boosting with categorical features support.](https://image.slidesharecdn.com/sccevolume8issue4pages116-140-250603082102-023bd7e3/75/Assessment-of-Machine-Learning-Methods-for-Concrete-Compressive-Strength-Prediction-24-2048.jpg)
![140 O. O. Omotayo et al./ Journal of Soft Computing in Civil Engineering 8-4 (2024) 116-140
ArXiv Prepr ArXiv181011363 2018.
[67] Kim B, Lee D-E, Hu G, Natarajan Y, Preethaa S, Rathinakumar AP. Ensemble Machine Learning-
Based Approach for Predicting of FRP–Concrete Interfacial Bonding. Mathematics 2022;10:231.
https://doi.org/10.3390/math10020231.
[68] Beskopylny AN, Stel’makh SA, Shcherban’ EM, Mailyan LR, Meskhi B, Razveeva I, et al.
Concrete Strength Prediction Using Machine Learning Methods CatBoost, k-Nearest Neighbors,
Support Vector Regression. Appl Sci 2022;12:10864. https://doi.org/10.3390/app122110864.
[69] Lee S, Nguyen N, Karamanli A, Lee J, Vo TP. Super learner machine‐learning algorithms for
compressive strength prediction of high performance concrete. Struct Concr 2023;24:2208–28.
https://doi.org/10.1002/suco.202200424.
[70] Li S, Yang J, Zhang P. Water‐Cement‐Density Ratio Law for the 28‐Day Compressive Strength
Prediction of Cement‐Based Materials. Adv Mater Sci Eng 2020;2020.
https://doi.org/10.1155/2020/7302173.
[71] Barkhordari M, Armaghani D, Mohammed A, Ulrikh D. Data-Driven Compressive Strength
Prediction of Fly Ash Concrete Using Ensemble Learner Algorithms. Buildings 2022;12:132.
https://doi.org/10.3390/buildings12020132.
[72] Alzubi Y, Al Adwan J, Khatatbeh A, Al-kharabsheh B. Parametric Assessment of Concrete
Constituent Materials Using Machine Learning Techniques. J Soft Comput Civ Eng 2022;6:39–62.
https://doi.org/10.22115/scce.2022.334664.1417.](https://image.slidesharecdn.com/sccevolume8issue4pages116-140-250603082102-023bd7e3/75/Assessment-of-Machine-Learning-Methods-for-Concrete-Compressive-Strength-Prediction-25-2048.jpg)
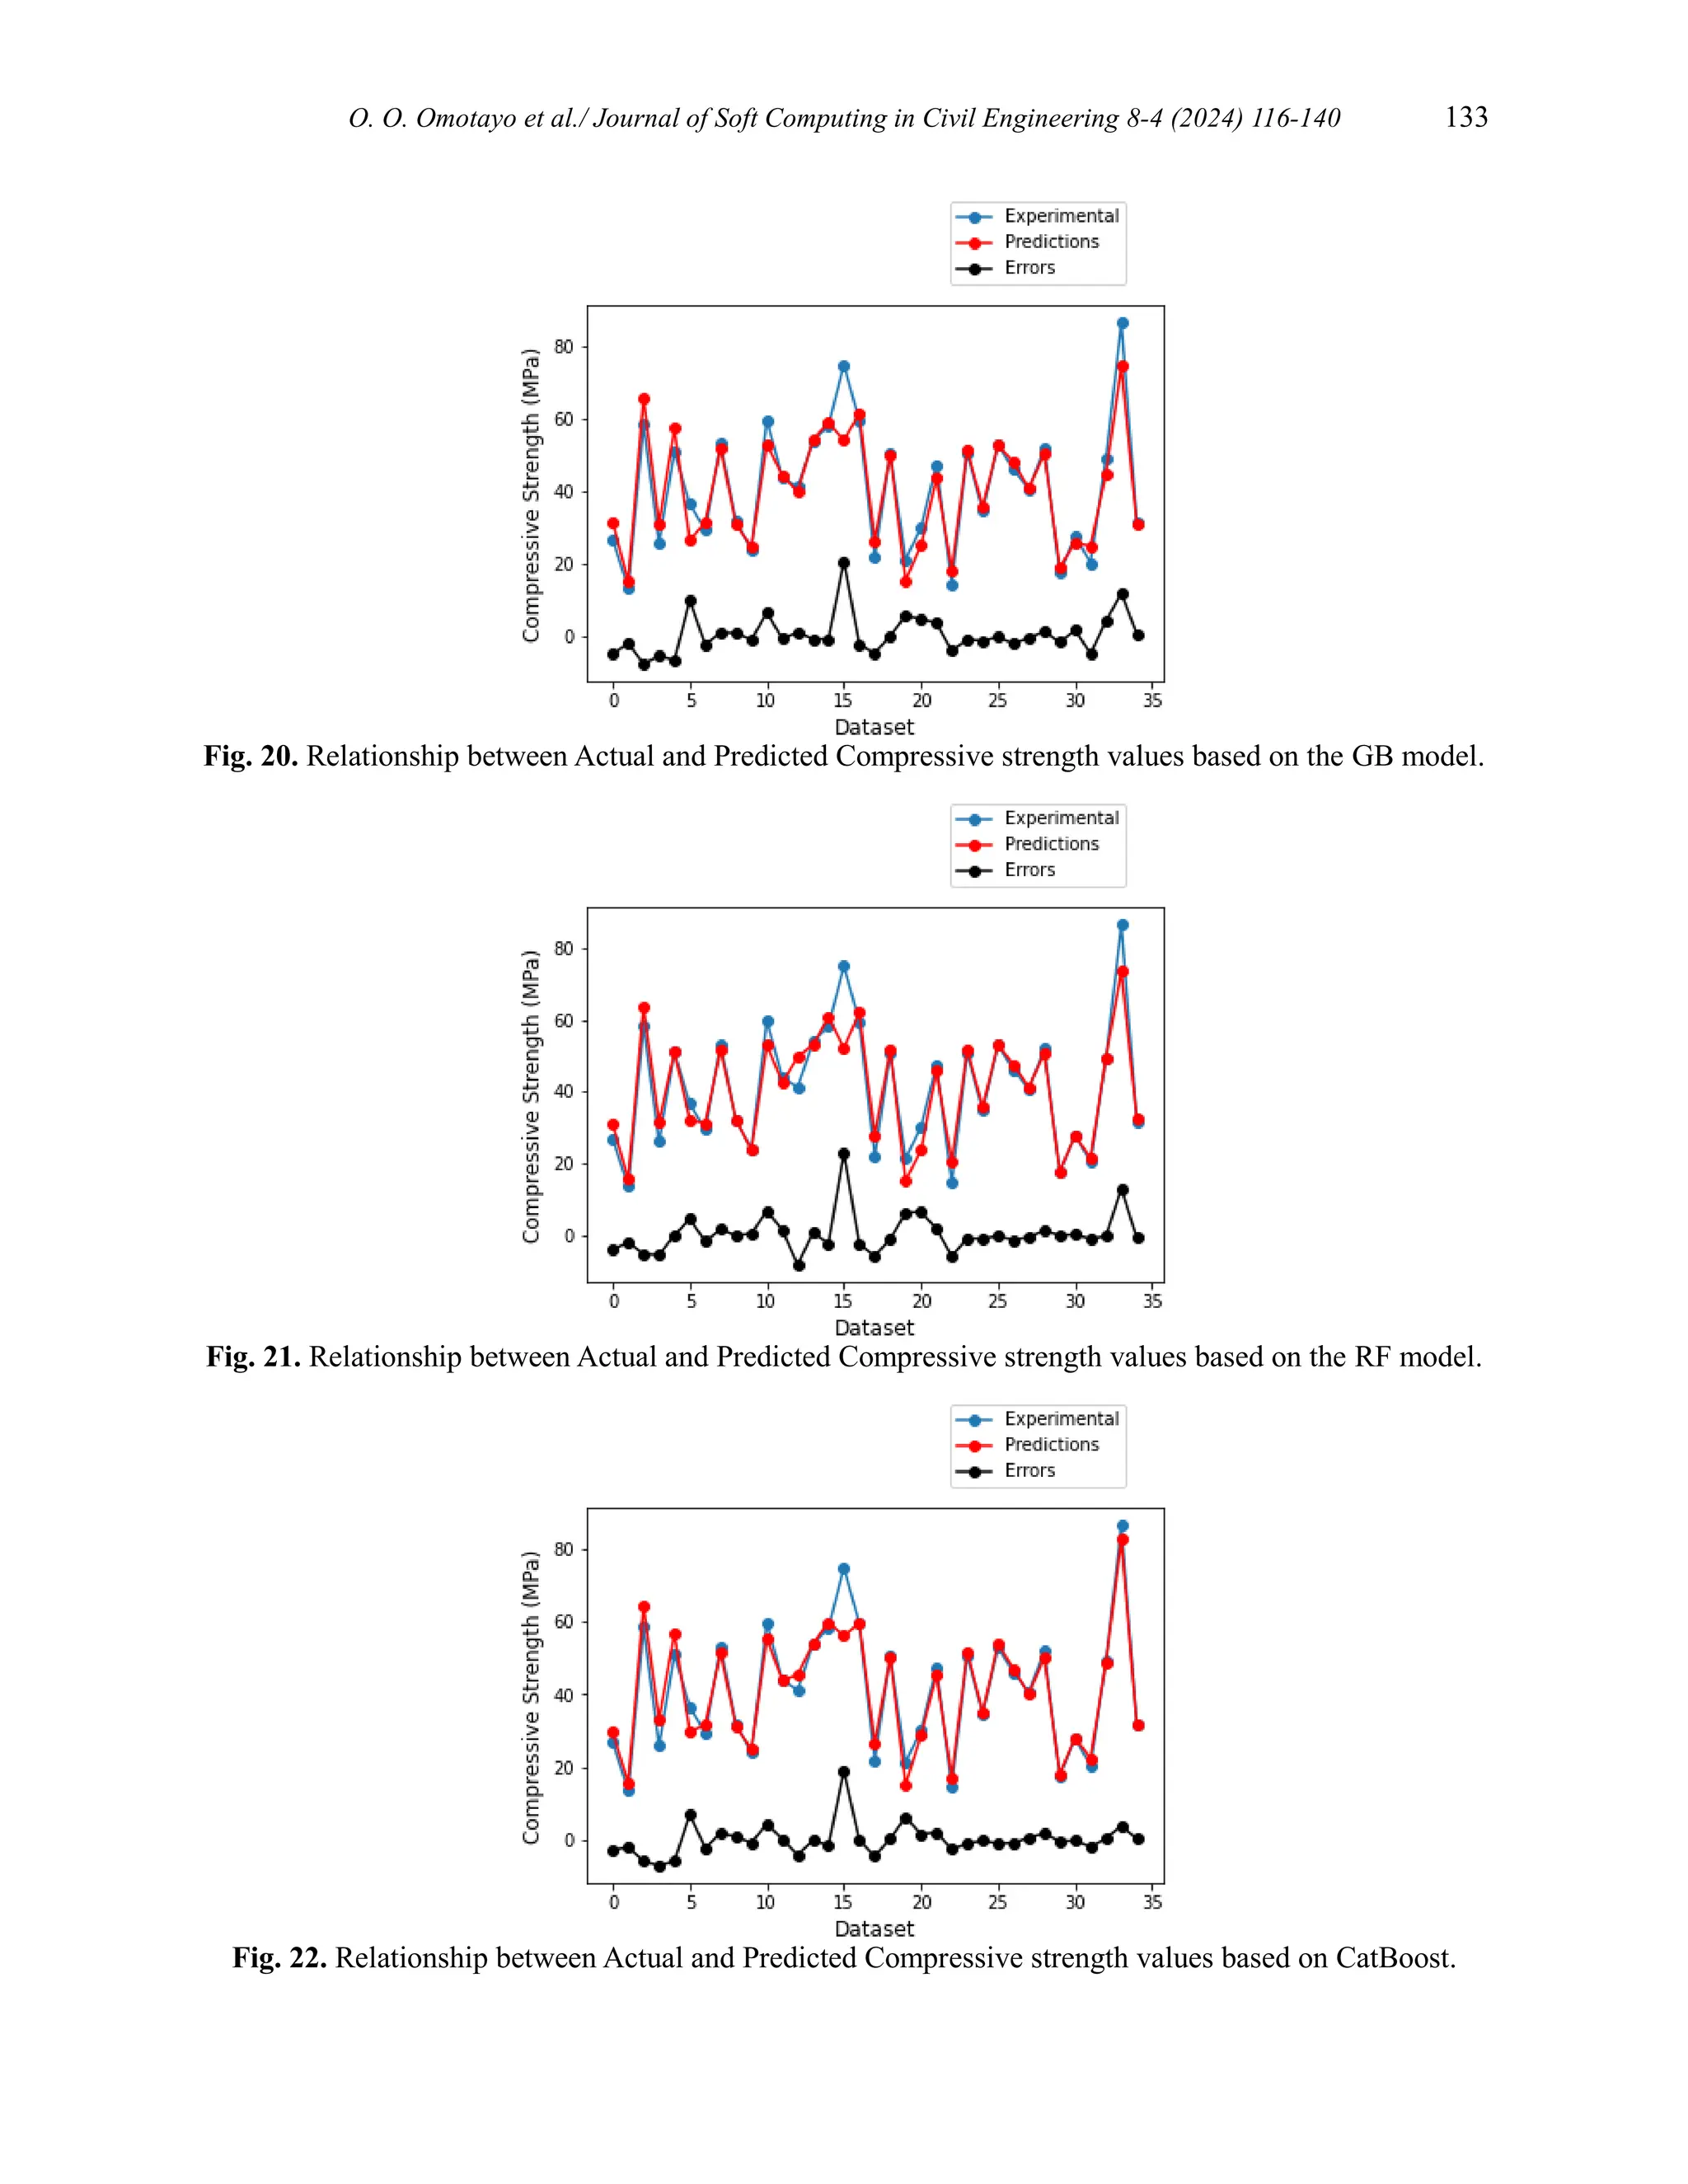
This research sought to forecast concrete compressive strength through six machine learning (ML) algorithms namely Linear Regression (LR), Random Forest (RF), Decision Trees (DT), Gradient Boost (GB), Support Vector Machine (SVM), and Categorical Gradient Boost (CatBoost), and to examine the significance of the input factors on the concrete compressive strength. The study considered a wide range of literature data and examined the efficiency of boosted algorithms in predicting the strength of ordinary Portland cement concrete. A total of 1760 datapoints were gathered from the literature. In order to focus on the prediction of concrete without any pozzolanic content, the data points containing pozzolans were dropped, leaving 526 data points which were trained and tested on the selected ML algorithms. The model performances were evaluated based on mean squared error (MSE), root mean squared error (RMSE), mean absolute error (MAE) and coefficient of determination (R2). An analysis was also performed to assess the sensitivity of the compressive strength to the input factors. Results showed that CatBoost, Gradient Boost (GB), Random Forest (RF) and Decision Trees (DT) had good performance, with CatBoost performing best with R2, MSE, RMSE, and MAE of 0.94, 17.663, 4.203, and 2.809 respectively, while the water-binder ratio showed the highest significance in affecting concrete strength.