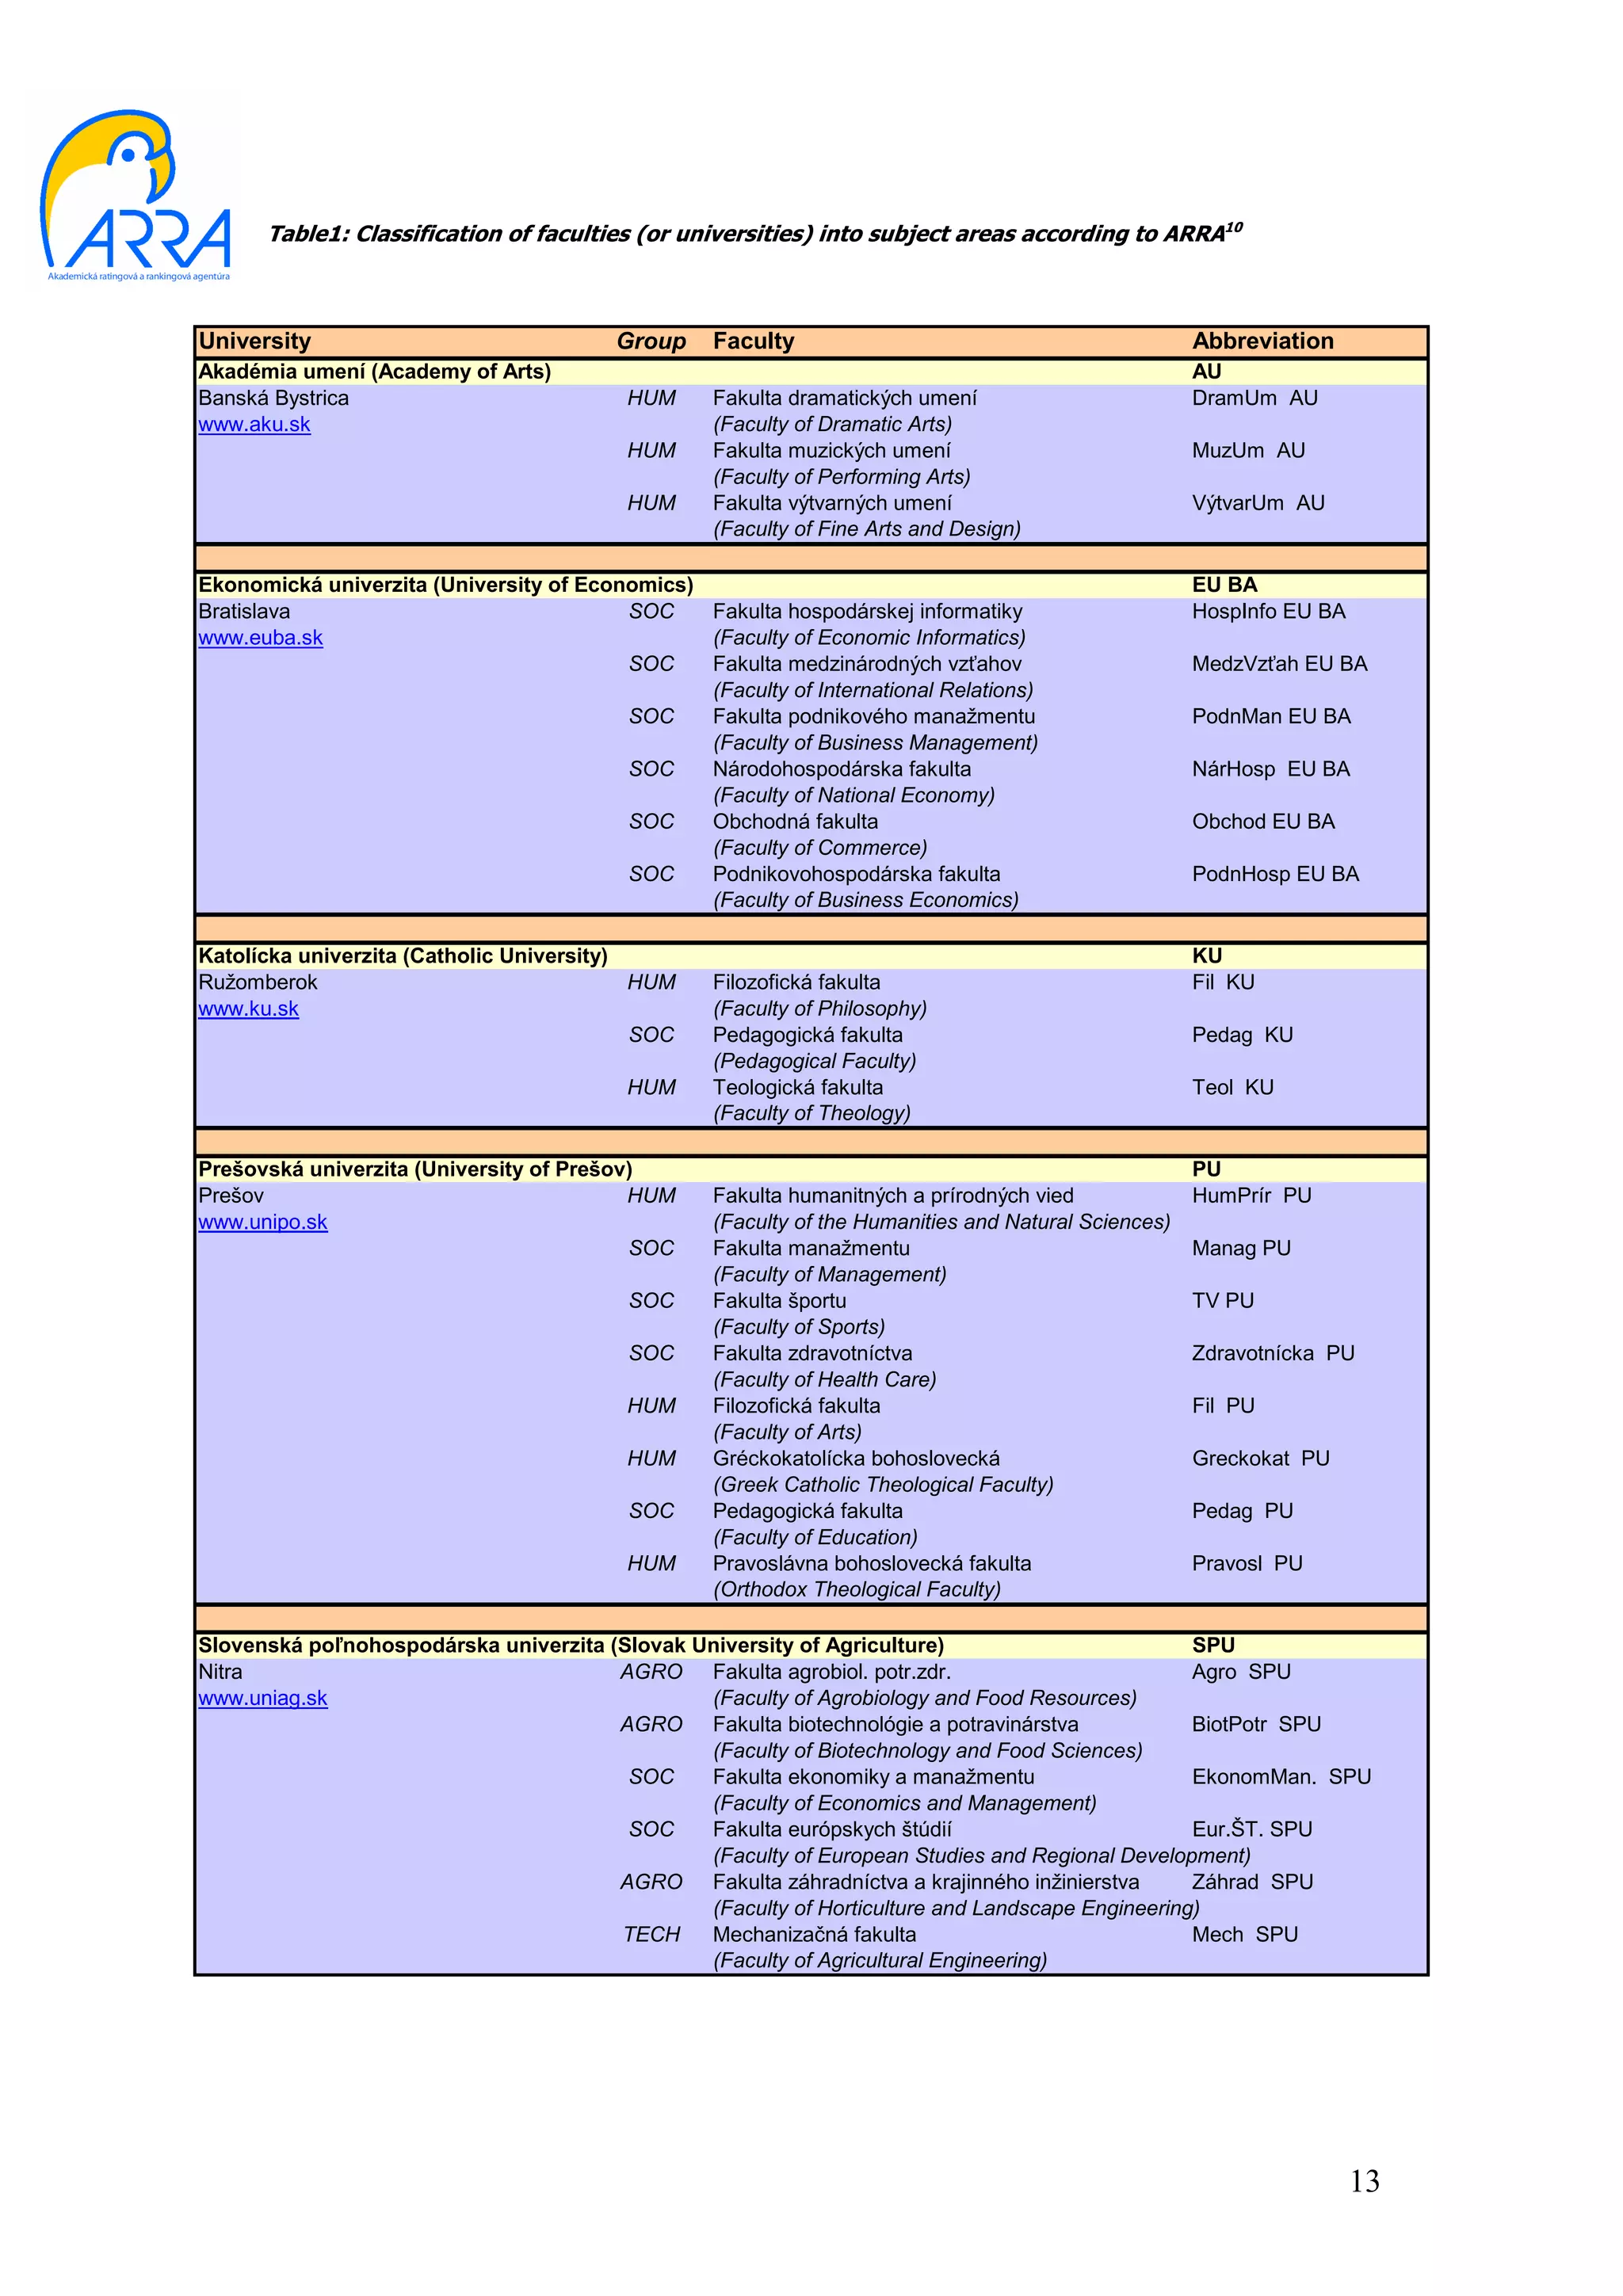
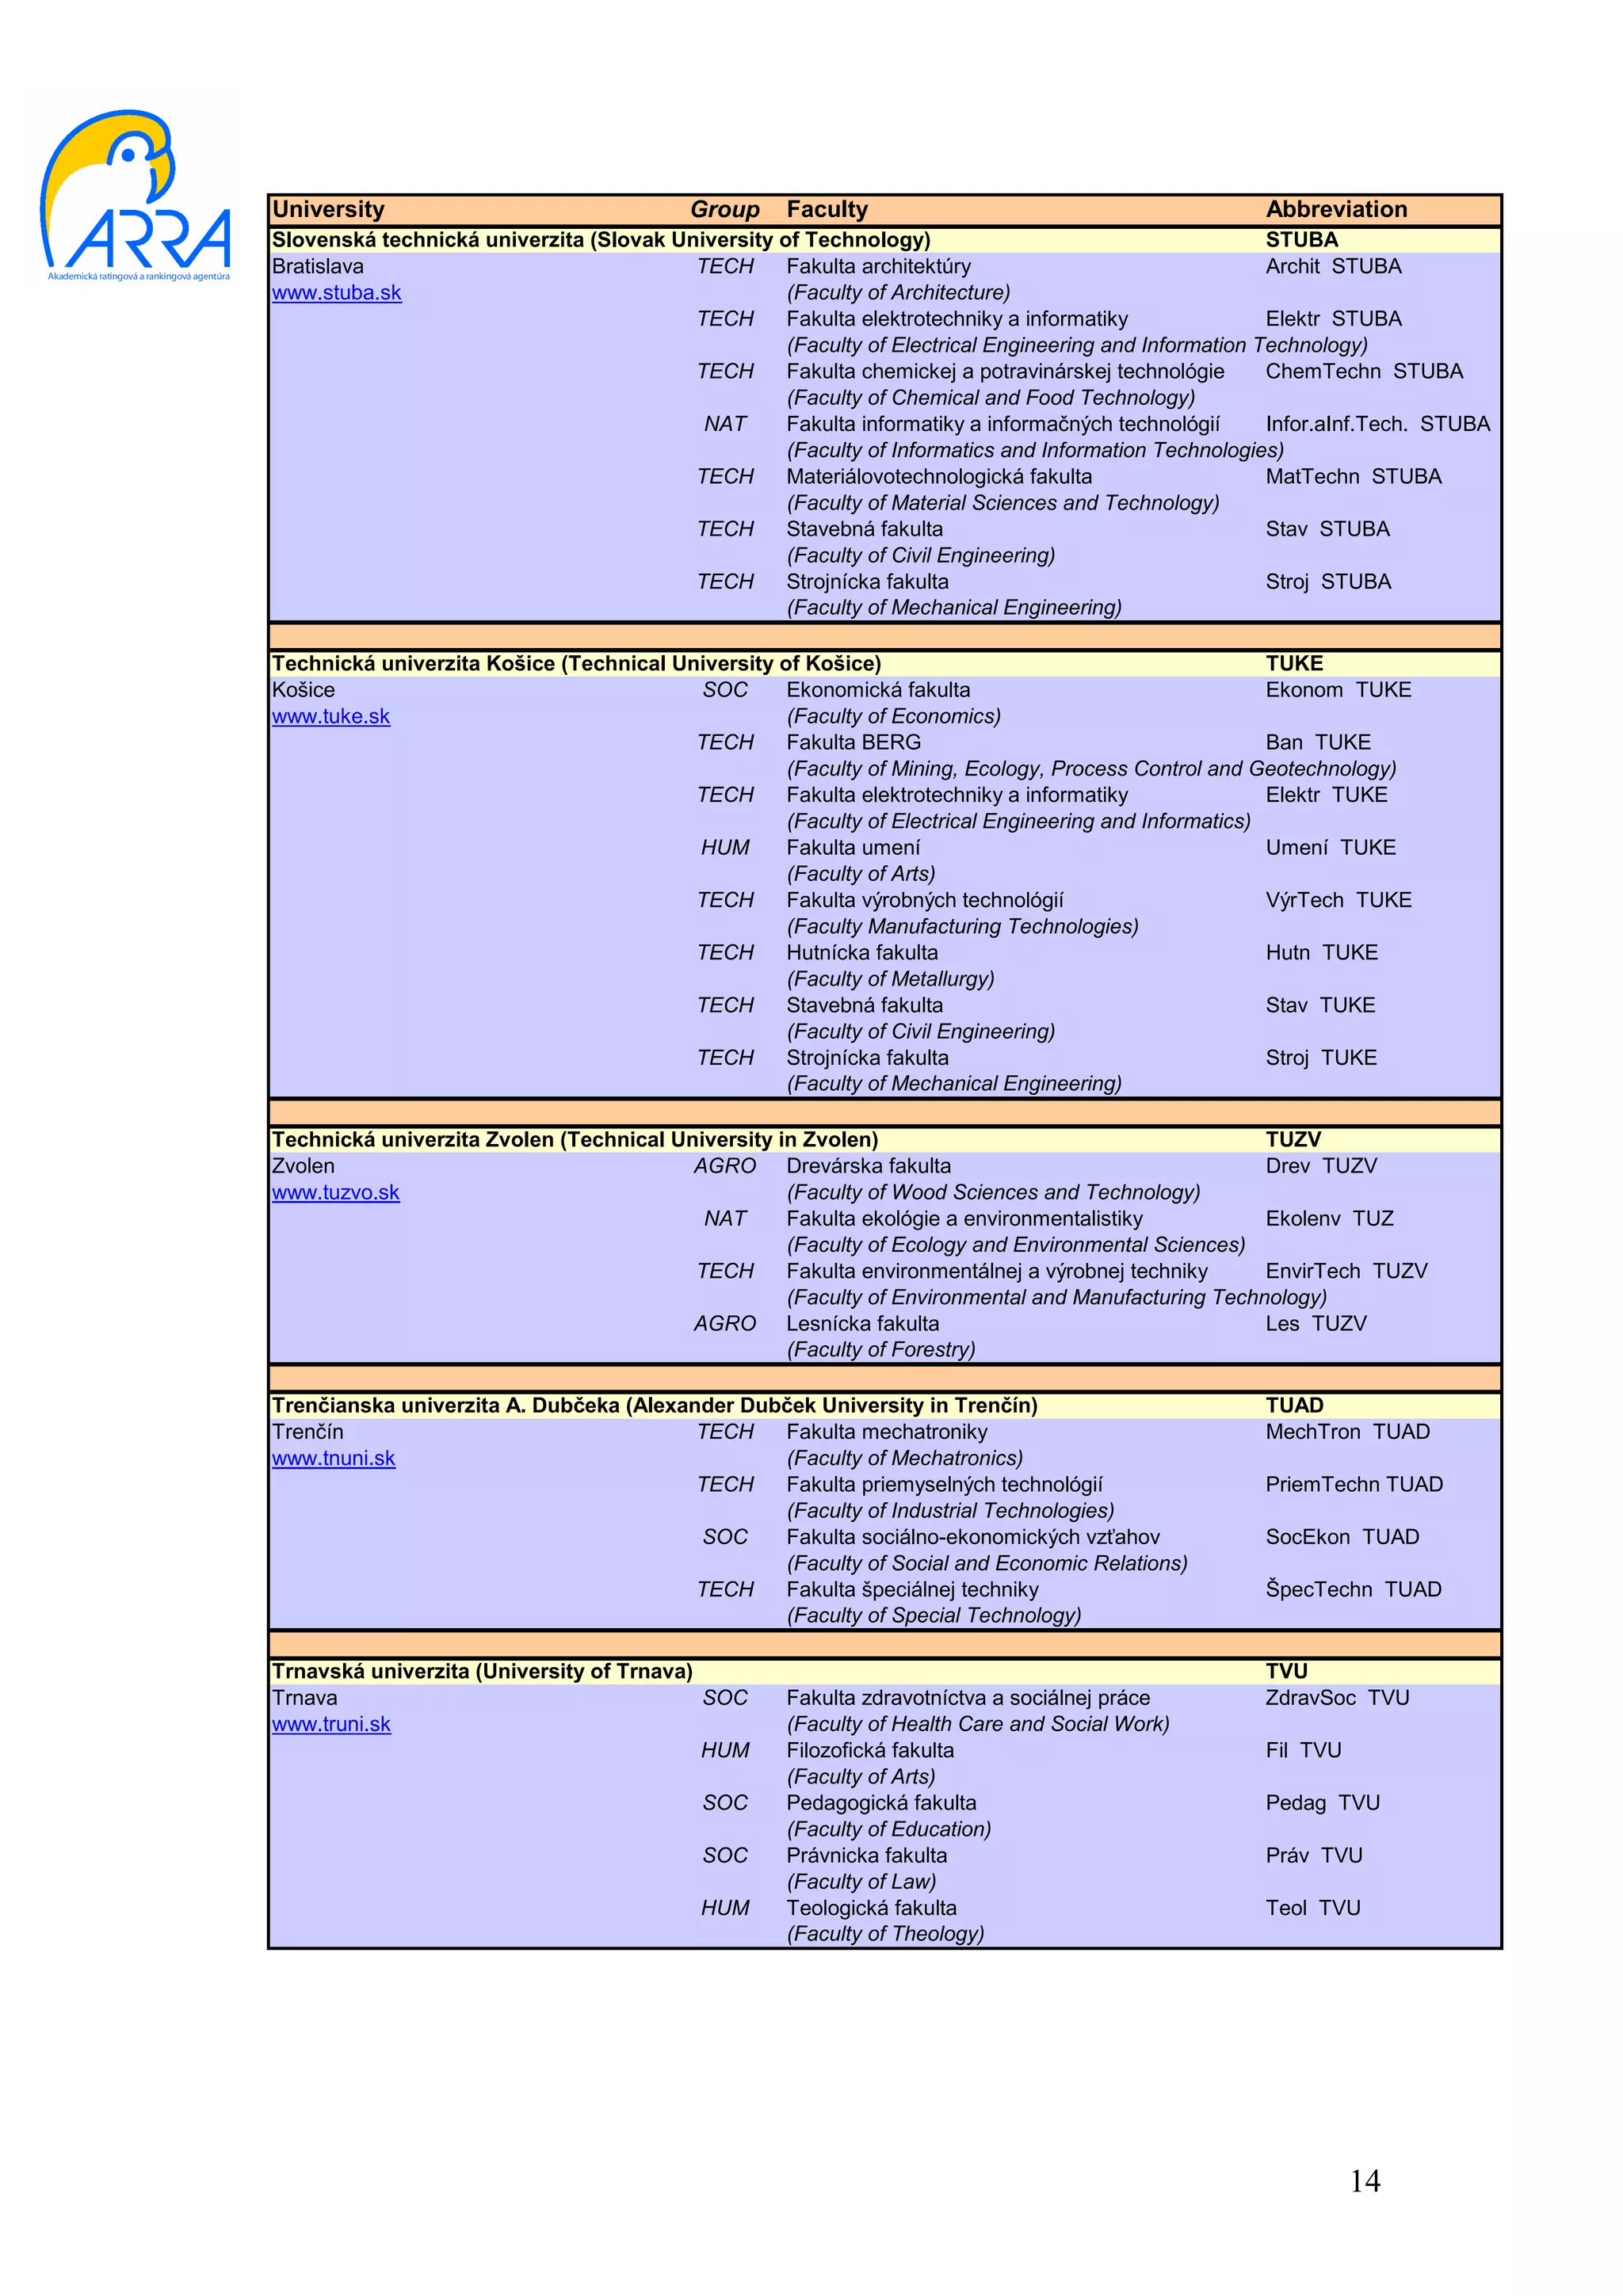
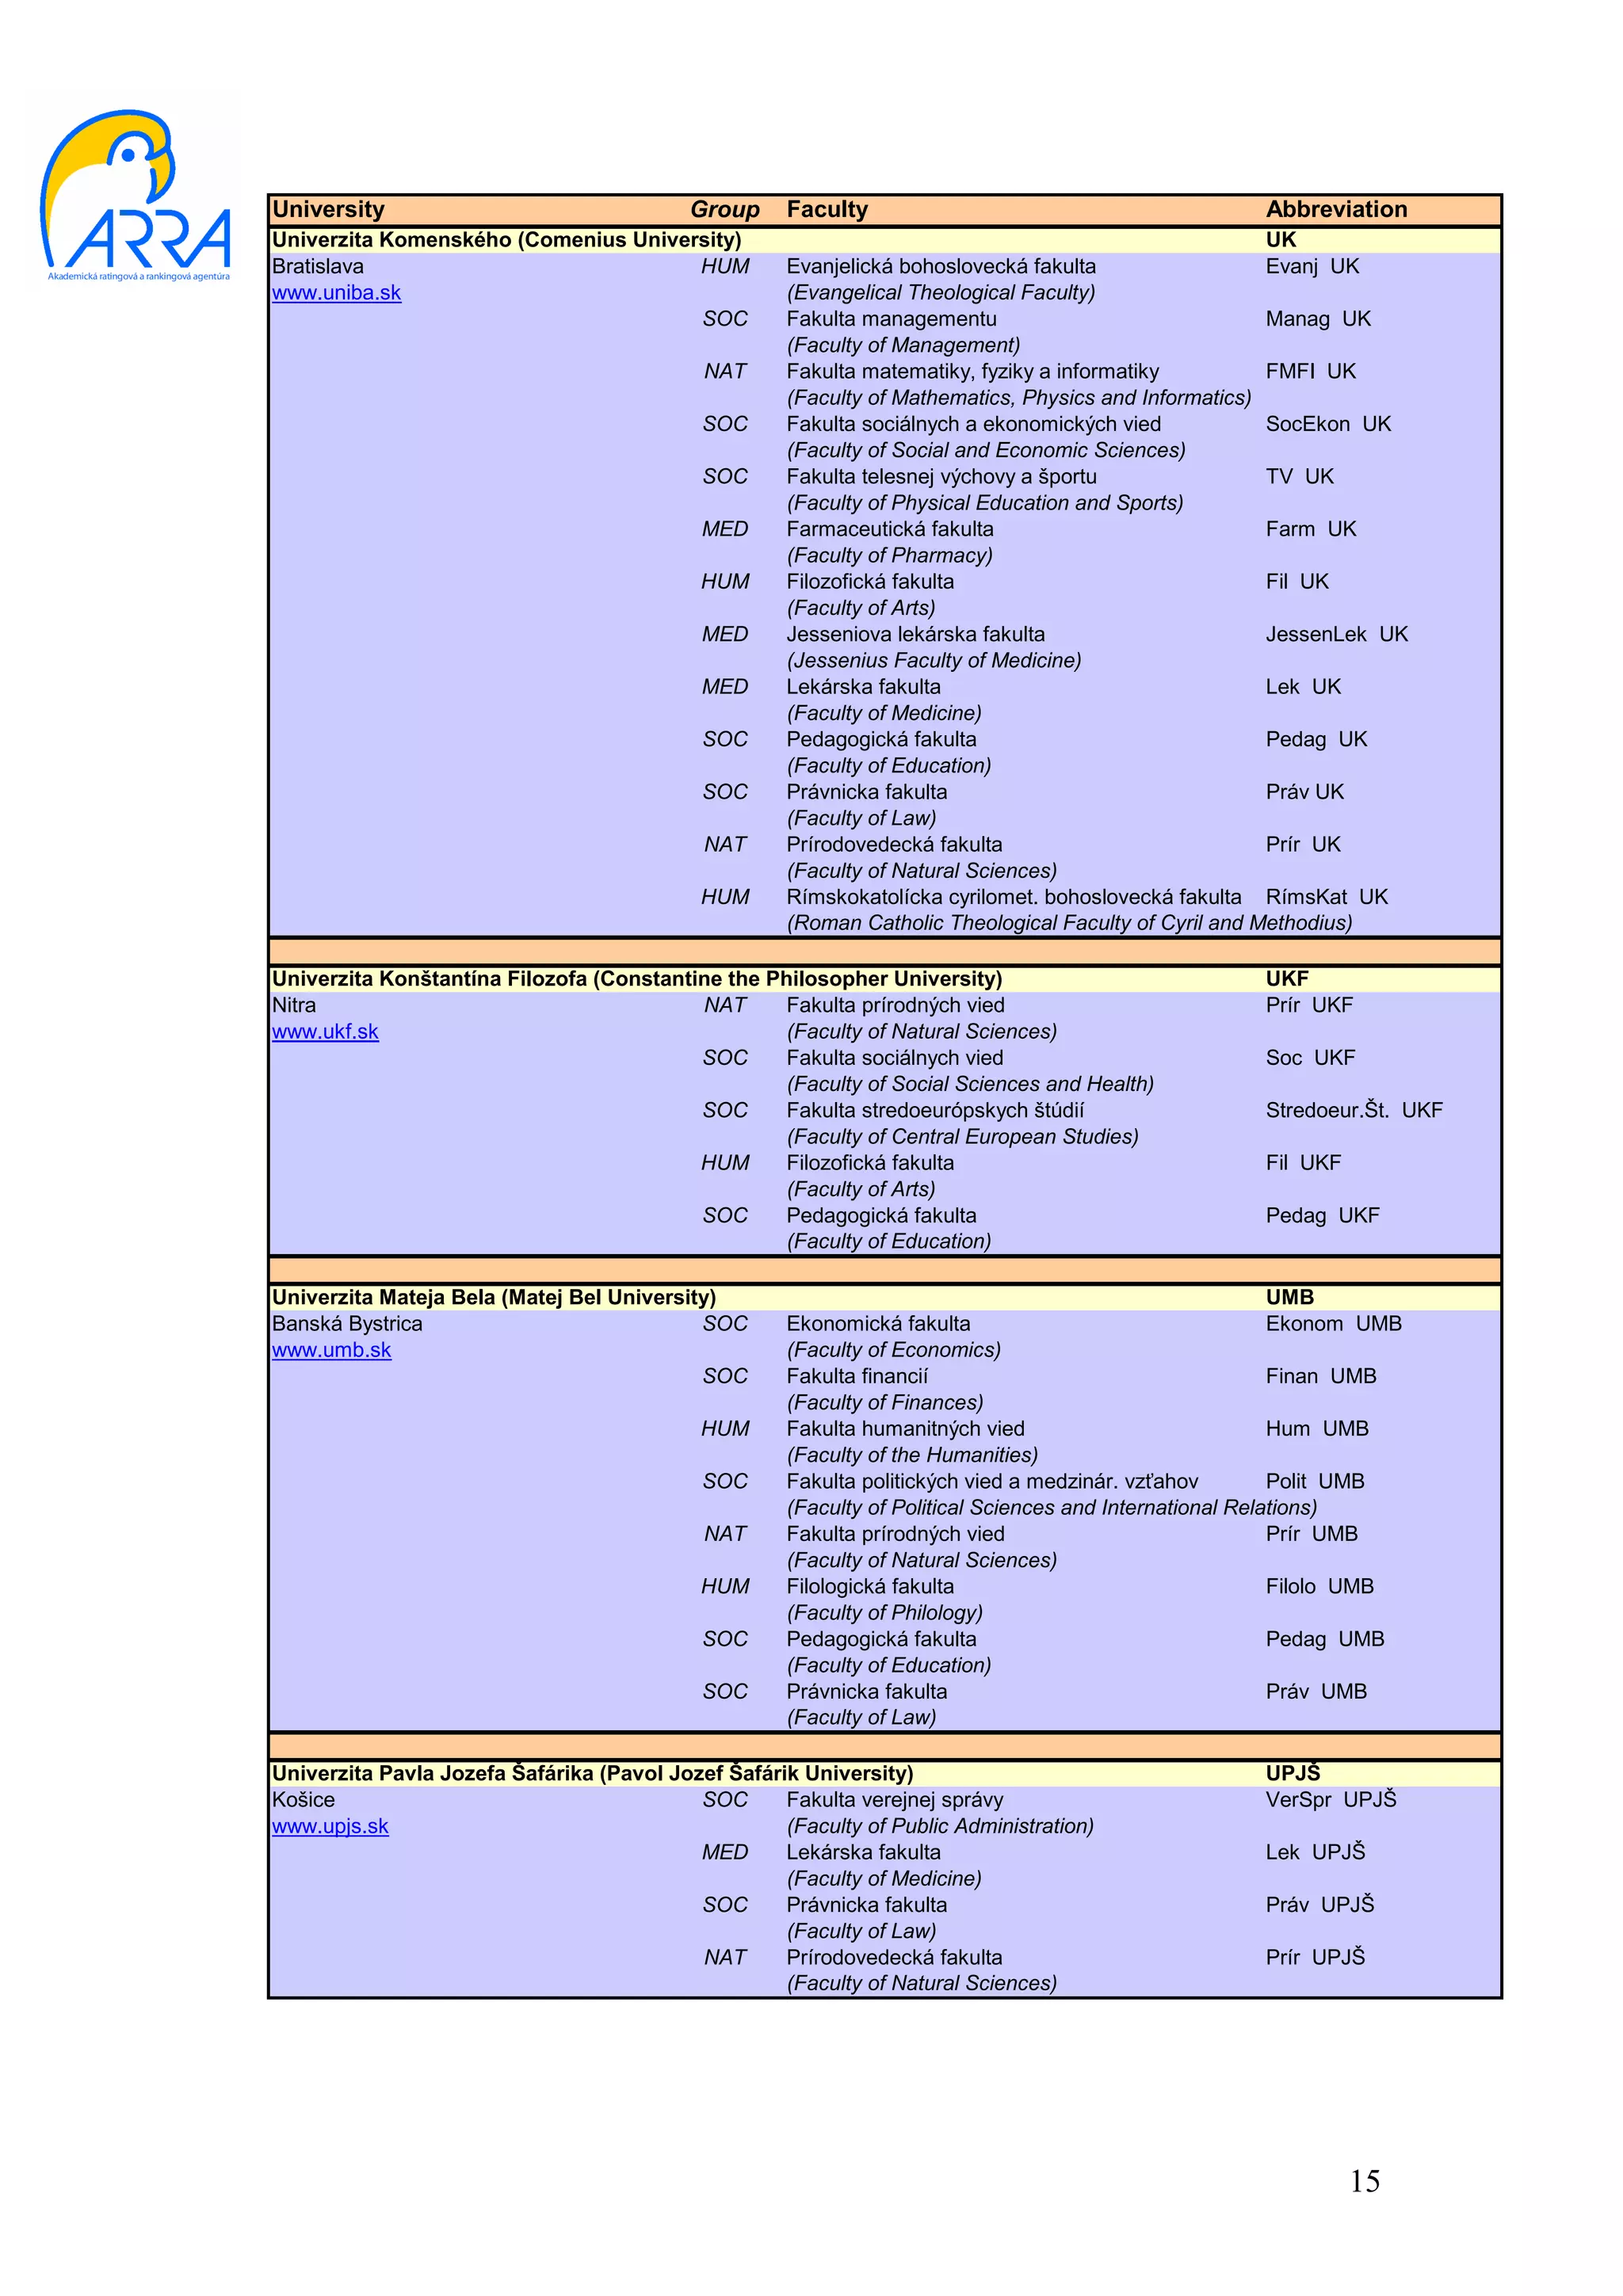
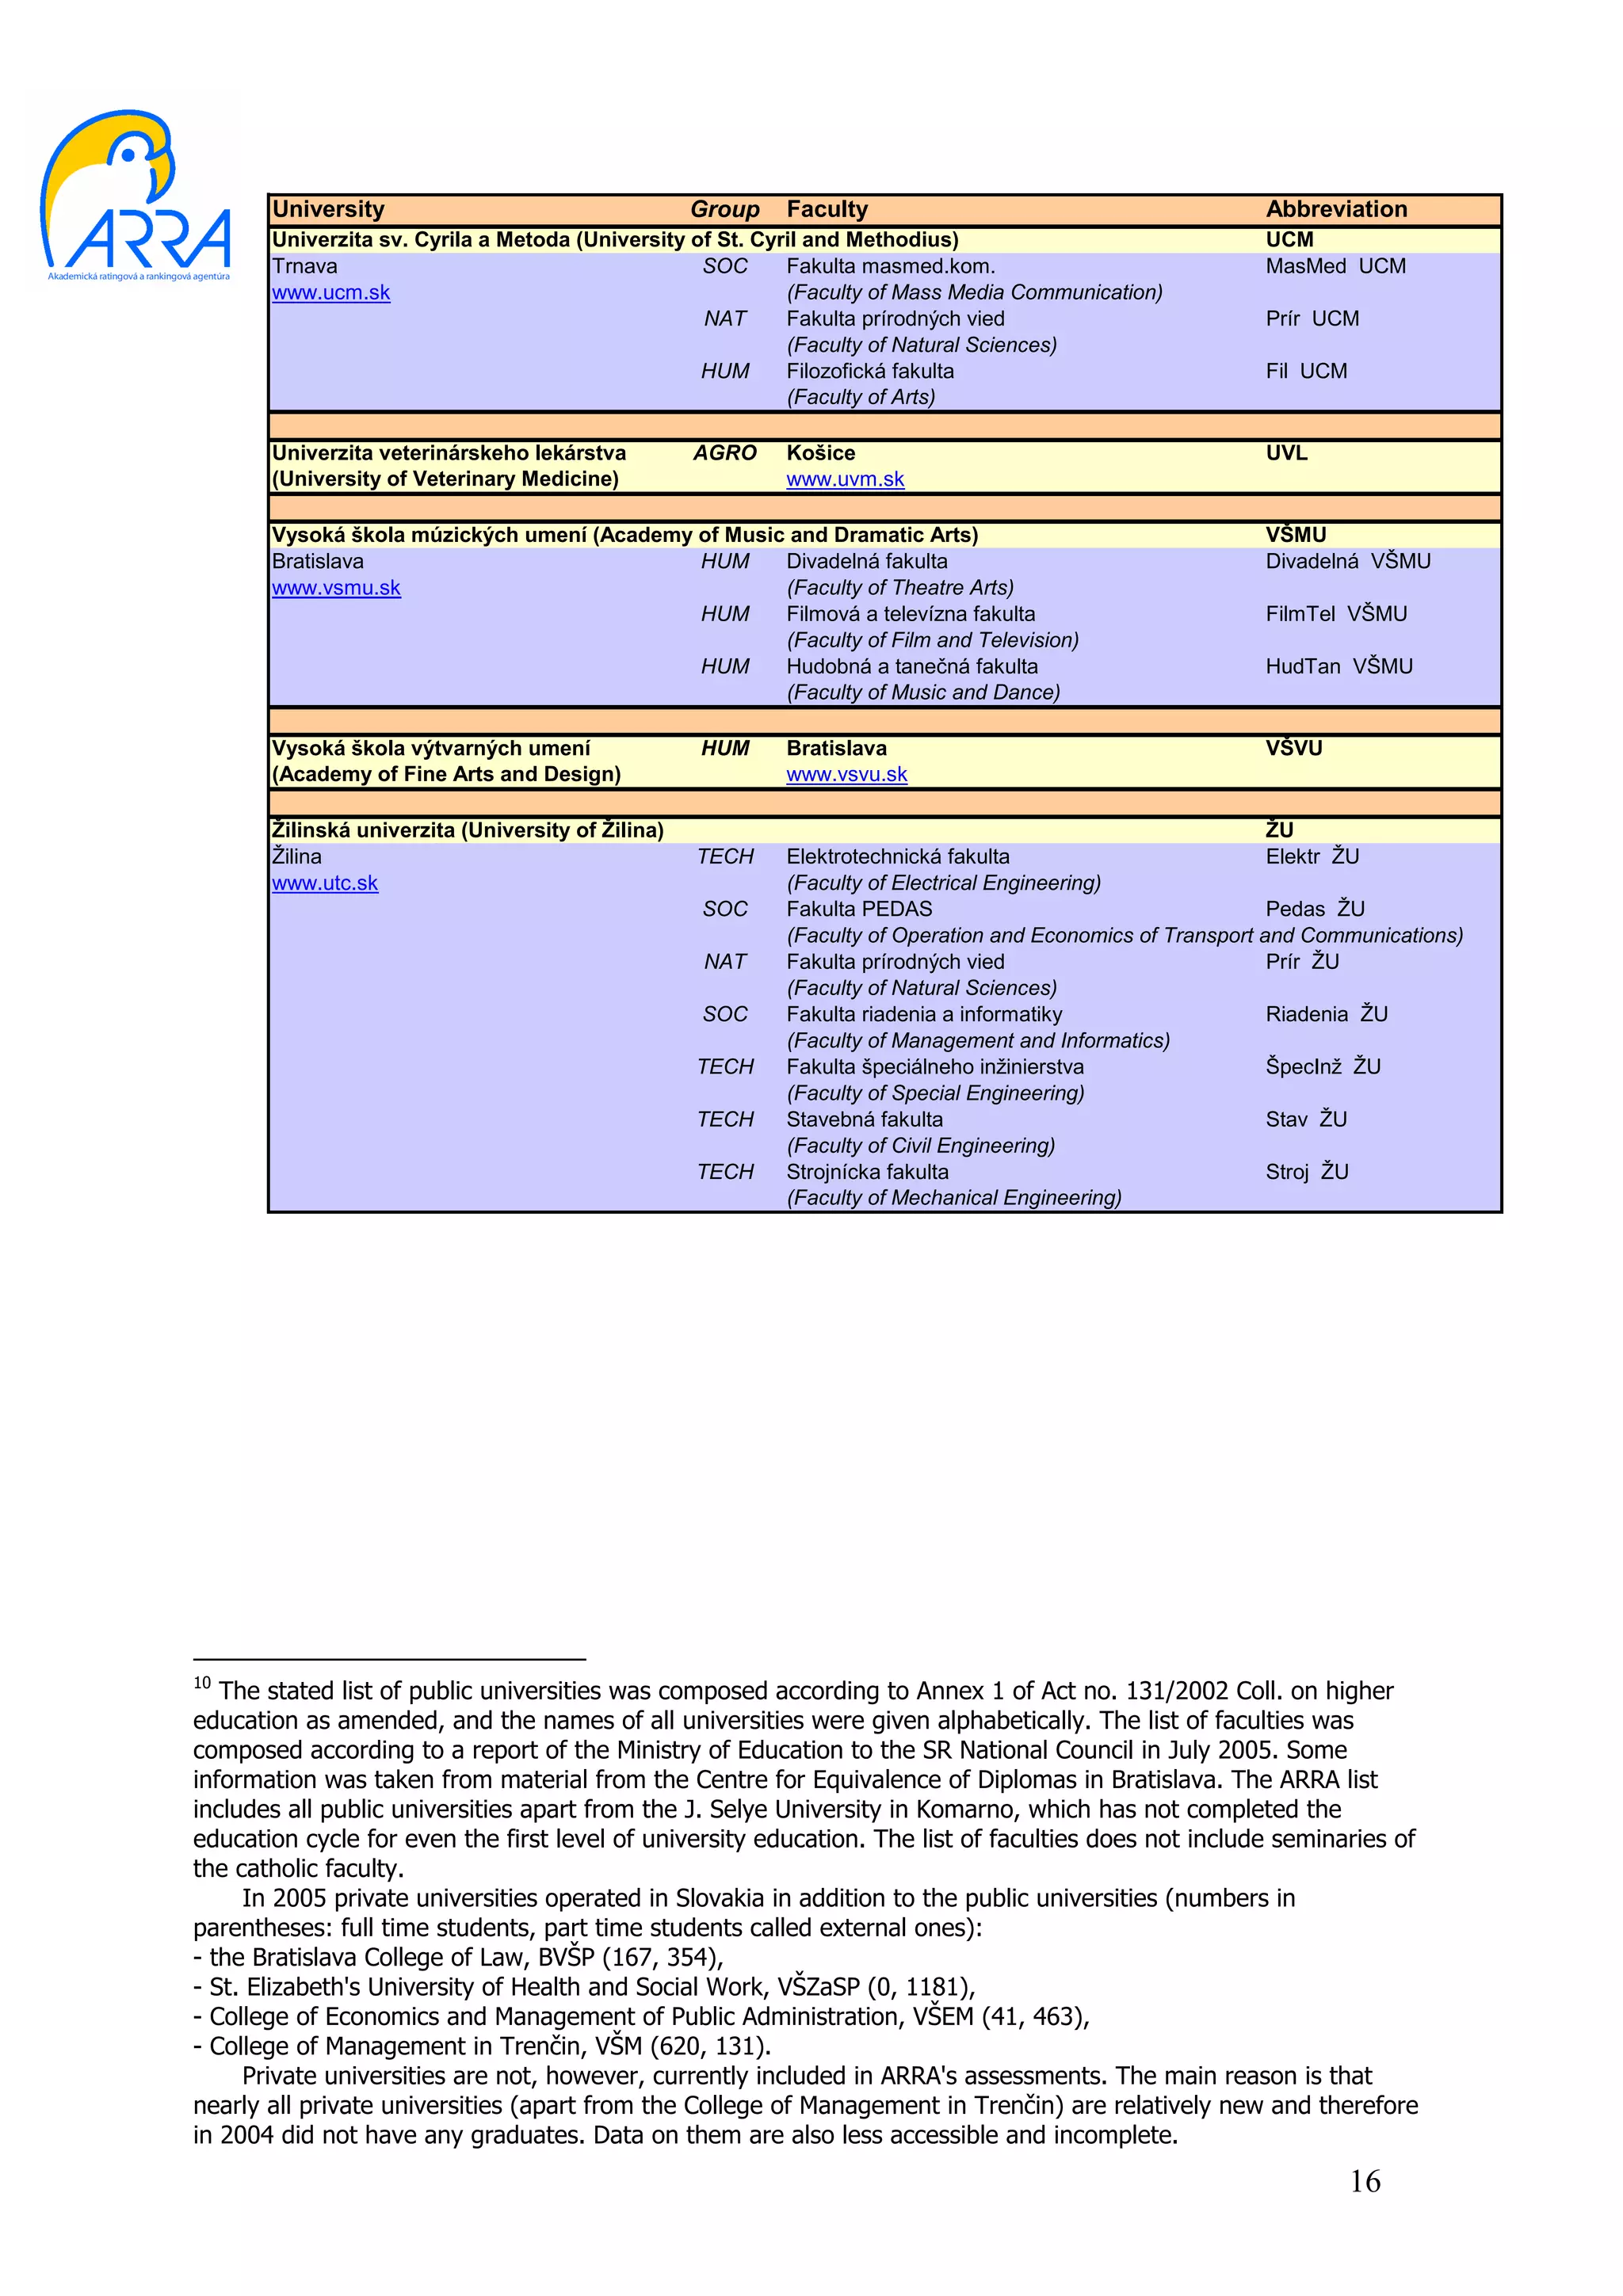
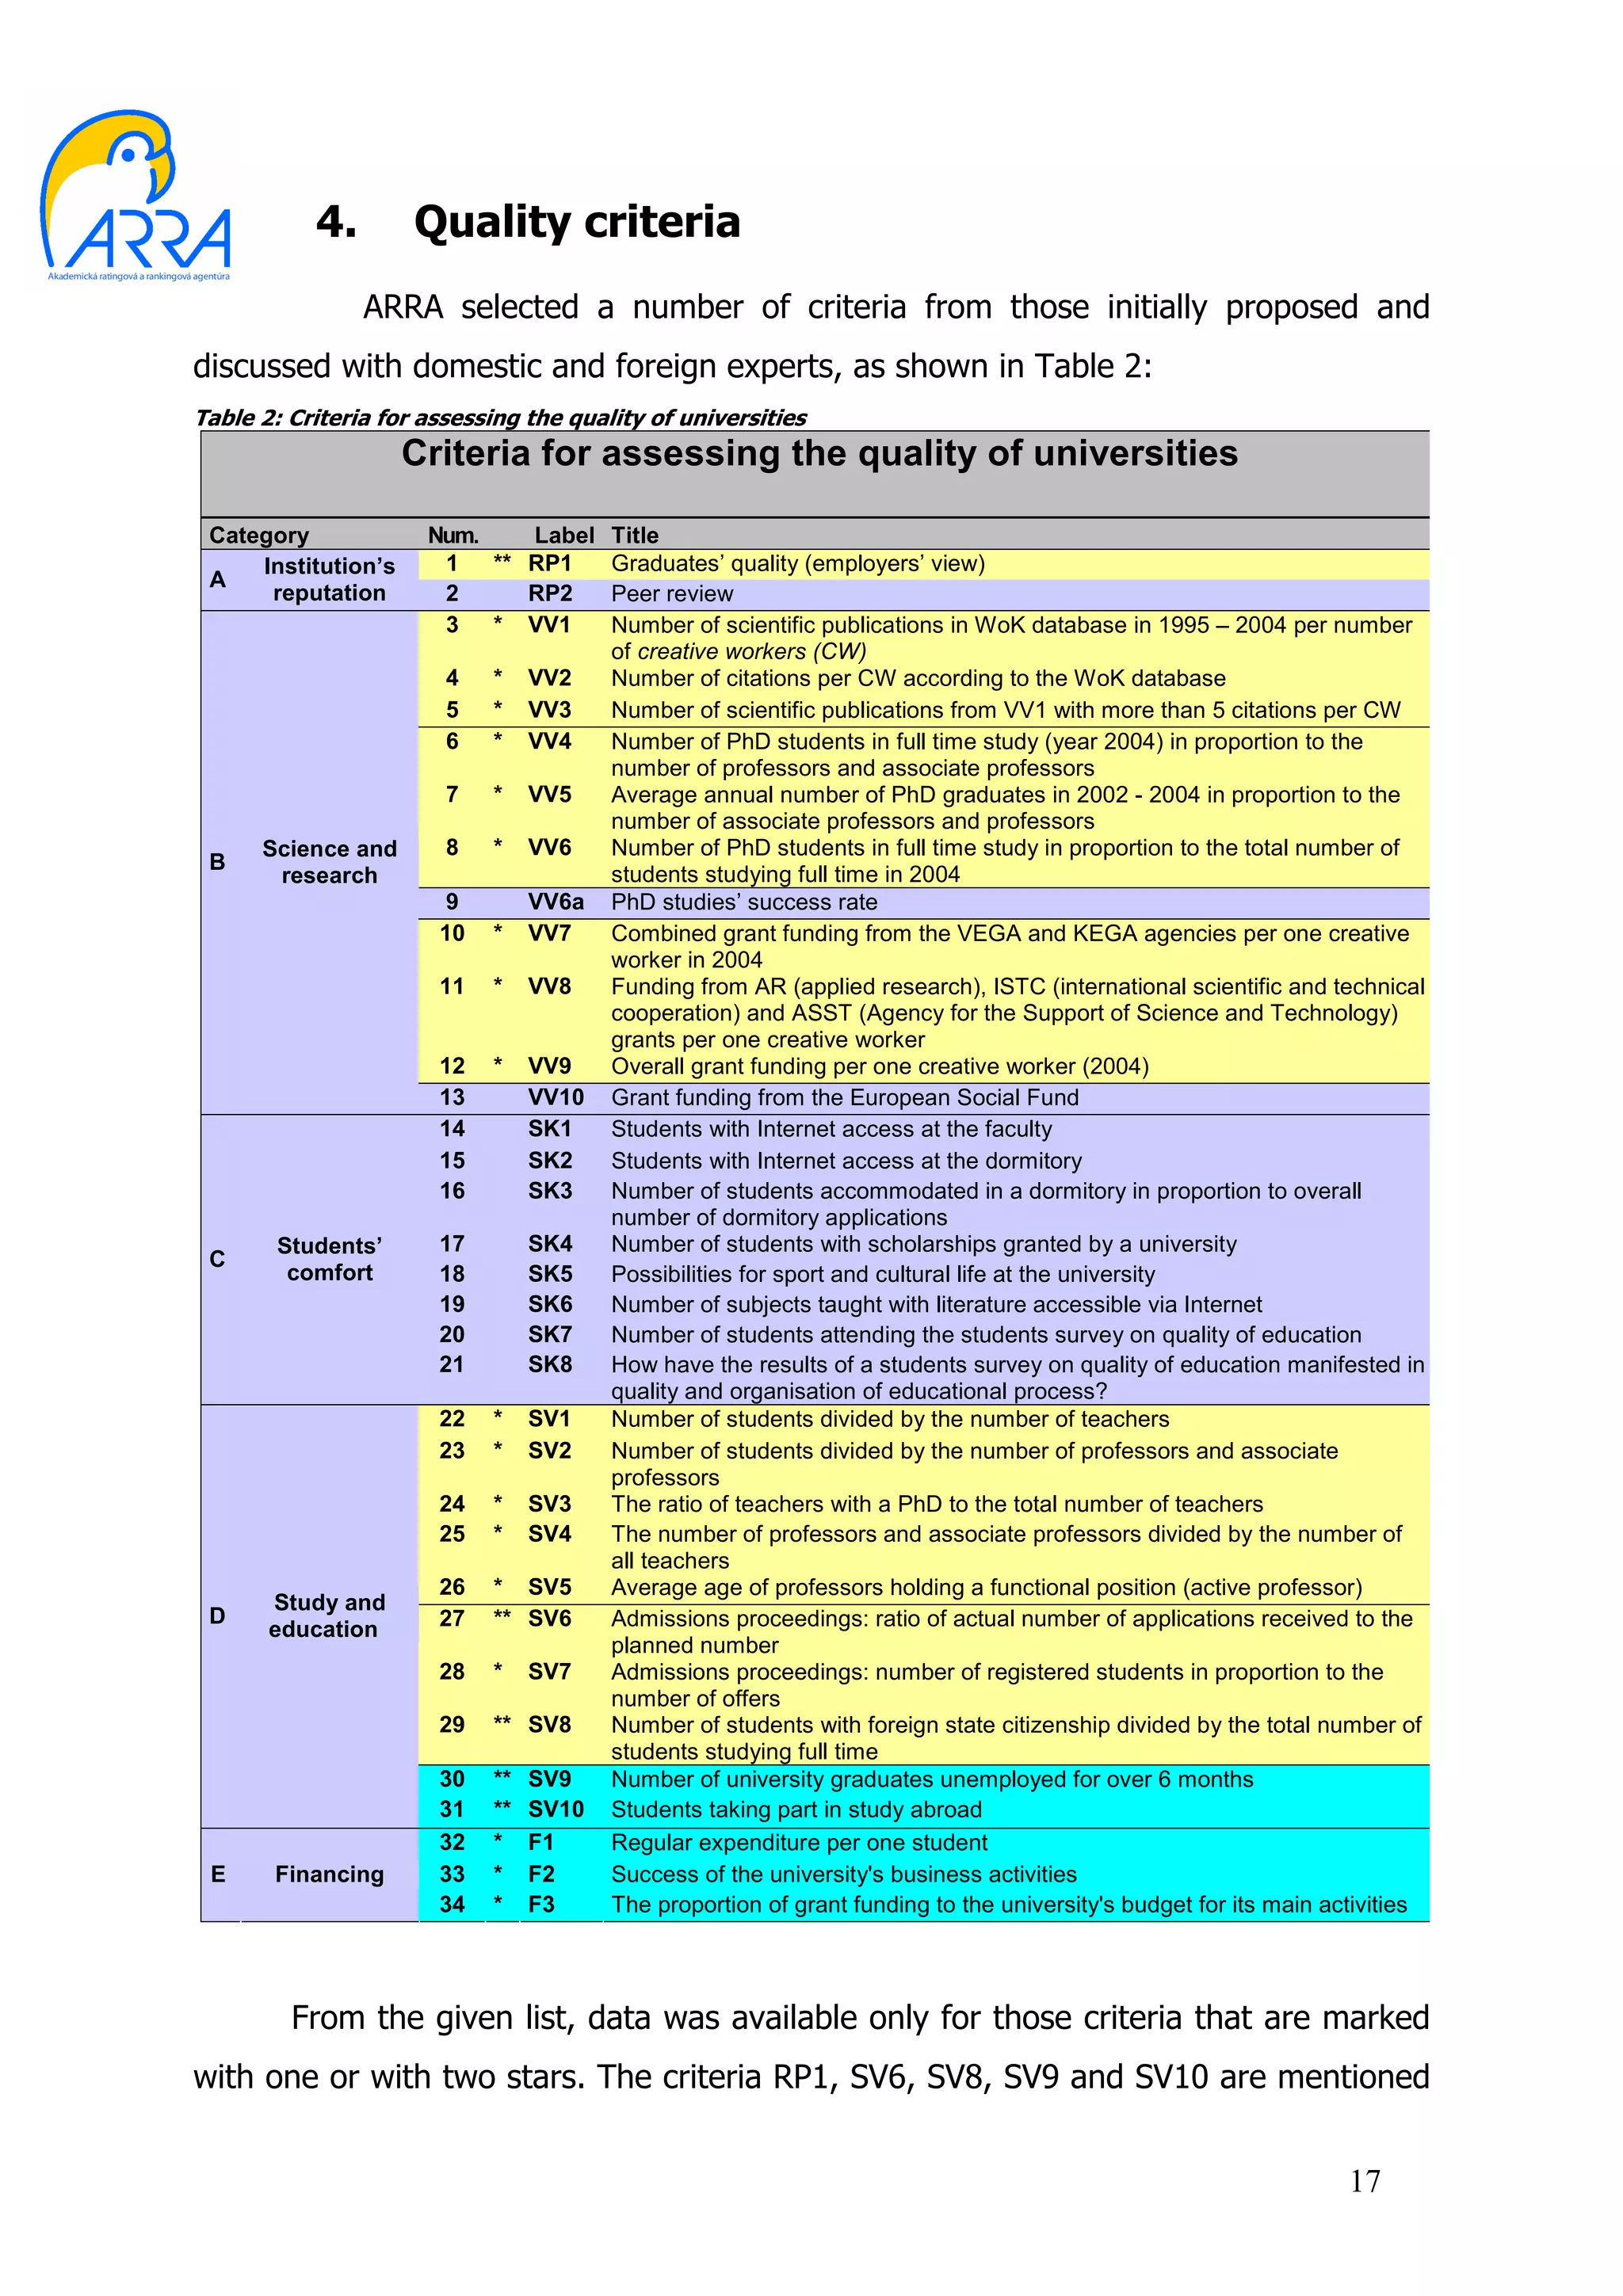
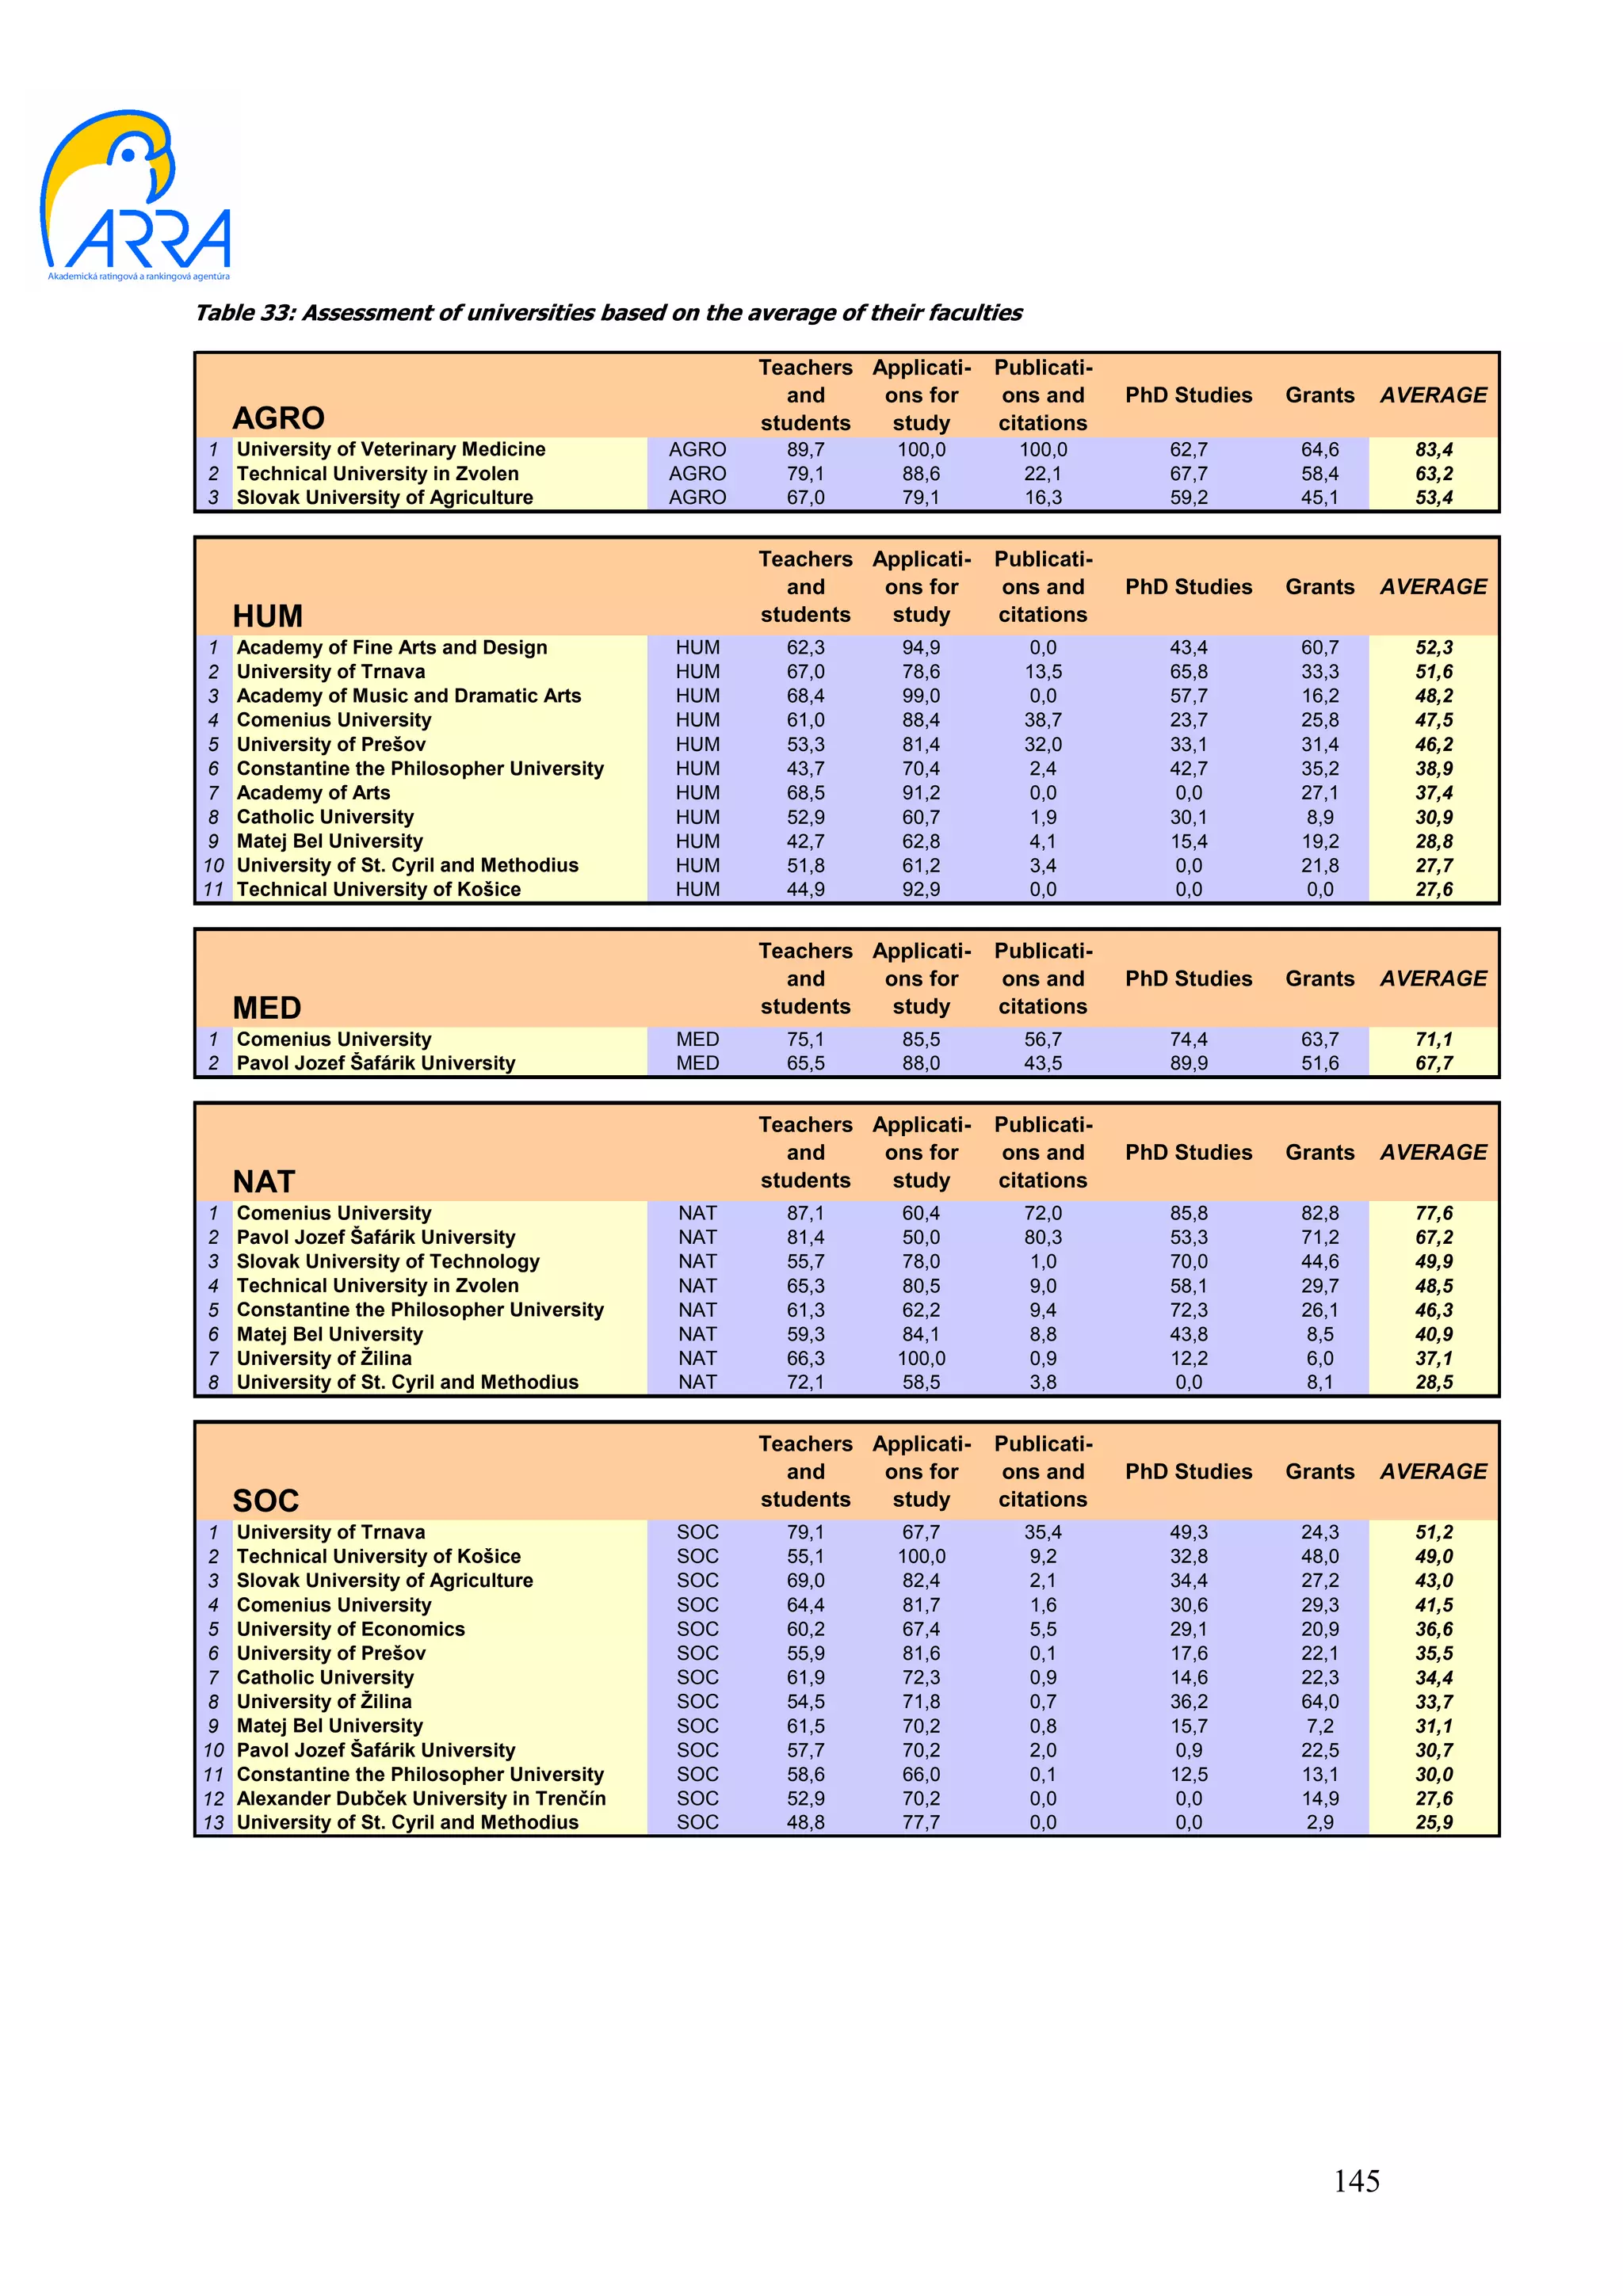
Report
Assessment of public universities and their faculties
                       (2005)


           (c) ARRA, Bratislava 2005

                                                        1
The report includes results of the project „Quality assessment
                     of research and development at the universities and
                     institutes of Slovak Academy of Sciences in Bratislava
                     Region“, financed by European Social Fund.


This report originated also with financial aid of the following organizations:


        www.pss.sk                    www.luba.sk                  www.orange.sk


     www.worldbank.sk                www.yhman.sk                    www.hp.sk


Medial partner of ARRA is:


www.trend.sk
The authors of this report would like to thank the members of the Board
of Trustees of ARRA, the Board of Advisors of ARRA, in particular prof. Brunovský,
prof. Šucha, prof. Štich (the chairperson of the Board of Advisors), doc. Ferák, prof.
Šlachta and others, and also Ing. M. Beblavý, the members of the Board of Trustees
(in particular the chairperson Ing. J. Kollár) for their critical but always relevant
comments, and also for frequent discussions, analyses and reviews of draft material
in the production of the report. One of the factors that enabled ARRA to produce the
following analysis was the fact that the SR Ministry of Education publishes a great
deal of material and information about higher education. We would like to thank doc.
RNDr. Peter Mederly, CSc. for his valuable discussion of this material. Conversations
with Don Thornhill and Lewis Purser, experts that the World Bank arranged for
ARRA, made a significant contribution to developing the criteria and the methodology
used in the report, and they also deserve our thanks. We would like to point out,
however, that the opinions presented in the following report are not necessarily
identical with those of the persons named here.
      The ARRA Agency was able to carry out its activities thanks to contributions
from its sponsors, in particular Prvá stavebná sporiteľňa, Orange Slovensko, Ľudová
Banka, the World Bank, HP and others. The assessment of the work of the Bratislava
faculties of universities was supported by a grant from the European Social Fund.


                                                                                 2
Introduction

        When officials started to assess research in higher education in Great Britain in
1980 (the Research Selectivity Exercise [RSE], later the Research Assessment
Exercise [RAE]), their aim was not only to increase universities' accountability to the
general public for their activities but also to map their scientific activity and compare
it with that of foreign institutions. It is noteworthy that although this process that
was initially greeted with a degree of mistrust and resistance (like every reform) by
the academic community in particular, not only did it bring about an increase in the
number of relevant scientific publications and citations1, but in 2000, when the most
recent assessment took place, 55% of higher education workplaces were ranked in
the highest category of assessment. One of the factors in the success of the British
system was that the results of assessment were and are directly linked to the
financing of higher education2. This experience shows that the assessment of quality
is an instrument for achieving goals and not a goal in and of itself. In addition, in
other countries as well as Great Britain there is an independent system for the
evaluation of universities, which determines their ranking according to predetermined
criteria.
        In Slovakia there is as yet no functioning system of this sort. There has been
no institution or organisation (either state or non-state) that would systematically
address the evaluation of research and educational performance in higher education
according to clear criteria set in advance that the general public can understand,
drawing on information that is in the public domain or which can be easily obtained
(e.g. using Act no. 211/2000 Coll. on free access to information).
        This is not a role carried out even by the Accreditation Commission, the
government's advisory body. The Accreditation Commission has different tasks and
objectives3. At present, although the SR Ministry of Education is trying to introduce
RAE-like procedures in the complex system for accrediting universities, this is taking
a relatively long time to be put into practice and make an impact. This system may
also seem a little ponderous to the general public, as it is planned to carry it out in


1
   The Times Higher Education Supplement (THES), 1 July 2005, p. 4.
2
   Adams J., Science 296, May 2002, p. 805.
3
  Section 81 and following of Act no. 131/2002 Coll. on Higher Education and changes and additions to certain
acts.
                                                                                                           3
six-year cycles. This means that in our fast changing world the information used
     in a given evaluation may not necessarily reflect the current situation in the
higher education market.
   In Slovakia as in other countries, there is increasing pressure to enable the
general public (including prospective university students, their parents and
employers) and even the government and parliament to gain fast and easy access to
a comprehensible overview of selected indicators that characterise or describe the
quality of universities and/or their faculties. This pressure has increased sharply since
the government tried to introduce financial cooperation by students in their
education (tuition fees) as part of their reform package. This pressure also led to the
creation of the civil association the Academic Ranking and Rating Agency (ARRA;
www.arra.sk) at the end of 2004, although the idea of it has been forming for a
number of years. It is not surprise that it was founded by former student leaders
from the 1996 – 2002 period, who gained their own experience of study not only in
Slovak higher education, but also abroad. This allowed them to compare the quality
of tuition at home and abroad and to see that Slovak higher education is really in
need of change. It needs it above all to enable its institutions to compete in an open
European market against universities, which are already actively recruiting our
students (e.g. branches of foreign universities but also Czech and Austrian
universities).


                                                                                    4
1.     ARRA – independent evaluation of
               universities

      The Academic Ranking and Rating Agency (ARRA) is the first independent
Slovak institution to decide to provide the public with regular reports on the quality
of individual universities in Slovakia and information comparing them with each
other. ARRA provides this information by fulfilling its objectives and abiding by
quality evaluation procedures agreed in advance.
      The objectives of the ARRA civil association include:
                  •      providing the public with information on the quality of individual
                         universities in Slovakia,
                  •      introducing a method of assessing the quality of education
                         provided by universities in Slovakia,
                  •      creating an independent evaluation of the quality of education
                         provided in individual study programs and fields of study in
                         universities in Slovakia,
                  •      regularly ranking universities, the affiliated faculties and sections
                         by the quality of the education the provide and the quality of
                         their research and development ("ranking"),
                  •      assigning universities a rating based on the level of quality of
                         their individual activities,
                  •      attempting     to   stimulate   competition    between     individual
                         universities and their faculties.
      The role of the agency is not to replace the duties and tasks of the SR
government Accreditation Commission.
      The procedure that ARRA has used in assessing public universities (when
talking about Slovak universities from now on, only public institutions will be referred
to) in Slovakia in 2004, was based on the following steps:
      •    the selection of indicators for the quality of education and research in
           individual universities and the assignment of a certain number of points to
           each faculty for the performance in this or that indicator (indicators are
           arranged into groups and each group of indicators gained a certain number
           of points),

                                                                                         5
•    the division of faculties into six groups according to the so-called
                      Frascati Manual (details given below) in order to compare only
               faculties that have the same orientation and similar working conditions,
           •   assigning points scores to faculties (the ranking of faculties in individual
               groups according to the Frascati Manual is based on average points score
               in individual groups of indicators),
           •   the calculation of the points score for universities (universities are ranked
               according to the average points gained by their faculties).


           The criteria (or indictors) by which ARRA produced its ranking focus on the
intensity of "performance" and not on overall performance. For example, one of the
criteria is the total number of publications by the given faculty listed in the Web of
Knowledge database produced by the company Thomson Scientific Co. divided by
the number of creative workers in the faculty (teachers and researchers). If the
number of creative workers did not divide the overall number of publications, the size
of the faculty would be the main influence and not the intensity of its work.
           The selection of criteria was also influenced by the fact that ARRA used only
information in the public domain and did not, at least in its 2004 evaluations, request
information from individual faculties.
           ARRA views the assessment of the performance of universities and faculties
for 2004 as a pilot project. ARRA's results for 2004 will be analyzed in detail and this
analysis will be used to prepare the assessment of public universities in future years.
           The ranking produced for the assessed institutions is drawn from
incontrovertible official data and domestic and foreign sources in the public domain.
           Since 1 May 2004, Slovak universities are part of the EU higher education area
and this has brought with it not only rights but also obligations, including the
obligation to maintain and increase the quality of all their activities. Slovakia fully
accepts the much-cited Bologna Process, which aims, amongst other things, to
increase the competitiveness of European higher education in comparison with other
parts of the world and has even incorporated it into its legislative system4. Quality
higher education is the key to building a knowledge economy in Slovakia and will
bring about the necessary structural changes in the country's economy over the

4
    Act no. 131/2002 Coll. on Higher Education and changes and additions to certain acts.
                                                                                            6
medium term. To this end, universities need to ensure balanced quality in their
     educational and research activities. We are convinced that full use should be
made of any instruments that can contribute to the achievement of the objectives for
the increased quality of Slovak universities so that Slovak universities keep up with
the national and international competition and attract students from both Slovakia
and abroad.


                                                                                7
2.     The history and role of ranking and
                  experience of it in other countries

          The history of ranking is not a very long one. The first institutions to be
ranked were a selection of American colleges in the magazine U.S. News & World
Report in 1983. The phenomenon grew rapidly however, and not only in the Anglo-
Saxon countries (e.g. in Great Britain in the Times Higher Education Supplement, the
Times Good University Guide, Guardian, Financial Times etc., in Canada McLean's),
but also in other parts of the world (in Germany Stern, Spiegel and DAAD, in Japan
Asiaweek [until 2001], Asahi Shimbun, in Poland Wprost, Perspektywy, Polityka, in
Switzerland Swisup!, in China the Higher Education Institute of Shanghai Jiao Tong
University among others). There is quite a good overview of the sources on ranking
on the Internet5, where one can also find very specific evaluations e.g. for law
faculties or institutions providing education in economics or MBA degrees (Master of
Business Administration). In fact, even in Slovakia we have noticed attempts by
some media to produce such an evaluation (SME, Hospodárske Noviny, TREND,
.týždeň, Národná obroda, Pravda, TA3, Slovenský rozhlas, STV...), although these
have been incomplete and focused on only a part of the problem.
          The basic and common characteristic of all foreign approaches is that they
attempt to provide information to the general public, in particular to prospective
students, in order to help them select a suitable school or faculty and/or area of
study or study program. Ranking is not in principle an activity carried out for its own
sake to put universities into "some sort of" order (although such evaluations are also
published) but ranking is or tries to be an aid for people who are choosing a place to
study and need orientation in the education marketplace. No ranking system can
automatically identify the best faculty or university for an applicant but the
information provided can be of great assistance in their decision-making. Research
has shown that at present that the position of a school in this or that ladder is a
secondary factor in their choice of where to study. The main factor is whether the
given faculty or university will enable them to study the area of study or study
program that they are interested in. It is only after that – if there are a number of
providers – that they start to consider other criteria such as the availability of

5
    http://ed.sjtu.edu.cn/rank/2004/Resources.htm
                                                                                  8
accommodation, the costs associated with study, the attractiveness of the place
     of study, the options for sports, cultural and other activities and also the
standing of the faculty or the university among other institutions. In addition to
providing information to the public and prospective students, assessments of quality
aim to increase competition among universities through their output so that – as in
the world's advanced economies – prospective students are guided not only by the
geographical proximity of a university but also the quality of the education that it
provides. We expect that the importance of quality factors will increase hand in hand
with the complexity and the technical and intellectual demands of the Slovak
economy.
      The second common characteristic of assessments is that although they use
different numbers of criteria, there is nearly always a relatively small number of
groups of criteria that reflect the institution's performance in research and education
and related parameters, perspectives on the institution from within (students and the
academic community) and also from outside (e.g. employers, or even the school's
own graduates).
      Another very important characteristic of ranking is that every such assessment
must always be looked at in terms of the criteria that it uses. In other words, every
ranking corresponds only to the criteria that are chosen and used. In addition every
compiler (but also every reader) may consider (and then also makes) certain
indicators significantly more important than others (e.g. research performance is
given a higher value than, say, the number of students per teacher) and may
therefore give them a different weighting, which can in turn make a fundamental
difference in the ranking of the faculties and universities in "his or her" resulting
table. For this reason ranking provides an image of the university and its status
alongside other universities entirely in terms of the selected indicators. For this
reason also, everyone involved in creating ranking tries to choose a range of criteria
and indicators that will be relevant to the broadest possible group of recipients.
      A number of universities insist that this form of comparison has limited
significance because every university is unique and special in some way, or has its
own specific characteristics. We can agree with the claims of uniqueness to some
extent. However, if there are, for example, 4 faculties of law, 5 faculties of
philosophy or 3 faculties of medicine, providing the same degree for the same form

                                                                                     9
of higher education, it seems natural that we should ask which of them is the
      best in their group.
         This issue has given rise to other common arguments against ranking, that it
is not possible to compare the incomparable, such as universities with 13 different
faculties and a highly focused institution which is not even divided into faculties. This
objection is acceptable. There is, however, a reasonable solution to this problem.
Since 1963, the OECD countries (the Organization for Economic Cooperation and
Development) have categorized systems of subjects in science and technology
according to the Frascati Manual6, whose current version dating from 20027 divides
such subjects into 6 groups:
a) natural sciences,
b) engineering and technology,
c) medical sciences,
d) agricultural sciences,
e) social sciences,
f) humanities.
From 1 June 2005 this division will be included in Slovak law8, i.e. also in the Slovak
research community.9
         After the introduction of such a division into the ranking, it is clear that
theological faculties will not be compared with medical faculties or technically
oriented faculties with social science faculties. It will be possible to compare faculties
with the same scientific orientation side by side. Prospective students will thus be
able to determine which is the best faculty providing education in their area of
interest.
         The quality of a university is also determined by the quality of its faculties
(apart from the University of Veterinary Medicine and the Academy of Fine Arts,
which have no faculties and are therefore assessed as a whole). It is therefore quite
natural that the final ranking of universities depends on the quality of its

6
  The authorship of this manual is quite often attributed incorrectly. Because the first meeting of OECD experts in
this matter took place in 1963 in the Italian village of Frascati, the work that was created there was called the
Manual from Frascati or The Frascati Manual.
7
  Frascati Manual, 6th Edition, OECD 2002, Paris, p. 67.
8
  Act no. 172/2005 Coll. on the organisation of state support for research and development and additions to Act
no. 575/2001 Coll. on the organisation of government activities and the organisation of the central state
administration as amended.
9
  A more detailed breakdown is given in the International Standard Classification of Education (ISCED) 1997,
UNESCO, November 1997.
                                                                                                            10
components. Another reason for the use of faculties as the basic unit for
     ranking is the fact that there is practically no university covering all fields of
study in Slovakia. When assessing such universities it can also happen that the final
result will be a certain weighted average of the quality of individual components of
the university and that the weighting of the excellent faculties may not be enough to
balance the weaker ones, or vice versa, the quality of the excellent faculties may
cover for the weaker ones. Precisely for the reason the ranking of universities is
carried out at the end, to make clear their strengths and weaknesses. It is up to the
university itself whether to take measures to increase the quality of its components,
so that the better faculties do not suffer because of the weaker ones. That such a
system is able to function successfully is shown by the example of Great Britain and
its RAE system.
       In the final analysis, it is up to prospective students to decide, just as
employers must decide when employing graduates. And it is always better if
decisions are taken on the basis of accessible and verified data rather than
traditional, often inaccurate and incomplete information or rather feelings associated
with to this or that institution.
       An essential public requirement is also an answer to the question as to what
use universities make of their public funding and how effectively they manage them.
For example, for 2003, the National Council of the Slovak Republic approved
subsidies for public funds to public universities amounting to SKK 8.3 billion, for 2004
SKK 9.4 billion and an extra billion for 2005 This means that in three years
universities spent at least SKK 28.1 billion from public funds. The proposed state
budget for 2006 allocates SKK 11.6 billion to public higher education. It is reasonable
to ask what quality students, graduates and society as a whole gets from this money,
i.e. whether and to what extent these funds really improve this segment of the
research and education process for which they were originally intended.


                                                                                  11
3.    Classification of faculties

      ARRA's approach in assessing Slovak universities is the same as is used
elsewhere in the world and is based on a number of pillars. The first is quantitative
information in the public domain, which is generally accepted as a reliable indicator
of academic quality. The second is an independent viewpoint and results. The third is
a group (cluster) approach to the assessment of faculties and universities. The
faculties of Slovak universities were divided into groups based on their field of study
using the definitions given in the Frascati Manual as follows:
      •    natural sciences (NAT) consisting of mathematics and computer
           sciences, physical sciences, chemical sciences, biological sciences and
           Earth and related environmental sciences
      •    engineering and technology (TECH) consisting of civil engineering,
           electrical engineering, mechanical engineering and other engineering and
           technological sciences,
      •    medical sciences (MED) including basic medicine and dentistry, clinical
           medicine and pharmaceutical sciences (nursing and healthcare are
           included in the social sciences),
      •    agricultural sciences (AGRO)           consisting     of   agriculture,   forestry,
           fisheries, veterinary medicine and allied subjects,
      •    social sciences (SOC) including psychology, economics, educational
           sciences, law, political science, nursing, healthcare, other social sciences.
      •    humanities (HUM) are history, languages and literature and other
           humanities.


      Some higher education faculties are hard to categorize into a particular
subject area due to the diversity of their components (e.g. departments), which carry
out activities lying in multiple subject areas. An example is the faculties of
philosophy, whose activities cover the areas of both the humanities and the social
sciences. They were classified according to the subject area into which the majority
of activities fall. If the dean of a particular faculty contacts us to request that the
faculty that he or she manages should be classified in a different subject area, ARRA
considers the request.

                                                                                       12
Table1: Classification of faculties (or universities) into subject areas according to ARRA10


University                               Group     Faculty                                            Abbreviation
Akadémia umení (Academy of Arts)                                                                      AU
Banská Bystrica                           HUM      Fakulta dramatických umení                         DramUm AU
www.aku.sk                                         (Faculty of Dramatic Arts)
                                          HUM      Fakulta muzických umení                            MuzUm AU
                                                   (Faculty of Performing Arts)
                                          HUM      Fakulta výtvarných umení                           VýtvarUm AU
                                                   (Faculty of Fine Arts and Design)

Ekonomická univerzita (University of Economics)                                                       EU BA
Bratislava                               SOC    Fakulta hospodárskej informatiky                      HospInfo EU BA
www.euba.sk                                     (Faculty of Economic Informatics)
                                         SOC    Fakulta medzinárodných vzťahov                        MedzVzťah EU BA
                                                (Faculty of International Relations)
                                         SOC    Fakulta podnikového manažmentu                        PodnMan EU BA
                                                (Faculty of Business Management)
                                         SOC    Národohospodárska fakulta                             NárHosp EU BA
                                                (Faculty of National Economy)
                                         SOC    Obchodná fakulta                                      Obchod EU BA
                                                (Faculty of Commerce)
                                         SOC    Podnikovohospodárska fakulta                          PodnHosp EU BA
                                                (Faculty of Business Economics)

Katolícka univerzita (Catholic University)                                                            KU
Ružomberok                                 HUM     Filozofická fakulta                                Fil KU
www.ku.sk                                          (Faculty of Philosophy)
                                           SOC     Pedagogická fakulta                                Pedag KU
                                                   (Pedagogical Faculty)
                                          HUM      Teologická fakulta                                 Teol KU
                                                   (Faculty of Theology)

Prešovská univerzita (University of Prešov)                                                           PU
Prešov                                    HUM      Fakulta humanitných a prírodných vied              HumPrír PU
www.unipo.sk                                       (Faculty of the Humanities and Natural Sciences)
                                          SOC      Fakulta manažmentu                                 Manag PU
                                                   (Faculty of Management)
                                          SOC      Fakulta športu                                     TV PU
                                                   (Faculty of Sports)
                                          SOC      Fakulta zdravotníctva                              Zdravotnícka PU
                                                   (Faculty of Health Care)
                                          HUM      Filozofická fakulta                                Fil PU
                                                   (Faculty of Arts)
                                          HUM      Gréckokatolícka bohoslovecká                       Greckokat PU
                                                   (Greek Catholic Theological Faculty)
                                          SOC      Pedagogická fakulta                                Pedag PU
                                                   (Faculty of Education)
                                          HUM      Pravoslávna bohoslovecká fakulta                   Pravosl PU
                                                   (Orthodox Theological Faculty)

Slovenská poľnohospodárska univerzita (Slovak University of Agriculture)                         SPU
Nitra                                  AGRO Fakulta agrobiol. potr.zdr.                          Agro SPU
www.uniag.sk                                   (Faculty of Agrobiology and Food Resources)
                                       AGRO Fakulta biotechnológie a potravinárstva              BiotPotr SPU
                                               (Faculty of Biotechnology and Food Sciences)
                                        SOC    Fakulta ekonomiky a manažmentu                    EkonomMan. SPU
                                               (Faculty of Economics and Management)
                                        SOC    Fakulta európskych štúdií                         Eur.ŠT. SPU
                                               (Faculty of European Studies and Regional Development)
                                       AGRO Fakulta záhradníctva a krajinného inžinierstva       Záhrad SPU
                                               (Faculty of Horticulture and Landscape Engineering)
                                       TECH    Mechanizačná fakulta                              Mech SPU
                                               (Faculty of Agricultural Engineering)


                                                                                                                       13
University                                Group     Faculty                                          Abbreviation
Slovenská technická univerzita (Slovak University of Technology)                                       STUBA
Bratislava                               TECH      Fakulta architektúry                                Archit STUBA
www.stuba.sk                                       (Faculty of Architecture)
                                         TECH      Fakulta elektrotechniky a informatiky               Elektr STUBA
                                                   (Faculty of Electrical Engineering and Information Technology)
                                         TECH      Fakulta chemickej a potravinárskej technológie      ChemTechn STUBA
                                                   (Faculty of Chemical and Food Technology)
                                          NAT      Fakulta informatiky a informačných technológií      Infor.aInf.Tech. STUBA
                                                   (Faculty of Informatics and Information Technologies)
                                         TECH      Materiálovotechnologická fakulta                    MatTechn STUBA
                                                   (Faculty of Material Sciences and Technology)
                                         TECH      Stavebná fakulta                                    Stav STUBA
                                                   (Faculty of Civil Engineering)
                                         TECH      Strojnícka fakulta                                  Stroj STUBA
                                                   (Faculty of Mechanical Engineering)

Technická univerzita Košice (Technical University of Košice)                                           TUKE
Košice                                   SOC       Ekonomická fakulta                                  Ekonom TUKE
www.tuke.sk                                        (Faculty of Economics)
                                         TECH      Fakulta BERG                                        Ban TUKE
                                                   (Faculty of Mining, Ecology, Process Control and Geotechnology)
                                         TECH      Fakulta elektrotechniky a informatiky               Elektr TUKE
                                                   (Faculty of Electrical Engineering and Informatics)
                                         HUM       Fakulta umení                                       Umení TUKE
                                                   (Faculty of Arts)
                                         TECH      Fakulta výrobných technológií                       VýrTech TUKE
                                                   (Faculty Manufacturing Technologies)
                                         TECH      Hutnícka fakulta                                    Hutn TUKE
                                                   (Faculty of Metallurgy)
                                         TECH      Stavebná fakulta                                    Stav TUKE
                                                   (Faculty of Civil Engineering)
                                         TECH      Strojnícka fakulta                                  Stroj TUKE
                                                   (Faculty of Mechanical Engineering)

Technická univerzita Zvolen (Technical University in Zvolen)                                        TUZV
Zvolen                                   AGRO Drevárska fakulta                                     Drev TUZV
www.tuzvo.sk                                       (Faculty of Wood Sciences and Technology)
                                          NAT      Fakulta ekológie a environmentalistiky           Ekolenv TUZ
                                                   (Faculty of Ecology and Environmental Sciences)
                                         TECH      Fakulta environmentálnej a výrobnej techniky     EnvirTech TUZV
                                                   (Faculty of Environmental and Manufacturing Technology)
                                         AGRO Lesnícka fakulta                                      Les TUZV
                                                   (Faculty of Forestry)

Trenčianska univerzita A. Dubčeka (Alexander Dubček University in Trenčín)                           TUAD
Trenčín                                  TECH   Fakulta mechatroniky                                 MechTron TUAD
www.tnuni.sk                                    (Faculty of Mechatronics)
                                         TECH   Fakulta priemyselných technológií                    PriemTechn TUAD
                                                (Faculty of Industrial Technologies)
                                         SOC    Fakulta sociálno-ekonomických vzťahov                SocEkon TUAD
                                                (Faculty of Social and Economic Relations)
                                         TECH   Fakulta špeciálnej techniky                          ŠpecTechn TUAD
                                                (Faculty of Special Technology)

Trnavská univerzita (University of Trnava)                                                           TVU
Trnava                                     SOC      Fakulta zdravotníctva a sociálnej práce          ZdravSoc TVU
www.truni.sk                                        (Faculty of Health Care and Social Work)
                                           HUM      Filozofická fakulta                              Fil TVU
                                                    (Faculty of Arts)
                                            SOC     Pedagogická fakulta                              Pedag TVU
                                                    (Faculty of Education)
                                            SOC     Právnicka fakulta                                Práv TVU
                                                    (Faculty of Law)
                                           HUM      Teologická fakulta                               Teol TVU
                                                    (Faculty of Theology)


                                                                                                               14
University                                 Group     Faculty                                          Abbreviation
Univerzita Komenského (Comenius University)                                                           UK
Bratislava                            HUM            Evanjelická bohoslovecká fakulta                 Evanj UK
www.uniba.sk                                         (Evangelical Theological Faculty)
                                      SOC            Fakulta managementu                               Manag UK
                                                     (Faculty of Management)
                                             NAT     Fakulta matematiky, fyziky a informatiky          FMFI UK
                                                     (Faculty of Mathematics, Physics and Informatics)
                                            SOC      Fakulta sociálnych a ekonomických vied            SocEkon UK
                                                     (Faculty of Social and Economic Sciences)
                                            SOC      Fakulta telesnej výchovy a športu                 TV UK
                                                     (Faculty of Physical Education and Sports)
                                            MED      Farmaceutická fakulta                             Farm UK
                                                     (Faculty of Pharmacy)
                                            HUM      Filozofická fakulta                               Fil UK
                                                     (Faculty of Arts)
                                            MED      Jesseniova lekárska fakulta                       JessenLek UK
                                                     (Jessenius Faculty of Medicine)
                                            MED      Lekárska fakulta                                  Lek UK
                                                     (Faculty of Medicine)
                                            SOC      Pedagogická fakulta                               Pedag UK
                                                     (Faculty of Education)
                                            SOC      Právnicka fakulta                                 Práv UK
                                                     (Faculty of Law)
                                             NAT     Prírodovedecká fakulta                            Prír UK
                                                     (Faculty of Natural Sciences)
                                            HUM      Rímskokatolícka cyrilomet. bohoslovecká fakulta RímsKat UK
                                                     (Roman Catholic Theological Faculty of Cyril and Methodius)

Univerzita Konštantína Filozofa (Constantine the Philosopher University)                              UKF
Nitra                                     NAT      Fakulta prírodných vied                            Prír UKF
www.ukf.sk                                         (Faculty of Natural Sciences)
                                          SOC      Fakulta sociálnych vied                            Soc UKF
                                                   (Faculty of Social Sciences and Health)
                                          SOC      Fakulta stredoeurópskych štúdií                    Stredoeur.Št. UKF
                                                   (Faculty of Central European Studies)
                                          HUM      Filozofická fakulta                                Fil UKF
                                                   (Faculty of Arts)
                                          SOC      Pedagogická fakulta                                Pedag UKF
                                                   (Faculty of Education)

Univerzita Mateja Bela (Matej Bel University)                                                             UMB
Banská Bystrica                            SOC       Ekonomická fakulta                                   Ekonom UMB
www.umb.sk                                           (Faculty of Economics)
                                           SOC       Fakulta financií                                     Finan UMB
                                                     (Faculty of Finances)
                                            HUM      Fakulta humanitných vied                             Hum UMB
                                                     (Faculty of the Humanities)
                                            SOC      Fakulta politických vied a medzinár. vzťahov         Polit UMB
                                                     (Faculty of Political Sciences and International Relations)
                                             NAT     Fakulta prírodných vied                              Prír UMB
                                                     (Faculty of Natural Sciences)
                                            HUM      Filologická fakulta                                  Filolo UMB
                                                     (Faculty of Philology)
                                            SOC      Pedagogická fakulta                                  Pedag UMB
                                                     (Faculty of Education)
                                            SOC      Právnicka fakulta                                    Práv UMB
                                                     (Faculty of Law)

Univerzita Pavla Jozefa Šafárika (Pavol Jozef Šafárik University)                                     UPJŠ
Košice                                     SOC      Fakulta verejnej správy                           VerSpr UPJŠ
www.upjs.sk                                         (Faculty of Public Administration)
                                           MED      Lekárska fakulta                                  Lek UPJŠ
                                                    (Faculty of Medicine)
                                           SOC      Právnicka fakulta                                 Práv UPJŠ
                                                    (Faculty of Law)
                                           NAT      Prírodovedecká fakulta                            Prír UPJŠ
                                                    (Faculty of Natural Sciences)


                                                                                                                15
University                                   Group   Faculty                                         Abbreviation
       Univerzita sv. Cyrila a Metoda (University of St. Cyril and Methodius)                               UCM
       Trnava                                      SOC      Fakulta masmed.kom.                             MasMed UCM
       www.ucm.sk                                           (Faculty of Mass Media Communication)
                                                   NAT      Fakulta prírodných vied                         Prír UCM
                                                            (Faculty of Natural Sciences)
                                                   HUM      Filozofická fakulta                             Fil UCM
                                                            (Faculty of Arts)

       Univerzita veterinárskeho lekárstva          AGRO    Košice                                          UVL
       (University of Veterinary Medicine)                  www.uvm.sk

       Vysoká škola múzických umení (Academy of Music and Dramatic Arts)                                    VŠMU
       Bratislava                            HUM     Divadelná fakulta                                      Divadelná VŠMU
       www.vsmu.sk                                   (Faculty of Theatre Arts)
                                             HUM     Filmová a televízna fakulta                            FilmTel VŠMU
                                                     (Faculty of Film and Television)
                                             HUM     Hudobná a tanečná fakulta                              HudTan VŠMU
                                                     (Faculty of Music and Dance)

       Vysoká škola výtvarných umení                HUM     Bratislava                                      VŠVU
       (Academy of Fine Arts and Design)                    www.vsvu.sk

       Žilinská univerzita (University of Žilina)                                                             ŽU
       Žilina                                       TECH    Elektrotechnická fakulta                          Elektr ŽU
       www.utc.sk                                           (Faculty of Electrical Engineering)
                                                    SOC     Fakulta PEDAS                                     Pedas ŽU
                                                            (Faculty of Operation and Economics of Transport and Communications)
                                                     NAT    Fakulta prírodných vied                           Prír ŽU
                                                            (Faculty of Natural Sciences)
                                                    SOC     Fakulta riadenia a informatiky                    Riadenia ŽU
                                                            (Faculty of Management and Informatics)
                                                    TECH    Fakulta špeciálneho inžinierstva                  ŠpecInž ŽU
                                                            (Faculty of Special Engineering)
                                                    TECH    Stavebná fakulta                                  Stav ŽU
                                                            (Faculty of Civil Engineering)
                                                    TECH    Strojnícka fakulta                                Stroj ŽU
                                                            (Faculty of Mechanical Engineering)
x
10


10
   The stated list of public universities was composed according to Annex 1 of Act no. 131/2002 Coll. on higher
education as amended, and the names of all universities were given alphabetically. The list of faculties was
composed according to a report of the Ministry of Education to the SR National Council in July 2005. Some
information was taken from material from the Centre for Equivalence of Diplomas in Bratislava. The ARRA list
includes all public universities apart from the J. Selye University in Komarno, which has not completed the
education cycle for even the first level of university education. The list of faculties does not include seminaries of
the catholic faculty.
     In 2005 private universities operated in Slovakia in addition to the public universities (numbers in
parentheses: full time students, part time students called external ones):
- the Bratislava College of Law, BVŠP (167, 354),
- St. Elizabeth's University of Health and Social Work, VŠZaSP (0, 1181),
- College of Economics and Management of Public Administration, VŠEM (41, 463),
- College of Management in Trenčin, VŠM (620, 131).
     Private universities are not, however, currently included in ARRA's assessments. The main reason is that
nearly all private universities (apart from the College of Management in Trenčin) are relatively new and therefore
in 2004 did not have any graduates. Data on them are also less accessible and incomplete.
                                                                                                                      16
4.        Quality criteria
                ARRA selected a number of criteria from those initially proposed and
discussed with domestic and foreign experts, as shown in Table 2:
Table 2: Criteria for assessing the quality of universities
                     Criteria for assessing the quality of universities

 Category             Num.    Label     Title
     Institution’s     1   ** RP1       Graduates’ quality (employers’ view)
 A
      reputation       2      RP2       Peer review
                       3   * VV1        Number of scientific publications in WoK database in 1995 – 2004 per number
                                        of creative workers (CW)
                        4   *    VV2    Number of citations per CW according to the WoK database
                        5   *    VV3    Number of scientific publications from VV1 with more than 5 citations per CW
                        6   *    VV4    Number of PhD students in full time study (year 2004) in proportion to the
                                        number of professors and associate professors
                        7   *    VV5    Average annual number of PhD graduates in 2002 - 2004 in proportion to the
                                        number of associate professors and professors
      Science and       8   *    VV6    Number of PhD students in full time study in proportion to the total number of
 B
       research                         students studying full time in 2004
                        9        VV6a   PhD studies’ success rate
                       10   *    VV7    Combined grant funding from the VEGA and KEGA agencies per one creative
                                        worker in 2004
                       11   *    VV8    Funding from AR (applied research), ISTC (international scientific and technical
                                        cooperation) and ASST (Agency for the Support of Science and Technology)
                                        grants per one creative worker
                       12   *    VV9    Overall grant funding per one creative worker (2004)
                       13        VV10   Grant funding from the European Social Fund
                       14        SK1    Students with Internet access at the faculty
                       15        SK2    Students with Internet access at the dormitory
                       16        SK3    Number of students accommodated in a dormitory in proportion to overall
                                        number of dormitory applications
        Students’      17        SK4    Number of students with scholarships granted by a university
 C
         comfort       18        SK5    Possibilities for sport and cultural life at the university
                       19        SK6    Number of subjects taught with literature accessible via Internet
                       20        SK7    Number of students attending the students survey on quality of education
                       21        SK8    How have the results of a students survey on quality of education manifested in
                                        quality and organisation of educational process?
                       22   *    SV1    Number of students divided by the number of teachers
                       23   *    SV2    Number of students divided by the number of professors and associate
                                        professors
                       24   *    SV3    The ratio of teachers with a PhD to the total number of teachers
                       25   *    SV4    The number of professors and associate professors divided by the number of
                                        all teachers
                       26   * SV5       Average age of professors holding a functional position (active professor)
       Study and
 D                     27   ** SV6      Admissions proceedings: ratio of actual number of applications received to the
       education
                                        planned number
                       28   *    SV7    Admissions proceedings: number of registered students in proportion to the
                                        number of offers
                       29   ** SV8      Number of students with foreign state citizenship divided by the total number of
                                        students studying full time
                       30   **   SV9    Number of university graduates unemployed for over 6 months
                       31   **   SV10   Students taking part in study abroad
                       32   *    F1     Regular expenditure per one student
 E     Financing       33   *    F2     Success of the university's business activities
                       34   *    F3     The proportion of grant funding to the university's budget for its main activities


         From the given list, data was available only for those criteria that are marked
with one or with two stars. The criteria RP1, SV6, SV8, SV9 and SV10 are mentioned


                                                                                                                  17
in this report but they are not included in the final score for the universities. The
     reason why several of the approved criteria were not used is that the report is
the result of a pilot project and not all the information was accessible at the time of
assessment. In the case of some indicators the collection of data was still not
complete or collection would require more time and be expensive. These include:
-   the results of student surveys,
-   the results of surveys among teachers in individual faculties,
-   information on the financing of individual faculties.
    In some cases the data for all schools are extremely low and therefore – to
prevent the assessment from being too dependent on fluctuation in small numbers –
they were not included in the scoring, although they are mentioned in the report
(they are marked with two stars)
    Some data were available only for universities as a whole and not for individual
faculties (in Table 2 they are highlighted in turquoise). These are included in the final
assessment of the universities but not, however, of their faculties.
    Numbers for professors and associate professors refer to the number of chairs
occupied in 2004.


                                                                                    18
5.     Basic characteristics of the indicators and
                their classification into groups
     The indicators that ARRA uses are classified in a number of materially compact
groups. For purposes of clarity, this section lists the basic characteristics of the
individual indicators and classifies them into groups. The names of the groups
provide sufficient explanation of why a given indicator belongs in its group. A more
detailed analysis of the indicators is given in Part 8, in which specific examples will be
used to show how they affect the assessment.11


"Science and Research" Category
"Publications and citations" Group
VV1
Number of scientific articles12 in proportion to the number of creative workers (CW),
i.e. teachers and researchers and artistic employees with higher education, in
periodicals registered in the Thomson database for the years 1995 – 2004.13
VV2
Number of citations in proportion to the number of CW. Only citations of papers
included in VV1 will be counted. Citations of papers published in or before 1994 will
therefore not be included. The decisive factor is whether the given work appeared in
the database as at 31 December 2004.
VV3
The number of papers published in the years 1995 – 2004, for which more than 5
citations had been registered by 31 December 2004, divided by the number of CW in
the faculty.


"PhD Studies" Group
VV4
The ratio of the number of PhD students in full time study to the number of
professors and associate professors. As a rule, associate professors and professors
11
   Unless stated otherwise, information given relates to 2004.
12
   The terms publication and citation hereafter refer to publications from the stated database and citation in
papers included in it.
13
   http://www.thomson.com/scientific/scientific.jsp, Thanks to the SR Ministry of Education, all universities in
Slovakia have access to this database as do the university's teachers and research and artistic employees, the
Accreditation Commission, the SR Ministry of Education and the Slovak Academy of Sciences
                                                                                                            19
supervise PhD students (and a small number of holders of scientific ranks IIa
       and I, about whom there is no information in the public domain) and this is one
of the duties of their employment under the Higher Education Act no. 131/2002 Coll.
VV5
The annual average number of PhD graduates in the period 2002 -2004 divided by
the number of professors and associate professors in 2004. Since the number of
graduates fluctuates from year to year, it has been necessary to expand the time
scale for the collection of these data. As a baseline we took the minimum length of
full time PhD study under applicable legislation, i.e. 3 years.
VV6
The proportion of the number of PhD students in full time study to the total number
of students studying full time in 2004.


"Grant Success" Group
VV7
Overall grant funding from the VEGA and KEGA agencies per creative worker.
VV8
Funding from AR (applied research) ISTC (international scientific and technical
cooperation) and ASST (agency for the support of science and technology) grants
per creative worker.
VV9
Total grant funding for each creative worker.


"Study and Education" Category14


"Students and Teachers" Group
SV1
The number of students in full and part time study divided by the number of
teachers. Points are awarded so that the lower the number of students per teacher
the higher the number of points.


14
   Where students are referred to in this category of indicators, it refers to students in bachelors and masters
programs studying both full and part time. The only exception is indicator SV10, which includes – where
information is available – full time PhD students. Where it is not explicitly stated (e.g. financing), students are not
recalculated according to the SR Ministry of Education formula.
                                                                                                               20
SV2
         The number of students studying full and part time divided by the number of
teachers. Points are awarded in the same way as for indicator SV1.
SV3
The proportion of teachers with PhD to the total number of teachers. It is assumed
that every professor and associate professor in a functional position has a PhD.
SV4
The ratio of teachers with a PhD to the total number of teachers.
SV5
The average age of active professors. Points are awarded using the value of the
formula 100/(average age of professors). The term active professor (associate
professor) refers to any person who occupies the functional position of a professor or
associate professor15.


"Applications for study" Group
SV6
Admissions proceedings: the number of applications submitted to the planned
number to be admitted, i.e. the number of applications to study divided by the
number of study places offered by the faculty.
SV7
Admissions proceedings: number of registered students to the number of applicants
accepted, i.e. the number of applicants registered divided by the number of places
offered for study.


SV8
Number of students with foreign state citizenship divided by the total number of
students studying full time.


"University Level Criteria" Group

SV9
Number of graduates unemployed for longer than 6 months per 100 university
graduates in 2004.

15
     Act no. 131/2002 Coll. on higher education and changes and additions to certain acts.
                                                                                             21
SV10
      Number of students taking part in study abroad through the Erasmus and
Socrates programs and using SAIA grants, per 100 students of the university.


"Financing" Category

F1
Running costs expenditure from state funding for one student of the university.
F2
The proportion of the result of the university's business activities to the overall costs
of its main activities. This indicator reflects the proportion of its research and
education expenditure that the institution is able to cover from its own business
activities.
F3
The proportion of funds from public grants (VEGA, KEGA, AP MŠ, APVT a MVTS) to
the overall costs of its main activities. This indicator shows what part of its
expenditure the institution is able to gain through the active efforts of its employees
in free competition for public funds made available to support research and
development.


"Reputation" Category


RP1
Quality of graduates (from the perspective of employers). The weekly magazine
TREND cooperated with ARRA to carry out a survey of businesses belonging to the
Association for the Development of Human Resources (a questionnaire sent to
around 110 firms operation in Slovakia). The conclusions from the information gained
are not included in the final score for the faculties and universities and will be
published separately.


                                                                                   22
6.     Method for the assessment of faculties and
              universities
       The indicators listed in Chapter 5 have been selected to ensure that a higher
score corresponds to higher performance.
       For example, one of the indicators is the number of students to one professor
or associate professor. The higher this number is, the less likely it is that professors
and associate professors can give individual attention to students. From the
perspective of individual approach, which ARRA considers to be most beneficial for
students, it is better if this indicator has a lower value. If, however, we consider its
inverted value (the number of associate professors and professors for a hundred
students), a higher level of performance in the faculty corresponds to a higher value
of this indicator. The number of students includes both full and part time students.
The degree awarded to a part time student is the same as the degree awarded to a
full time student and the quality of education provided to both should be the same,
so teachers should pay the same amount of attention to full and part time students.
       In most cases the number in the table is the same as the indicator. There are
only three exceptions:
•   SV1 shows the number of teachers per hundred full and part time students,
•   SV2 shows the number of professors and associate professors per hundred full
    and part time students.
•   SV5 shows the number 100/(average age of active professors).


       The faculty that scored the highest in a particular indicator is assigned 100
points. The other faculties receive points by linear interpolation, with zero points
being assigned to a zero value.
       Each faculty of each university is assessed in the group to which it was
assigned in Chapter 4. The overall ranking of faculties in each group depends on the
average points scores in the groups of indicators.
       The overall ranking of universities is based on the average points scores of
their faculties. Details are given in later chapters.


                                                                                  23
Method for the assessment of faculties and universities
      An example for illustration purposes may be the indicator VV1 (number of
publications per creative worker) and the faculty group AGRO (which covers a
relatively small number of faculties).

Table 3: Values of the VV1 indicator for faculties in the AGRO group

                Faculty                                 Creative workers     Published       Ratio       Points
                                                                              papers
University of Veterinary Medicine                               183            1077           5,89         100
Faculty of Forestry TUZV                                        83,8            187           2,23          38
Faculty of Biotechnology and Food Sciences SPU                  54,7            90            1,65          28
Faculty of Agrobiology and Food Resources SPU                  159,2            151           0,95          16
Faculty of Wood Sciences and Technology TUZV                   123,9            62            0,50          9
Faculty of Horticult. and Landscape Engineering SPU             69,9             7            0,10          2


        The first column contains the name of the faculty (for other faculties see the
collected results), the second column contains the number of creative workers, the
third column gives number of publications in the WoK database for 1995 – 2004. The
next column has the number of publications for each creative worker followed by the
number of points corresponding to this number in this group (calculated as the value
in the fourth column divided by the highest value in the fourth column multiplied by
a hundred and rounded to a whole number). The next step is to combine the values
for indicators VV1, VV2 and VV3 into summary values for the "Publications and
Citations" indicator group (see Table 4).

Table 4: Assignment of scores for the "Publications and Citations" indicator group for faculties in the AGRO
group

                Faculty                                        VV1            VV2            VV3         Points
University of Veterinary Medicine                              100            100            100          100
Faculty of Forestry TUZV                                        26             38             36           33
Faculty of Biotechnology and Food Sciences SPU                  31             28             19           26
Faculty of Agrobiology and Food Resources SPU                   32             16             11           20
Faculty of Wood Sciences and Technology TUZV                    19              9             4            11
Faculty of Horticult. and Landscape Engineering SPU             5               2             4            3

The first three columns show the number of points that each of the faculties gained
in the "Publications and Citations" indicator group. The last column shows the
number of points calculated as the average of all the indicators belonging to the
group. The values in this column are transferred to the final assessment of the
faculties in the group and the overall assessment of the universities.
        The method used to prepare the output value for universities is shown in
Table 5. The Technical University in Zvolen is given as an example.


                                                                                                          24
Table 5: Assessment of a university by individual areas and overall

      Faculty                                             Teachers and Applications Publications     PhD     Grants   Average   University's
                                                            Students    for study and citations    studies                         score
      Faculty of Forestry                                      82           87          33           62        73       67
      Faculty of Wood Sciences and Technology                  77           90          11           74        43       59
      Faculty of Environmen. and Manufactur. Technology        70           71          1            51        84       55
      Faculty of Ecology and Environmental Sciences            65           80          9            58        30       49
      Technical University in Zvolen                                                                                               57,6


       The evaluations that each faculty received in the indicator groups are given in
individual columns, with the names of the groups being given in the first row. For
example, the number 33 in the row for the Faculty of Forestry and the column
"Publications and Citations" is taken from Table 4. The results for all indicator groups
are then summed and divided by the number of indicators (total/5). The resulting
score for the whole university is the average score of its faculties. The overall
evaluation of the universities also includes a sixth group of indicators (Financing, F1
– F3), in which data are available only for the university as a whole.
       In Table 5, the Faculties of Forestry and Wood Sciences and Technology have
points from the AGRO Group (Table 4), the Faculty of Ecology and Environmental
Sciences from the NAT group and the Faculty of Environmental and Manufacturing
Technology from the TECH group.
    A few more notes need to be given on this scheme for the assessment of faculties
and universities.
-   The most significant information is given in Table 3. This informs us the number
    of publications from the faculty for the 1995 – 2004 period. This number can be
    compared with foreign institutions or institutes of SAV (the Slovak Academy of
    Sciences) working in the same area. ARRA will carry out such a comparison in the
    near future.
-   The benchmark for faculties' success in a given indicator is the most successful
    Slovak faculty in the relevant group, not some comparison point from abroad, so
    it is necessary to compare the relevant data in the tables and not the point score.
-   It is necessary to bear in mind that the gradual aggregation of information (the
    creation of averages of averages as can be most clearly seen in the data for the
    university in Table 5) the information value of the ranking changes, becoming
    relative.
-   In the ideal scenario, the analysis would go even deeper and instead of faculties
    as a whole we would assess, and compare with each other and with foreign

                                                                                                                      25
groups, relatively homogenous groups within the faculty corresponding
     approximately to fields of studies. Such an analysis cannot currently be
performed using data in the public domain. It is however ARRA's ambition for the
future to assess also individual study programs in similar/related areas.


                                                                            26
7.      Commentary on individual indicators16
      Science and research

"Publications and citations" Group17

VV1 Number of scientific publications and number of creative workers


        The scientific performance of individual faculties can be assessed in various
ways Around the world, the most widely recognized approach is to use the number
of publications, citations, major awards, ability to obtain research funding in open
competition. The VV1 criterion is based on the number of publications calculated for
one creative worker (CW) in the time period 1995 to 2004, i.e. 10 years. The term
creative worker refers to all teachers and research and artistic employees of the
faculty with higher education. A publication is any work that is recorded in the WoS
database18 for the ten-year period 1995 – 2004.
        A work is included in the ARRA analysis if at least one of its authors papers in
a faculty of a public university in SR19. The current ARRA analysis does not take into
consideration the number of authors of the given work (publication). A survey of the
database shows that the average number of papers published by authors from public
universities in SR increased gradually in the 1995 – 2004 period – in 1995 there were
999 papers and in 2004 the number had increased to 1273.
        In 2004 public universities in SR had a total of 9 810.5 teachers and 1 269
research and artistic workers in with higher education, representing a total of
11 079.5 creative workers. This means that for each worker 0.12 papers were
published in 2004. The results in the tables and graphs published in this ARRA report
show that the average number of papers per creative worker depend to a large
extent on the groups of faculties given in the Frascati Manual.


16
   To decode a abbreviation of a faculty in the graphs please have a look at the Table 1 in Chapter 3.
17
   The selection of data from a ten-year period disadvantages faculties that have existed for a shorter time. It
should therefore be assumed that their ranking in this group of indicators might improve in future. A ten-year
period for the assessment of scientific performance is the generally used standard.
18
   The Thomson Web of Knowledge (WoK) includes the following databases: Web of Science (WoS), Science
Citation Index Expanded (SCI-EXPANDED), Social Sciences Citation Index (SSCI), Arts & Humanities Citation
Index (A&HCI) (available for the years 1985 to 2005) and Essential Science Indicators (ESI). The WoK database
(including WoS and ESI) is available to all employees of all universities, the Slovak Academy of Sciences, the
Accreditation Commission and the SR Ministry of Education.
19
   Where the name of the author could not be linked to a faculty from the database, the link was made through
the list of university (faculty) employees on the web page.
                                                                                                        27
Table 6: Number of papers for the years 1995 – 2004 per one creative worker (situation in 2004)

       Group                                            Papers published in 1995 – 2004
                                                            per one creative worker
       TECH                                                            0,0   –   7,8
       NAT                                                             0,1   –   5,8
       AGRO                                                            0,2   –   3,2
       MED                                                             1,1   –   3,2
       SOC                                                             0,0   –   2,5
       HUM                                                             0,0   –   0,6

       A number of faculty employees, especially in the groups SOC and HUM often
publish their work in periodicals that are not included in the WoK database. This
means that the approach has a negative impact on the arts faculties in particular.
Nevertheless the ARRA analysis includes only papers from the WoK database. The
reasons for this are as follows:
       -     the WoK database is in the public domain, which is in accordance with ARRA's
             data collection plan,
       -     the inclusion of a magazine in the WoK database provides a certain guarantee
             of quality, since inclusion is based on an assessment of the level of the
             published articles, the history of the periodical and the like,
       -     the WoK database is a source of bibliographic data that is recognized by the
             general academic community
       -     the WoK database is available from any location in the world and the data it
             contains can be compared internationally,
       -     in each group of faculties there are faculties that have publications in the WoK
             database, which shows that it is possible to publish in periodicals that are in
             this database; the fears of discrimination in some faculties and fields of study
             are reduced by the fact that they are compared only within their own group
             and with faculties that have the same or a similar orientation,
       -     assessments of universities and social sciences in other countries20 are based
             on similar principles of records of publications in the WoK.


       Other important scientific papers that WoS does not record are patents and
monographs (or articles in monographs). We believe that these types of publication
are included in the survey to a certain extent, even if indirectly. Monographs or

20
     E.g. THES, October 21, 2005, p. 10.
                                                                                                             28
chapters in them are produced mainly from the results of the scientific papers of
     their author or authors. These scientific results are as a rule also published in
articles in recognized periodicals.
   A quite natural question to ask is whether the numbers stated in individual graphs
and tables for indicator VV1 are low, average or high. Comparison with other
assessments of a similar type in other countries led to the conclusion that they are
on the low side. A serious answer to this question depends on a comparison with
the faculties of other – foreign – universities or comparison with the results of non-
university scientific institutions (e.g. the institutes of the Slovak Academy of
Sciences). As one of the first, ARRA will make a comparison with the individual
institutes of SAV in the near future. (Red lines in the graphs indicate average values).


           Number of publications per one creative worker in 2004
                                                  VV1

  Faculty group – MED

     3,5
             3,21

     3,0

     2,5


     2,0


     1,5                   1,42
                                        1,30
                                                        1,11
     1,0


     0,5

     0,0
              Farm UK


                                                         JessenLek UK
                                         Lek UK
                            Lek UPJŠ


                                                                                  29
0,0
                               0,5
                                            1,0
                                                         1,5
                                                               2,0
                                                                     2,5
                                                                           3,0
                                                                                    3,5
                                                                                                                                   0
                                                                                                                                              1
                                                                                                                                                        2
                                                                                                                                                            3
                                                                                                                                                                4
                                                                                                                                                                         5
                                                                                                                                                                              6
                                                                                                                                                                                     7


     VeterLek. UVL


                                                                                 3,15
                                                                                                                     Prír UPJŠ
                                                                                                                                                                              5,80


                                                                                                                       FMFI UK
                                                                                                                                                                       4,40
         Agro SPU


                                                  1,01
                                                                                          Faculty group – AGRO
                                                                                                                        Prír UK
                                                                                                                                                                3,97
                                                                                                                                                                                         Faculty group – NAT


      BiotPotr. SPU


                                              0,97
                                                                                                                   Ekolenv TUZ

                                                                                                                                                 0,96
                                                                                                                      Prír UMB                0,70
         Les TUZV


                                            0,82
                                                                                                                      Prír UKF
                                                                                                                                              0,63


        Drev TUZV                                                                                                     Prír UCM


                                     0,61
                                                                                                                                        0,33


                                                                                                                 Infor a InfTech
                                                                                                                                       0,18


                                                                                                                     STUBA
       Záhrad SPU


                            0,16
                                                                                                                        Prír ŽU
                                                                                                                                       0,15


30
Faculty group – TECH


   ŠpecTechn TUAD          0,00
        ŠpecInž ŽU         0,00
       Archit STUBA        0,02
           Stav ŽU         0,08
         Stroj TUKE        0,08
           Stroj ŽU        0,11
         Mech SPU          0,12
      VýrTech TUKE         0,12
    EnvirTech. TUZV        0,14
   MatTechn STUBA           0,20
     MechTron TUAD          0,21
         Stav TUKE          0,23
          Elektr ŽU         0,31
       Stroj STUBA           0,38
        Stav STUBA            0,58
          Ban TUKE            0,61
         Elektr TUKE          0,63
    PriemTech TUAD                    1,62
       Elektr STUBA                        2,03
         Hutn TUKE                          2,25
  ChemTechn. STUBA                                                    7,80
                       0          1    2          3   4   5   6   7   8      9


                                                                                 31
Faculty group – HUM

    VýtvarUm AU        0,00
        VŠVU BL        0,00
      Umení TUKE 0,00

        Teol.TVU       0,00
         Teol KU       0,00
       Pravosl.PU      0,00
      MuzUm AU         0,00
   HudTan VŠMU         0,00
     Greckokat.PU      0,00
       Filolo UMB      0,00
    FilmTel VŠMU       0,00
     DramUm AU         0,00
  Divadelná VŠMU       0,00
          Fil UKF          0,03
         Fil UCM           0,04
      RímsKat UK            0,04
           Fil KU             0,07
       Hum UMB                     0,10
       HumPrír PU                               0,25
          Fil TVU                                0,27
         Evanj UK                                       0,38
            Fil UK                                             0,48
            Fil PU                                                          0,62

                     0,0          0,1     0,2     0,3   0,4    0,5    0,6          0,7


                                                                                         32
Faculty group – SOC

   Zdravotnícka PU     0,00
         Športu PU     0,00
   Sredoeur.Št.UKF     0,00
       SocEkon UK      0,00
    SocEkon TUAD       0,00
         Soc UKF       0,00
        Práv UMB       0,00
         Práv TVU      0,00
        Pedas ŽU       0,00
       Pedag UMB       0,00
     MasMed UCM        0,00
     Manažment PU      0,00
       Pedag UKF       0,02
         Polit UMB     0,02
         Pedag PU      0,04
  PodnHosp. EU BA          0,05
        Práv UPJŠ          0,06
        Pedag KU           0,06
          Práv UK          0,07
   EkonomManSPU            0,07
        Pedag UK           0,08
      Ekonom UMB           0,09
      Riadenia ŽU          0,09
        Finan UMB            0,16
       Pedag TVU             0,16
         Manag UK            0,19
           TV UK             0,21
      VerSpr UPJŠ             0,22
         EurŠt SPU            0,24
    PodnMan EU BA                 0,33
  MedzVzťah EU BA                 0,33
    HospInfo EU BA                  0,42
   NárHosp. EU BA                    0,45
      Ekonom TUKE                     0,50
     Obchod EU BA                         0,62
    ZdravSoc TVU                                                    2,46

                     0,0            0,5          1,0   1,5   2,0   2,5     3,0


                                                                                 33
VV2            Number of citations per CW according to the WoS database

              Citations represent another indicator of scientific performance that is
widely accepted around the world, in particular of the domestic and international
response to the published results of the scientific work of individuals and work
groups.    In   discussions   of   this   indicator   there   have   been   a   number   of
misunderstandings, which is why we give more space to its explanation. In the WoS
database, every work is linked to information about the number of times and in
which papers it has been cited, and the citations of each author's work can be found.
Citations for all papers come only from the periodicals for which WoS collects
information The papers whose citations are analyzed here are precisely those papers
that were included in indicator VV1, i.e. papers published in the years 1995 – 2004
and recorded in the WoS database. For example, if an author in a particular faculty
published a work in 1994 (i.e. before the monitored period), which has a number of
citations, neither this work nor its citations are included in the current ARRA analysis.
If the work was published in 2002, the work appears in the VV1 indicator and its
citations will be counted in the VV2 indicator. This leads to a certain reduction in the
number of citations but this is not considered to be a fundamental problem. The
same conditions were applied to each university in the study. This reduction has also
helped to capture the current situation, which is more important for today's
prospective students than the rich scientific history of the university since its
foundation.
      Citations for papers published in the years 1995 – 2004 are accumulating in
2005 and will continue to accumulate in future years. The analysis of citations was
carried out as at 31 December 2004, and therefore the set of citations includes only
those from before this date.
      A classic problem in analyzing citations is excluding self-citations, i.e. citations
of papers where at least one of the authors of the citing work is one of the authors
of the cited work. When calculating the number of citations of the work of a given
author, especially in career progression, self-citations are not taken into
consideration. The ARRA analysis however includes self-citations. The available and
suitable software for the analysis of publications and citations does not contain filters
that could exclude self-citations. The time requirements for "manual" filtering would


                                                                                    34
be extremely high. We believe, however, that the removal of self-citations
      would not have a significant effect on the results presented here.
          Just for information, employees of Slovak universities published a total of
11 163 papers that are recorded in WoK in the period 1995 – 2004. 43 545 citations
of these papers were recorded. Of these 11 163 papers, however, 3 382 papers i.e.
30%, did not receive a single citation. This fact shows that even the papers' own
author did not cite it during this period.
          As mentioned above, the number of citations was determined for the period
1995 – 2004 for papers that were published in the same period. In the HUM group,
only 6 faculties recorded any result, with the other 17 (of which 8 are faculties of art)
having no record. The situation is the same in the SOC group – 19 faculties out of a
total of 36 did not record any data.
          The VV2 indicator combined with the VV1 indicator makes possible certain
comparisons with the highest international level. If we divide result VV2 by result
VV1, we get the average number of citations for one published paper. Some of the
more successful faculties of public universities in SR are shown in Table 7.

Table 7: Average number of citations per paper for certain faculties of public universities, 1995 – 2004

Faculty                                                                                Average number of
                                                                                     citations per one paper
Faculty of Mathematics, Physics and Informatics, UK                                            8,30
Faculty of Natural Sciences, UK                                                                4,24
Faculty of Chemical and Food Technology, STUBA                                                 4,19
Faculty of Medicine, UPJŠ                                                                      4,11
Faculty of Pharmacy, UK                                                                        3,99
Jessenius Faculty of Medicine, UK                                                              3,98
Faculty of Natural Sciences, UPJŠ                                                              3,77
Faculty of Medicine, UK                                                                        3,60
University of Veterinary Medicine                                                              1,87


          It is also possible to give a comparison of this indicator for all Slovak public
universities.


                                                                                                           35
Table 8: Average number of citations per paper for Slovak public universities, 1995 – 2004


         University                                                                  Average number of citations per
                                                                                          paper (1995 – 2004)

         Comenius University, Bratislava                                                              5,2
         Slovak University of Technology, Bratislava                                                  3,9
         Pavol Jozef Šafárik University, Košice                                                       3,9
         University of Trnava, Trnava                                                                 3,7
         Matej Bel University, Banská Bystrica                                                        2,2
         Alexander Dubček University in Trenčín, Trenčín                                              2,1
         Constantine the Philosopher University, Nitra                                                2,1
         University of Veterinary Medicine, Košice                                                    1,9
         Technical University of Košice, Košice                                                       1,7
         Technical University in Zvolen, Zvolen                                                       1,5
         University of St. Cyril and Methodius, Trnava                                                1,1
         Slovak University of Agriculture, Nitra                                                      1,0
         University of Žilina, Žilina                                                                 0,9
         University of Prešov, Prešov                                                                 0,3
         University of Economics, Bratislava                                                          0,3
         Catholic University, Ružomberok                                                              0,2
         Academy of Arts, Banská Bystrica                                                             0,0
         Academy of Music and Dramatic Arts, Bratislava                                               0,0
         Academy of Fine Arts and Design, Bratislava                                                  0,0


                                                                                                                 21
           A comparison with other countries can be made fairly simply because THES
uses the same methodology. First those of the best universities:


Table 9: Average number of citations per paper for some of the most successful universities in the world, 1995 –
2004

University                                                                     Average number of citations per
                                                                               paper published in 1995 – 2004

Harvard University                                                                           20,6
Princeton University                                                                         17,7
Stanford University                                                                          17,3
University of California, Berkeley                                                           16,0
ETH Zurich                                                                                   14,0
Cambridge University                                                                         12,9
Oxford University                                                                            12,2


           Middle of the table in the stated magazine:


Table 10: Average number of citations per paper for some other universities from around the world, 11095 –
2004

University                                                                     Average number of citations per
                                                                               paper published in 1995 – 2004

University of British Columbia                                                               10,1
Copenhagen University                                                                        8,7
Osaka University                                                                             7,3
La Sapienza University Roma                                                                  7,8


21
     The Times Higher Education Supplement (THES), 7 October 2005, p. 9.
                                                                                                            36
From this comparison we can see that not even the relatively successful
faculties of Slovak public universities (apart from the UK Faculty of Mathematics,
Physics and Informatics) achieve even a medium position in the average number of
citations for a published paper.


                  Number of citations per creative worker in 1995 – 2004

                                                                               VV2

Faculty group – MED
                   14
                                    12,81
                   12

                   10

                    8
                                                                    5,85
                    6                                                                     4,68                     4,43
                    4

                    2

                    0
                                     Farm UK


                                                                                              Lek UK
                                                                    Lek UPJŠ


                                                                                                                   JessenLek
                                                                                                                      UK


Faculty group – NAT


  40   36,5
  35

  30

  25                    21,9
  20                                           16,8
  15

  10

   5                                                     2,0                   1,5        1,1           0,4             0,0          0,0
   0
        FMFI UK


                                                                                          Ekolenv TUZ
                                               Prír UK
                        Prír UPJŠ


                                                                                                        Prír UCM


                                                                                                                                   STUBA
                                                         Prír UMB


                                                                               Prír UKF


                                                                                                                                   InfTech
                                                                                                                         Prír ŽU


                                                                                                                                    Infor a


                                                                                                                                              37
Faculty group – AGRO

     7
               5,89
     6

     5

     4

     3
                                       2,23
     2                                                       1,65
                                                                                0,95
     1                                                                                          0,50
                                                                                                                 0,10
     0
                                                           BiotPotr. SPU


                                                                                                Drev TUZV
                                        Les TUZV
              VeterLek.


                                                                                                                 Záhrad SPU
                                                                                Agro SPU
                UVL


Faculty group – TECH

    ŠpecTechn TUAD            0,00

          ŠpecInž ŽU          0,00

    EnvirTech. TUZV           0,00

         Archit STUBA         0,01

             Stav ŽU          0,01

           Mech SPU           0,03

      VýrTech TUKE            0,05

           Stroj TUKE         0,08

             Stroj ŽU         0,09

     MechTron TUAD            0,12

   MatTechn STUBA             0,16

           Stav TUKE          0,26

            Elektr ŽU         0,39

          Elektr TUKE           1,10

           Ban TUKE             1,35

         Stroj STUBA             1,50

          Stav STUBA             1,78

           Hutn TUKE                    3,60

    PriemTech TUAD                      3,76

         Elektr STUBA                              6,90
                                                                                                                         32,64
  ChemTechn. STUBA


                          0                 5             10               15              20    25         30                 35
                                                                                                                              38
Faculty group – HUM

   VýtvarUm AU        0,00
       VŠVU BL        0,00
     Umení TUKE 0,00

       Teol.TVU       0,00
        Teol KU       0,00
     RímsKat UK       0,00
      Pravosl.PU      0,00
     MuzUm AU         0,00
   HudTan VŠMU        0,00
    Greckokat.PU      0,00
      Filolo UMB      0,00
   FilmTel VŠMU       0,00

          Fil KU      0,00
    DramUm AU         0,00
 Divadelná VŠMU       0,00
         Fil UKF          0,01
        Fil UCM           0,01
      Hum UMB                0,02
        Evanj UK                     0,05
         Fil TVU                            0,07
           Fil PU                                        0,11
      HumPrír PU                                                      0,17
           Fil UK                                                             0,20

                    0,0             0,1            0,1          0,2          0,2     0,3


                                                                                           39
Faculty group – SOC


   Zdravotnícka PU   0,00
         Športu PU   0,00
   Sredoeur.Št.UKF   0,00
       SocEkon UK    0,00
    SocEkon TUAD     0,00
         Soc UKF     0,00
        Práv UMB     0,00
          Práv UK    0,00
        Práv TVU     0,00
         Polit UMB   0,00
  PodnHosp. EU BA    0,00
        Pedas ŽU     0,00
       Pedag UMB     0,00
       Pedag UKF     0,00
     MasMed UCM      0,00
    Manažment PU     0,00
        EurŠt SPU    0,00
     Ekonom UMB      0,00
   PodnMan EU BA     0,01
   EkonomManSPU      0,02
         Pedag PU    0,02
        Pedag KU     0,02
        Pedag UK     0,02
     VerSpr UPJŠ     0,04
        Práv UPJŠ    0,04
 MedzVzťah EU BA         0,04
        Manag UK         0,05
      Riadenia ŽU        0,05
       Finan UMB         0,06
           TV UK         0,11
   NárHosp. EU BA        0,17
    Obchod EU BA         0,17
   HospInfo EU BA        0,20
     Ekonom TUKE          0,36
       Pedag TVU           0,51
    ZdravSoc TVU                                       10,46

                     0            2   4   6   8   10            12


                                                           40
VV3         The number of papers published in the years 1995 – 2004, for
     which more than 5 citations had been registered within that faculty, divided by
     the number of creative workers in the faculty.

       One of the criteria that can show the impact that faculties or universities have
had on scientific progress around the world is to set a minimum number of
references (citations) for publications by authors from the faculty. In the ARRA
analysis, the original intention was to identify and analyze numbers of papers with a
high number of citations, which could relate to the presence of strong scientific
personalities in individual faculties. It turned out, however, that even if you choose
only 10 as the minimum number of citations (and it is normal to study 50 and even
more), the majority of faculties in Slovak universities did not have even one such
paper in the period from 1995 to 2004. For this reason, ARRA, taking into
consideration the Slovak research community, decided to use a more generous
threshold value in this evaluation period. This analysis includes the indicator VV3 so
that it provides information on the number of papers with more than 5 citations per
publication (including self-citations).
       From 97 faculties and two universities with no faculties (hereafter we shall
discuss 99 faculties) only 37 faculties, i.e. approximately one third, met this criterion.
In the HUM group there was not even one (the values 0.007 and 0.006 are basically
insignificant, and we again emphasize that 8 of the faculties are faculties of art), in
the SOC group only the TVU Faculty of Healthcare and Social Work in Trnava and the
TVU Faculty of Education in Trnava have such papers while the other 4 faculties are
close to zero. The UK Faculty of Mathematics, Physics and Informatics lead the NAT
GROUP with a value of 0.8, the STU Faculty of Informatics and Information
Technology and the ŽU Faculty of Natural Sciences rank lowest in the table with a
value of 0. In other groups the situation is the same. In TECH the STU Faculty of
Chemical and Food Technology had a score of 2.3, which is the highest of any of the
studied faculties. It is surprising that only 8 of the 21 TECH faculties met this
criterion. In the case of MED faculties, the best is the UK Faculty of Pharmacy with
0.9, the UK Faculty of Medicine and Jessenius Faculty of Medicine had identical
scores of 0.3.
      For the sake of interest, we can again state that only 2 595 of the 11 163
papers produced by Slovak universities in the period 1995 – 2004 met the criterion

                                                                                    41
(and more than three fifths of these came from three faculties – the STU
        Faculty of Chemical and Food Technology, the UK Faculty of Mathematics,
Physics and Informatics, and the UK Faculty of Natural Sciences), i.e. for each
creative worker there 0.023 such papers per year.


  Number of published papers with more than 5 citations per number of
                          creative workers
                                                                                VV3

  Faculty group – MED

  1,0
                     0,87
  0,9
  0,8
  0,7
  0,6
  0,5
  0,4                                      0,35
                                                                   0,29
  0,3                                                                                      0,26

  0,2
  0,1
  0,0
                     Farm UK


                                                                   Lek UK
                                           Lek UPJŠ


                                                                                       JessenLek
                                                                                          UK


  Faculty group – NAT


  0,9
  0,8     0,76
  0,7                          0,62
  0,6
  0,5
  0,4                                      0,32
  0,3
  0,2
                                                        0,10
                                                                            0,07       0,06
  0,1                                                                                                0,03
                                                                                                                 0,00      0,00
  0,0
           FMFI UK


                                                                                       Ekolenv TUZ
                                              Prír UK
                               Prír UPJŠ


                                                                                                     Prír UCM


                                                                                                                STUBA
                                                                            Prír UMB
                                                        Prír UKF


                                                                                                                InfTech


                                                                                                                           Prír ŽU
                                                                                                                 Infor a


                                                                                                                                     42
Faculty group – AGRO


0,45
           0,39
0,40
0,35
0,30
0,25
0,20
                      0,14
0,15
0,10                               0,07
                                                 0,04
0,05                                                        0,02        0,01
0,00                             BiotPotr. SPU


                                                            Drev TUZV
                      Les TUZV
          VeterLek.


                                                                        Záhrad SPU
                                                 Agro SPU
            UVL


                                                                                     43
Faculty group – TECH


    VýrTech TUKE 0,000

 ŠpecTechn TUAD       0,000
      ŠpecInž ŽU      0,000
         Stroj ŽU     0,000
         Stav ŽU      0,000
   MechTron TUAD      0,000
       Mech SPU       0,000
  EnvirTech. TUZV     0,000
     Archit STUBA     0,000
       Stroj TUKE 0,005

       Stav TUKE      0,009
 MatTechn STUBA       0,010
        Elektr ŽU         0,025
        Ban TUKE           0,075
     Stroj STUBA            0,096
       Elektr TUKE          0,098
      Stav STUBA            0,119
       Hutn TUKE                    0,271
  PriemTech TUAD                     0,334
     Elektr STUBA                       0,426
ChemTechn. STUBA                                                    2,266

                    0,0                     0,5   1,0   1,5   2,0           2,5


                                                                    44
0,000
                               0,001
                                       0,002
                                               0,003
                                                       0,004
                                                               0,005
                                                                       0,006
                                                                                0,007
                                                                                           0,008
          HumPrír PU
                                                                                        0,007

              Fil UK
                                                                        0,006


                           0
     Divadelná VŠMU


                           0
        DramUm AU


                           0
           Evanj UK
                                                                                                   Faculty group – HUM


                           0
              Fil KU


                           0
              Fil PU


                           0
            Fil TVU


                           0
            Fil UCM


                           0
             Fil UKF
                           0
       FilmTel VŠMU
                           0

          Filolo UMB
                           0


        Greckokat.PU
                           0


      HudTan VŠMU
                           0


          Hum UMB
                           0


         MuzUm AU
                           0


          Pravosl.PU
                           0


         RímsKat UK
                           0


            Teol KU
                           0


           Teol.TVU
                           0


         Umení TUKE


45
                           0


           VŠVU BL
                           0


       VýtvarUm AU
Faculty group – SOC


 Zdravotnícka PU     0
    VerSpr UPJŠ      0
         TV UK       0
       Športu PU     0
 Sredoeur.Št.UKF     0
     SocEkon UK      0
  SocEkon TUAD       0
       Soc UKF       0
    Riadenia ŽU      0
      Práv UPJŠ      0
      Práv UMB       0
        Práv UK      0
       Práv TVU      0
       Polit UMB     0
  PodnMan EU BA      0
PodnHosp. EU BA      0
      Pedas ŽU       0
     Pedag UMB       0
     Pedag UKF       0
      Pedag UK       0
       Pedag PU      0
      Pedag KU       0
MedzVzťah EU BA      0
   MasMed UCM        0
   Manažment PU      0
       Manag UK      0
      Finan UMB      0
       EurŠt SPU     0
 EkonomManSPU        0
    Ekonom UMB       0
 NárHosp. EU BA      0,007
  HospInfo EU BA         0,009
   Obchod EU BA          0,010
    Ekonom TUKE           0,024
     Pedag TVU              0,047
  ZdravSoc TVU                                                        0,619

                   0,0            0,1   0,2   0,3   0,4   0,5   0,6           0,7


                                                                              46
"PhD studies" Group

    VV4 The number of PhD students in full time study in proportion to the
number of professors and associate professors

           As a rule only a few associate professor and professors supervise PhD
students (and a small number of holders of scientific degree IIa and I, about whom
there is no information in the public domain). This indicator shows the proportion of
the faculty's (university's) supervision capacity that is used.
The most successful faculties in the individual groups of faculties in this indicator are
shown in Table 11.

Table. 11: The number of PhD students in full time study in proportion to the number of professors and associate
professors22

Faculty                                                                         PhD students (full time)/ (number
                                                                                  of profs. and assoc. profs.)
Orthodox Theological Faculty, PU                                  HUM                         1,67
Faculty of Informatics and Inform. Technolog., STUBA              NAT                         1,58
Faculty of Mining, Ecol., Process Cont. and Geot., TUKE           TECH                        1,25
Faculty of Horticulture and Landscape Engineering, SPU            AGRO                        1,74
Faculty of International Relations, EU BA                         SOC                         1,97
Faculty of Medicine, UPJŠ                                         MED                         0,86


           These numbers can also be compared with top foreign universities. In the
cited article in THES it shows that Oxford University has a "staff" of around 3 000
and approximately 3 000 postgraduate students. At first glance, this would
correspond to number 1 in Table 11 and would be the same as in our faculties.
There are however a number of differences. Oxford University is significantly more
productive in scientific work than our faculties; the papers of its teachers and
research workers are cited significantly more often and it is also much better
financed. If the results of our faculties in indicator VV4 are compared and at the
same time indicators VV1 – VV2 and indicators VV7 – VV8 are taken into
consideration, it is clear that in several faculties with high numbers of PhD students,
publication success and success in obtaining grants are relatively low. The question
then arises whether it is possible to provide quality education for PhD students in
such a situation. The following graphs and Table 12 clearly show that there is
practically no correlation between the quality of scientific performance in our


22
     In this and other tables we always give the best faculty from each of the six groups, unless stated otherwise
                                                                                                             47
universities and the number of PhD students23, which is quite an alarming
                                                             discovery. What is more, the SR Ministry of Education allocates funds for paying
PhD students to universities for this purpose. It is clear that this allocation is not
based on the scientific performance of the faculty. The following graphs illustrate the
low relatedness of the parameters (the blue points represent faculties, the red line
the relatedness of parameters), the correlation coefficient is given in Table 12 (the
highest correlation is if the correlation coefficient R equals 1. The lower the value,
the lower the correlation. If the value of R is lower than 0.8, it is statistically
impossible to speak about a demonstrable mutual relation between variables
(correlation)).

                                                                             Publikácie a doktorandi
                                                                           Published papers and PhD
                                                                                   students
        PhD students / (professors doc.) prof.)


                                                             14
              Doktorandi/(prof. a + assoc.


                                                             12
                                                             10
                                                             8
                                                             6
                                                             4
                                                             2
                                                             0
                                                                  0   1        2        3         4        5           6    7    8
                                                                          Published papers per creative worker
                                                                                  Publikácie na tvorivého pracovníka


                                                                          Citations and doktorandi
                                                                                Citácie a PhD students
 PhD students / (professors + assoc. prof.)


                                                             14
                                                             12
                                 Doktorandi/(prof. a doc.)


                                                             10
                                                             8
                                                             6
                                                             4
                                                             2
                                                             0
                                                                  0   5       10       15       20        25       30      35   40

                                                                               Citations per creativepracovníka
                                                                               Citácie na tvorivého worker


23
  Both full and part time PhD students are counted. The difference between these two groups should not be in
the quality of the education and the scientific work of the supervisor but only in the length of study.
                                                                                                                                       48
Granty a doktorandi
                                                                                      Grants and PhD students
       PhD students / (professors + assoc. prof.)
                                                                   14
                                                                   12
                                       Doktorandi/(prof. a doc.)


                                                                   10
                                                                   8
                                                                   6
                                                                   4
                                                                   2
                                                                   0
                                                                        0           100           200        300           400   500
                                                                                          Granty na tvorivého pracovníka
                                                                                           Grants per creative worker


Table 12: Correlation coefficient (R) for the number of PhD students in full time study per professor and the data
from the previous graphs


                                                                            Graph 1       Graph 2       Graph 3
   Correlation
   coefficient                                                               0,14          0,12          0,10


                            The ratio of the number of full time PhD students to the number of professors
and associate professors reflects not only the efforts of the faculty to provide itself
with a young, successor generation, but also the "exploitation" of supervisors. It may
be noticed that the average values cover the fact that there are professors and
associate professors that supervise a number of PhD students and also some who
supervise no one. It should be the task and power of the faculty to analyze and
address issues relating to its own human resources.


                                                                                                                                       49
The number of full time PhD students in proportion to the number of
                   professors and associate professors in 2004
                                                                                                     VV4


Faculty group – MED
  0,9                      0,86                           0,84
  0,8

  0,7

  0,6                                                                                 0,57                                0,57

  0,5

  0,4

  0,3

  0,2

  0,1

   0
                                                                                                                          Lek UK
                                                          JessenLek UK


                                                                                           Farm UK
                           Lek UPJŠ


Faculty group – NAT
  1,8
        1,58
  1,6                             1,49
                                                1,37
  1,4                                                     1,30

  1,2
                                                                         1,06
   1
                                                                                     0,80
  0,8
                                                                                                     0,63
  0,6

  0,4
                                                                                                                0,17
  0,2
                                                                                                                                   0,00
   0
                                                FMFI UK


                                                                                     Ekolenv TUZ
                                      Prír UK
        Infor.aInf.Tech.


                                                                                                                                   Prír UCM
                                                                                                     Prír UMB


                                                                                                                Prír ŽU
                                                              Prír UKF


                                                                         Prír UPJŠ
            STUBA


                                                                                                                                              50
Faculty group – AGRO
  2

 1,8
       1,74

 1,6

 1,4
                    1,18
 1,2                            1,09
  1                                             0,92
                                                           0,83            0,78
 0,8

 0,6

 0,4

 0,2

  0
                                BiotPotr. SPU
                    Drev TUZV


                                                Les TUZV
       Záhrad SPU


                                                                           Agro SPU
                                                           VeterLek. UVL


                                                                                      51
Faculty group – TECH

    MechTron TUAD         0,00

        ŠpecInž ŽU                                 0,63

      VýrTech TUKE                                  0,66

        Mech SPU                                      0,71

   MatTechn STUBA                                     0,73

         Stav TUKE                                        0,74

          Elektr ŽU                                             0,84

       Elektr TUKE                                               0,86

        Stroj TUKE                                                0,89

   ŠpecTechn TUAD                                                 0,90

    EnvirTech. TUZV                                                0,91

      Elektr STUBA                                                      0,97

       Stroj STUBA                                                      0,98

           Stav ŽU                                                          1,00

        Hutn TUKE                                                           1,02

        Stav STUBA                                                          1,03

           Stroj ŽU                                                            1,09

      Archit STUBA                                                             1,09

   PriemTech TUAD                                                                  1,11

 ChemTechn. STUBA                                                                    1,18

         Ban TUKE                                                                         1,25

                      0          0,2   0,4   0,6          0,8           1           1,2      1,4


                                                                                                   52
Faculty group – HUM

   VýtvarUm AU          0,00

     Umení TUKE 0,00

     MuzUm AU           0,00

    Greckokat.PU        0,00

      Filolo UMB        0,00

        Fil UCM         0,00

    DramUm AU           0,00

        Evanj UK                     0,29

     RímsKat UK                        0,36

      HumPrír PU                        0,38

        Teol KU                                      0,62

          Fil KU                                     0,63

      Hum UMB                                         0,67

           Fil UK                                     0,67

   HudTan VŠMU                                        0,67

       VŠVU BL                                              0,74

           Fil PU                                            0,79

         Fil TVU                                                    0,91

         Fil UKF                                                     0,96

 Divadelná VŠMU                                                            1,06

   FilmTel VŠMU                                                               1,16

       Teol.TVU                                                                      1,31
                                                                                                  1,67
      Pravosl.PU

                    0          0,2     0,4     0,6          0,8       1       1,2     1,4   1,6          1,8


                                                                                                               53
Faculty group – SOC

   Zdravotnícka PU       0,00
     VerSpr UPJŠ         0,00
  Sredoeur.Št.UKF        0,00
      SocEkon UK         0,00
    SocEkon TUAD         0,00
       Práv UPJŠ         0,00
        Práv UMB         0,00
     MasMed UCM          0,00
    Manažment PU         0,00
       Finan UMB         0,00
         Soc UKF            0,18
   HospInfo EU BA               0,35
   NárHosp. EU BA                  0,37
   PodnMan EU BA                   0,37
       Pedag TVU                   0,38
      Pedag UMB                    0,39
        Pedag KU                    0,44
          Práv UK                         0,61
    Obchod EU BA                          0,62
  PodnHosp. EU BA                          0,64
         Polit UMB                          0,69
         Pedag UK                            0,75
     Ekonom UMB                                   0,82
       Pedag UKF                                  0,86
        Športu PU                                 0,86
       Eur.Št. SPU                                0,86
        Práv TVU                                     0,97
     Ekonom TUKE                                         1,09
        Pedas ŽU                                         1,12
         Pedag PU                                           1,22
   EkonomManSPU                                             1,24
        Manag UK                                            1,25
           TV UK                                                1,30
     Riadenia ŽU                                                1,32
   ZdravSoc TVU                                                          1,74
 MedzVzťah EU BA                                                                1,97

                     0              0,5             1              1,5          2      2,5


                                                                                             54
VV5          Average annual number of PhD graduates in 2002 - 2004 in
         proportion to the number of associate professors and professors.

          One of the problems of PhD study in Slovakia is the relatively low numbers
who have completed it. ARRA's analysis shows that the success rate in PhD studies in
our faculties is around 30%. By including indicator VV5, ARRA hopes to add to the
analysis not only the number of PhD students but also in a certain sense also
includes the success of PhD studies.
          For illustration, here are few examples.

Table 13: The average annual number of PhD graduates in proportion to the number of professors and associate
professors in 2002 – 2004.

Faculty
                                                                         Average number of PhD graduates
                                                                           in proportion to the number of
                                                                               profs. and assoc. profs.
Roman Cath. Theol. Faculty of Cyr. and Meth., UK                HUM                      0,60
Faculty of Natural Sciences, UK                                 NAT                      0,36
Faculty of Mining, Ecol., Process Cont. and Geot., TUKE         TECH                     0,37
Faculty of Horticulture and Landscape Engineering, SPU          AGRO                     0,52
Faculty of Health Care and Social Work, TVU                     SOC                      1,61
Faculty of Medicine, UPJŠ                                       MED                      0,57


    The average number of PhD graduates in proportion to the number of
            professors and associate professors in 2002 – 2004
                                                     VV5

Faculty group – MED

   0,6         0,57

   0,5


   0,4

                                  0,29
   0,3


   0,2
                                                     0,13
                                                                         0,09
   0,1


    0
                                                      Farm UK


                                                                          Lek UK
               Lek UPJŠ


                                 JessenLek
                                    UK


                                                                                                     55
Faculty group – NAT

  0,4
         0,36
 0,35
                             0,30
  0,3                                   0,27
 0,25
                                                       0,19            0,19               0,19
  0,2

 0,15

  0,1                                                                                                           0,06       0,05
 0,05
                                                                                                                                               0,00
   0


                                                                                          FMFI UK
                                         Ekolenv TUZ
          Prír UK


                                                                              Prír UPJŠ


                                                                                                                                               Prír UCM
                                                       Prír UMB


                                                                                                                          Infor.aInf.Tech.
                             Prír UKF


                                                                                                                Prír ŽU


                                                                                                                              STUBA
Faculty group – AGRO

 0,6
            0,53
 0,5

                                        0,39
 0,4

 0,3                                                              0,25
                                                                                                    0,23
                                                                                                                                0,20
 0,2

 0,1
                                                                                                                                                           0,00
  0
                                                                                                                                                          BiotPotr. SPU
                                                                  Drev TUZV


                                                                                                                                    Les TUZV
                                                                                                    VeterLek.
                Záhrad SPU


                                        Agro SPU


                                                                                                      UVL


                                                                                                                                                                          56
Faculty group – TECH


  PriemTech TUAD         0,00

   MechTron TUAD         0,00

 ŠpecTechn TUAD                 0,03
    VýrTech TUKE                       0,09

       Mech SPU                              0,11

  EnvirTech. TUZV                            0,11

      Stav STUBA                              0,12
         Stav ŽU                              0,12

 MatTechn STUBA                                0,13

        Elektr ŽU                                   0,14

     Stroj STUBA                                    0,14
       Elektr TUKE                                   0,14
      ŠpecInž ŽU                                           0,17

ChemTechn. STUBA                                            0,17

     Archit STUBA                                                 0,19
     Elektr STUBA                                                   0,21
       Stroj TUKE                                                        0,23

       Stav TUKE                                                         0,24

       Hutn TUKE                                                                0,29
         Stroj ŽU                                                                      0,33
                                                                                               0,37
        Ban TUKE

                     0          0,05   0,1      0,15          0,2        0,25   0,3     0,35          0,4


                                                                                                            57
Faculty group – HUM

  VýtvarUm AU      0,00
   Umení TUKE      0,00
       Teol KU     0,00
    MuzUm AU       0,00
  Greckokat.PU     0,00
Filologická UMB    0,00
Filozofická UCM    0,00
 Filozofická KU    0,00
   DramUm AU       0,00
      VŠVU BL          0,02
       Teol.TVU        0,03
Filozofická UKF           0,05
    HumPrír PU                0,07
 HudTan VŠMU                         0,12
 Hum.vied UMB                        0,13
Filozofická TVU                       0,14
Divadelná VŠMU                          0,16
  Filozofická PU                              0,19
 FilmTel VŠMU                                 0,19
     Pravosl.PU                                      0,28
       Evanj UK                                      0,29
  Filozofická UK                                            0,38
    RímsKat UK                                                            0,60

                   0          0,1            0,2     0,3    0,4    0,5   0,6      0,7


                                                                                 58
Faculty group – SOC


 Zdravotnícka PU        0,00
    VerSpr UPJŠ         0,00
       Športu PU        0,00
 Stred.Eur.Št.UKF       0,00
     SocEkon UK         0,00
  SocEkon TUAD          0,00
       Pedag KU         0,00
   MasMed UCM           0,00
   Manažment PU         0,00
      Finan UMB         0,00
      Eur.Št. SPU       0,00
    Ekonom TUKE 0,00

    Riadenia ŽU         0,02
     Pedag TVU           0,05
       Práv UMB          0,06
        Soc UKF           0,08
      Práv UPJŠ           0,08
       Práv TVU            0,10
     Pedag UMB             0,11
       Pedag PU            0,11
         Práv UK               0,15
       Polit UMB                0,17
  PodnMan EU BA                  0,20
  HospInfo EU BA                 0,21
PodnHosp. EU BA                  0,21
     Pedag UKF                       0,25
    Ekonom UMB                       0,25
 NárHosp. EU BA                      0,27
 EkonomManSPU                         0,28
          TV UK                        0,31
   Obchod EU BA                         0,34
MedzVzťah EU BA                         0,35
       Pedag UK                         0,36
       Pedas ŽU                             0,39
       Manag UK                               0,44
  ZdravSoc TVU                                                                   1,61

                    0          0,2      0,4        0,6   0,8   1   1,2   1,4   1,6      1,8


                                                                                              59
VV6         The number of PhD students in full time study in proportion to the
total number of students studying full time in 2004.

          Typical foreign research universities have a relatively high number of PhD
students from abroad in proportion to the overall number of full time students. This
ratio may in fact provide an image of a certain scientific level in the relevant faculty,
which is the parameter monitored by indicator VV6.

Table 14: Proportion of PhD students from all students (in full time study)

Faculty                                                                       PhD students (full time) / students
                                                                                         (full time)
Faculty of Theology, TVU                                       HUM                          0,12
Faculty of Mathematics, Physics and Informatics, UK            NAT                          0,08
Faculty of Chemical and Food Technology, STUBA                 TECH                         0,11
University of Veterinary Medicine                              AGRO                         0,05
Faculty of Health Care and Social Work, TVU                    SOC                          0,10
Jessenius Faculty of Medicine, UK                              MED                          0,04


          ARRA's analysis shows that PhD students make up more than 10% of the total
number of students in only three faculties: TVU Faculty of Theology 12.6 %, STU
Faculty of Chemical and Food Technology 11 % an TVU Faculty of Healthcare and
Social Work 10 %. 19 faculties out of 99 had a value of zero for this parameter.


                                                                                                          60
The average number of full time PhD students in proportion to the
                       number of all full time students
                                                                                             VV6

Faculty group – MED


        Počet doktorandov denn.štúdia/počet študentov
                       denného štúdia

 5,0%
 4,5%             4,3%
 4,0%
 3,5%
                                              3,3%
                                                                             3,0%
 3,0%
 2,5%                                                                                                         2,3%
 2,0%
 1,5%
 1,0%
 0,5%
 0,0%
                                                                                                                   Farm UK
                                              Lek UK


                                                                                  Lek UPJŠ
                  JessenLek
                     UK


Faculty group – NAT


 9%
        8,5%
 8%

                      6,9%
 7%

 6%

 5%                               4,6%

 4%
                                              3,0%
 3%                                                       2,5%               2,3%
 2%
                                                                                              1,3%
 1%                                                                                                      0,7%
                                                                                                                             0,0%
 0%
        FMFI UK


                                                                             Ekolenv TUZ
                        Prír UK


                                  Prír UPJŠ


                                                                                                                             Prír UCM
                                                                                              Prír UMB
                                               Prír UKF


                                                          Infor.aInf.Tech.


                                                                                                         Prír ŽU
                                                              STUBA


                                                                                                                                        61
0%
                           1%
                                2%
                                        3%
                                                    4%
                                                            5%
                                                                        6%


     VeterLek. UVL
                                                                 5,1%


        Drev TUZV
                                                             4,9%
                                                                             Faculty group – AGRO


         Les TUZV
                                                     3,9%


       Záhrad SPU
                                             3,0%


         Agro SPU
                                            2,8%


      BiotPotr. SPU
                                     2,3%


62
Faculty group – TECH


   MechTron TUAD     0,0%

    VýrTech TUKE            1,3%

      ŠpecInž ŽU             1,7%

       Stroj TUKE              2,0%

       Stav TUKE               2,1%

 MatTechn STUBA                   2,2%

        Ban TUKE                   2,4%

       Mech SPU                    2,5%

        Elektr ŽU                   2,7%

 ŠpecTechn TUAD                     2,9%

       Elektr TUKE                   2,9%

         Stav ŽU                     2,9%

      Stav STUBA                          3,4%

     Stroj STUBA                          3,4%

  PriemTech TUAD                          3,5%

  EnvirTech. TUZV                         3,5%

     Archit STUBA                         3,6%

     Elektr STUBA                          3,7%

         Stroj ŽU                           3,9%

       Hutn TUKE                                   5,1%
                                                                     11,0%
ChemTechn. STUBA

                    0%       2%           4%         6%   8%   10%       12%


                                                                               63
Faculty group – HUM


       Fil UCM     0,0%

    MuzUm AU       0,0%

   VýtvarUm AU     0,0%

  Greckokat.PU     0,0%

    Filolo UMB     0,0%

   DramUm AU       0,0%

   Umení TUKE      0,0%

    HumPrír PU         0,9%

         Fil KU           1,1%

      Evanj UK             1,4%

     Hum UMB                1,6%

       Fil UKF              1,6%

         Fil PU              1,9%

         Fil UK                   2,5%

       Teol KU                     2,8%

    RímsKat UK                      3,2%

        Fil TVU                          3,7%

     Pravosl.PU                               4,3%

      VŠVU BL                                    5,2%

 HudTan VŠMU                                         5,6%

Divadelná VŠMU                                              6,9%

  FilmTel VŠMU                                                     9,3%

      Teol.TVU                                                                  12,6%

                  0%       2%            4%          6%       8%   10%    12%      14%


                                                                                         64
Faculty group – SOC


 Zdravotnícka PU    0,0%
 Sredoeur.Št.UKF    0,0%
   Manažment PU     0,0%
    VerSpr UPJŠ     0,0%
     SocEkon UK     0,0%
  SocEkon TUAD      0,0%
      Práv UPJŠ     0,0%
   MasMed UCM       0,0%
      Práv UMB      0,0%
      Finan UMB     0,0%
       Soc UKF          0,4%
  HospInfo EU BA        0,6%
  PodnMan EU BA          0,8%
 NárHosp. EU BA          0,8%
      Pedag KU             1,0%
   Obchod EU BA            1,1%
         Práv UK           1,2%
PodnHosp. EU BA            1,2%
       Pedag PU             1,4%
     Pedag UMB                 1,5%
    Ekonom TUKE                1,6%
    Ekonom UMB                 1,7%
     Pedag TVU                 1,7%
       Pedag UK                1,7%
     Pedag UKF                 1,7%
       Polit UMB               1,8%
      Pedas ŽU                  1,9%
    Riadenia ŽU                 1,9%
       Manag UK                 2,0%
       Práv TVU                     2,3%
      Eur.Št. SPU                   2,4%
MedzVzťah EU BA                        2,9%
 EkonomManSPU                          3,1%
       Športu PU                           3,4%
          TV UK                             3,9%
  ZdravSoc TVU                                                10,0%

                   0%          2%          4%      6%   8%   10%      12%


                                                                            65
"Grant Success" Group

VV7          Combined grant funding from the VEGA and KEGA agencies per one
creative worker

          The VEGA (Scientific Grant Agency) and KEGA (Cultural and Educational Grant
Agency) agencies have a long tradition in SR and are open to all faculties and
universities (and only to them) although the typical grant level varies from group to
group. Within a given group, however, faculties have approximately equal
opportunities to win grants. For this reason, ARRA combined VEGA and KEGA funding
into one indicator. Some examples are given in Table 15.

Table 15: Combined grant funding from the VEGA and KEGA agencies per creative worker in 2004 in thousand
SKK
Faculty                                                                   Funding per creative worker (in
                                                                                 thousand SKK)
Faculty of Arts, TVU                                          HUM                      17,1
Faculty of Natural Sciences, UK                               NAT                      67,2
Faculty of Chemical and Food Technology, STUBA                TECH                     70,0
Faculty of Forestry, TUZV                                     AGRO                    114,2
Faculty of Management and Informatics, ŽU                     SOC                      14,6
Faculty of Pharmacy, UK                                       MED                      31,0


 Grant funding from the VEGA and KEGA agencies per one creative worker
                           (in thousand SKK)
                                                    VV7

Faculty group – MED


              Prostriedky v tis.Sk z grantov VEGA+KEGA /
                          Počet tvorivých hláv

  35
              31,0
  30

  25                             22,2
                                                    20,9
  20
                                                                        16,0
  15

  10

    5

    0
               Farm UK


                                                     Lek UK
                                  JessenLek UK


                                                                         Lek UPJŠ


                                                                                                    66
0
                                                                                                                                   10
                                                                                                                                               20
                                                                                                                                                    30
                                                                                                                                                             40
                                                                                                                                                                    50
                                                                                                                                                                                60
                                                                                                                                                                                        70
                                                                                                                                                                                               80


                      0
                            20
                                 40
                                      60
                                                    80
                                                           100
                                                                         120
                                                                                                              Prír UK                                                                   67,2
         Les TUZV

                                                                                                           Prír UPJŠ
                                                                                                                                                                                 59,3


                                                                 114,2
                                                                               Faculty group – AGRO
                                                                                                      Infor.aInf.Tech.
                                                                                                                                                                                                    Faculty group – NAT


         Agro SPU
                                                                                                                                                                         52,3


                                                                                                          STUBA


                                                    73,9
                                                                                                             FMFI UK
                                                                                                                                                             35,9


     VeterLek. UVL


                                               69,8
                                                                                                      EKOLENV TUZ
                                                                                                                                                            34,8


                                                                                                            Prír UKF
                                                                                                                                                     28,4


       Záhrad SPU


                                             65,2
                                                                                                            Prír UMB
                                                                                                                                        10,0


        Drev TUZV                                                                                           Prír UCM


                                      54,0
                                                                                                                                    9,5


                                                                                                              Prír ŽU
                                                                                                                             2,0


      BiotPotr. SPU


                          8,9


67
Faculty group – TECH

          Elektr ŽU       6,8

   ŠpecTechn TUAD          8,7

        ŠpecInž ŽU               14,3

   MatTechn STUBA                   19,5

           Stav ŽU                      20,9

      Archit STUBA                        24,1

         Ban TUKE                          25,5

        Mech SPU                                 29,9

           Stroj ŽU                              30,4

   PriemTech TUAD                                   33,5

       Elektr TUKE                                  34,0

        Stav STUBA                                      35,9

      VýrTech TUKE                                      36,4

    MechTron TUAD                                       36,7

    EnvirTech. TUZV                                     37,3

       Stroj STUBA                                       38,3

         Stav TUKE                                             42,0

        Hutn TUKE                                               44,7

        Stroj TUKE                                                     51,1

      Elektr STUBA                                                     52,4

 ChemTechn. STUBA                                                                   70,0

                      0   10       20          30        40       50          60   70      80


                                                                                                68
Faculty group – HUM


      Teol.TVU        0,0

   DramUm AU          0,0

   Umení TUKE         0,0

       Teol KU        0,0

    Filolo UMB              1,1

  Greckokat.PU              1,2

 HudTan VŠMU                1,2

      Evanj UK               1,4

  FilmTel VŠMU                     2,7

     Pravosl.PU                    3,0

       Fil UCM                      3,2

    RímsKat UK                               4,5

         Fil KU                              4,6

    MuzUm AU                                  4,9

   VýtvarUm AU                                      5,8

     Hum UMB                                        5,9

Divadelná VŠMU                                                8,5

       Fil UKF                                                 9,0

         Fil UK                                                           12,1

    HumPrír PU                                                                12,6

         Fil PU                                                                       15,4

      VŠVU BL                                                                         15,5
                                                                                         17,1
        Fil TVU

                  0           2          4          6     8         10   12      14   16        18


                                                                                                     69
Faculty group – SOC

 Zdravotnícka PU        0,0
      Eur.Št. SPU       0,0
 Sredoeur.Št.UKF        0,0
   Manažment PU         0,0
       Polit UMB        0,0
     Pedag UMB            0,7
   MasMed UCM                 0,8
      Finan UMB               0,9
  ZdravSoc TVU                 1,3
      Práv UMB                      1,7
       Manag UK                     1,7
MedzVzťah EU BA                         2,1
       Soc UKF                          2,3
         Práv UK                         2,4
PodnHosp. EU BA                                3,4
      Práv UPJŠ                                3,7
  HospInfo EU BA                                    4,1
  SocEkon TUAD                                       4,3
      Pedag KU                                                 6,4
    Ekonom UMB                                                   7,1
      Pedas ŽU                                                       7,5
       Práv TVU                                                        7,9
   Obchod EU BA                                                          8,2
  PodnMan EU BA                                                            8,4
    Ekonom TUKE                                                              8,9
    VerSpr UPJŠ                                                                9,0
     Pedag UKF                                                                 9,1
     Pedag TVU                                                                   9,7
 NárHosp. EU BA                                                                      10,0
 EkonomManSPU                                                                           11,0
       Pedag PU                                                                             11,9
     SocEkon UK                                                                                12,1
          TV UK                                                                                  12,1
       Športu PU                                                                                        13,7
       Pedag UK                                                                                          13,9
    Riadenia ŽU                                                                                              14,6

                    0               2           4          6         8           10         12          14          16


                                                                                                                         70
VV8          Funding from AR (applied research), ISTC (international scientific and
technical cooperation) and ASST (Agency for the Support of Science and Technology)
grants per one creative worker.

          In 2004, it was mainly faculties oriented towards technology, natural history
and medicine that drew funding from AR and ASST. Within individual groups of
faculties, the faculties had approximately equal chances of obtaining funding from
the stated sources, as in the previous examples. Some examples of the most
successful faculties in the relevant groups are given in Table 16.

Table 16: Funding from AR + ISTC + ASST funding per creative worker in 2004 in thousand SKK

Faculty                                                                  Funding per creative worker (in
                                                                                thousand SKK)
Faculty of Performing Arts, AU                                  HUM                    3,2
Faculty of Mathematics, Physics and Informatics, UK             NAT                   33,5
Faculty of Environm. and Manuf. Technology, TUZV                TECH                  84,7
Faculty of Agrobiology and Food Resources, SPU                  AGRO                  48,8
Faculty of Management and Informatics, ŽU                       SOC                   13,6
Jessenius Faculty of Medicine, UK                               MED                   20,0


   Funding from AR (applied research), ISTC (international scientific and
  technical cooperation) and ASST (Agency for the Support of Science and
      Technology) grants (in thousand SKK) per one creative worker
                                                    VV8


Faculty group – MED


   25

              20,0
   20


   15


   10                             8,8


    5
                                                      1,0
                                                                         0,1
    0
                                                      Farm UK


                                                                         Lek UK
                                  Lek UPJŠ
              JessenLek
                 UK


                                                                                                   71
0
                          10
                                     20
                                          30
                                                 40
                                                      50
                                                              60
                                                                                                        0
                                                                                                              5
                                                                                                                        10
                                                                                                                             15
                                                                                                                                    20
                                                                                                                                         25
                                                                                                                                                30
                                                                                                                                                     35
                                                                                                                                                            40
                                                                                             FMFI UK
                                                                                                                                                     33,5
       Agro SPU


                                                       48,8
                                                                                              Prír UK
                                                                                                                                         23,1
        VeterLek.


                                                                   Faculty group – AGRO
          UVL


                                          26,8
                                                                                            Prír UPJŠ                             15,3
                                                                                                                                                                 Faculty group – NAT


                                                                                              Prír ŽU             3,2
      Drev TUZV


                                 13,7
                                                                                             Prír UKF
                                                                                                             1,4


       Les TUZV


                               9,9
                                                                                            EKOLENV
                                                                                                            0,0


                                                                                              TUZ


                                                                                            Prír UCM
                                                                                                            0,0


     BiotPotr. SPU


                          5,9
                                                                                            Prír UMB
                                                                                                            0,0


     Záhrad SPU


                        1,7
                                                                                          Infor.STUBA
                                                                                                            0,0


72
Faculty group – TECH


          Stav ŽU         0,0

   ŠpecTechn TUAD         0,0

         Stav TUKE        0,9

       ŠpecInž ŽU               4,9

      Archit STUBA               7,0

         Mech SPU                8,1

         Hutn TUKE                8,6

         Stroj TUKE               8,7

    MechTron TUAD                     10,7

   MatTechn STUBA                     11,6

        Elektr TUKE                    12,7

       Stroj STUBA                      13,4

       Stav STUBA                       13,8

     VýrTech TUKE                         16,9

          Elektr ŽU                               25,8

 ChemTechn. STUBA                                  28,6

         Ban TUKE                                  28,9

      Elektr STUBA                                             46,4

          Stroj ŽU                                              49,1

   PriemTech TUAD                                                   52,1

   EnvirTech. TUZV                                                                    84,7

                      0          10          20   30      40   50      60   70   80    90


                                                                                             73
Faculty group – HUM

       Teol TVU        0,0
         Fil TVU       0,0
       VŠVU BL         0,0
          Fil PU       0,0
     HumPrír PU        0,0
        Fil UKF        0,0
   VýtvarUm AU         0,0

 Divadelna VŠMU        0,0
         Fil KU        0,0
   FilmTel VŠMU        0,0
     Pravosl.PU        0,0
       Evanj UK        0,0
     Filolo UMB        0,0
  HudTan VŠMU          0,0
     RímsKat UK        0,0
   Greckokat.PU        0,0
    DramUm AU          0,0
    Umení TUKE 0,0

        Teol KU        0,0
          Fil UK                   0,6
        Fil UCM                          0,8
      Hum UMB                             0,9
     MuzUm AU                                                       3,2

                   0         0,5           1    1,5   2   2,5   3         3,5


                                                                                74
Faculty group – SOC

       Športu PU       0,0
 Zdravotnícka PU       0,0
    StredEur UKF       0,0
       Manag PU        0,0
         TV UK         0,0
       Pedag UK        0,0
     SocEkon UK        0,0
 EkonomManSPU          0,0
       Pedag PU        0,0
 NárHosp. EU BA        0,0
     Pedag TVU         0,0
       Práv TVU        0,0
     Pedag UKF         0,0
   Obchod EU BA        0,0
  PodnMan EU BA        0,0
    Ekonom UMB         0,0
      Pedag KU         0,0
  SocEkon TUAD         0,0
  HospInfo EU BA       0,0
      Práv UPJŠ        0,0
PodnHosp. EU BA        0,0
       Soc UKF         0,0
        Práv UK        0,0
      Práv UMB         0,0
MedzVzťah EU BA        0,0
       Manag UK        0,0
   MasMed UCM          0,0
      Finan UMB        0,0
     Pedag UMB         0,0
       Polit UMB       0,0
    VerSpr UPJŠ         0,4
      Pedas ŽU           0,8
  ZdravSoc TVU                     2,0
      Eur.št.SPU                             4,5
    Ekonom TUKE                              4,8
    Riadenia ŽU                                                      13,6

                   0           2         4         6   8   10   12   14     16


                                                                                 75
VV9 Overall grant funding per one creative worker.

This indicator is based on the total of all grant funding from public sources. To some
extent this reproduces the preceding criteria (double counting), however ARRA
believes that VV9 has its own informational value as a measurement of faculties'
ability to gain funding through their own efforts without regard to the type of donor.

Table 17: Overall grant funding per one creative worker in 2004 in thousand SKK
Faculty                                                                     Overall grant funding/creative
                                                                             worker (in thousand SKK)
Faculty of Arts, TVU                                         HUM                         17,1
Faculty of Natural Sciences, UK                              NAT                         93,5
Faculty of Environm. and Manuf. Technology, TUZV             TECH                       122,0
Faculty of Forestry, TUZV                                    AGRO                       124,1
Faculty of Management and Informatics, ŽU                    SOC                         28,2
Jessenius Faculty of Medicine, UK                            MED                         42,2


In the HUM group of faculties, the TVU Faculty of Philosophy got the greatest
amount of funding per CW, amounting in total to SKK 17 100. On the other hand, 4
faculties out of 23 did not gain any funding in this "competition". The results are
somewhat better in the SOC group. In the ŽU Faculty of Management and
Informatics, one CW was able to gain on average SKK 28 200. Once again 4 faculties
(from 36) did not gain any funding for their research. In the NAT group, the most
successful faculty was the UK Faculty of Natural Sciences with an average of SKK 93
500 per CW, while at the ŽU Faculty of Natural Sciences 1 CW earned on average
SKK 5 540. In the TECH group, the best performer was the TUZV Faculty of
Environmental and Manufacturing Technology with SKK 122 000 per CW, while the
TUAD Faculty of Special Technology came at the bottom of the table with SKK 8 730.
In the AGRO group, one CW of the TUZV Faculty of Forestry gained SKK 124 100,
which is the highest level of funding of all gained by one CW on average. The SPU
Faculty of Biotechnological and Food Sciences came last with SKK 14 800 per CW. In
the MED group, the most successful faculty was the UK Jessenius Faculty of
Medicine, where on average each CW had SKK 42 200, while one CW of the UK
Faculty of Medicine had on average SKK 22 300 from the stated funding. It is
surprising that 8 faculties out of 99 were unable to gain a single crown of public
funding for their research or development or artistic projects. There is no reliable

                                                                                                     76
data available on EU or other funding, especially that which the may have been
     gained individually, and therefore it could not be included in the assessment.
 Overall grant funding (in thousand SKK) per one creative worker in 2004
                                                                                                          VV9

Faculty group – MED

45     42,2

40

35
                                                32,0
30
                                                                             24,9
25                                                                                                              22,3

20

15

10

5

0
                                                Farm UK


                                                                                                                Lek UK
           JessenLek UK


                                                                                Lek UPJŠ


Faculty group – NAT


     100                  93,5
      90

      80                            74,5
                                                          69,4
      70

      60
                                                                    52,3
      50

      40                                                                                   34,8
                                                                                                            29,8
      30

      20
                                                                                                                         10,0       9,5
      10                                                                                                                                       5,2
       0
                                                          FMFI UK


                                                                                            EKOLENV TUZ
                                                                    Infor.aInf.Tech.
                          Prír UK


                                                                                                                         Prír UMB


                                                                                                                                    Prír UCM
                                                                                                            Prír UKF


                                                                                                                                               Prír ŽU
                                    Prír UPJŠ


                                                                        STUBA


                                                                                                                                                         77
Faculty group – AGRO


140
      124,1
                  118,2
120


100
                              96,6


 80
                                              67,7        66,9

 60


 40


 20                                                                    14,8


 0


                                                                       BiotPotr. SPU
                                              Drev TUZV
       Les TUZV


                                                          Záhrad SPU
                   Agro SPU


                              VeterLek. UVL


                                                                                       78
Faculty group – TECH

      ŠpecTechn TUAD         8,7
          ŠpecInž ŽU               19,2
             Stav ŽU               20,9
     MatTechn STUBA                       31,1
         Archit STUBA                     31,1
            Elektr ŽU                     32,6
           Mech SPU                         38,0
           Stav TUKE                             42,9
           Elektr TUKE                            45,8
       MechTron TUAD                              47,5
          Stav STUBA                               49,8
         Stroj STUBA                                51,7
        VýrTech TUKE                                    53,3
           Hutn TUKE                                    53,3
            Ban TUKE                                    54,4
           Stroj TUKE                                     59,7
             Stroj ŽU                                             79,5
      PriemTech TUAD                                                  85,6
    ChemTechn. STUBA                                                         98,6
         Elektr STUBA                                                         101,5
      EnvirTech. TUZV                                                                 122,0

                         0     20          40           60       80      100        120   140


                                                                                                79
Faculty group – HUM


      Teol.TVU         0,0

   DramUm AU           0,0

    Umení TUKE 0,0


       Teol KU         0,0

     Filolo UMB              1,1

   Greckokat.PU              1,2

 HudTan VŠMU                 1,2

       Evanj UK              1,4

  FilmTel VŠMU                     2,7

     Pravosl.PU                    3,0

       Fil UCM                           3,9

    RímsKat UK                               4,5

         Fil KU                              4,6

  VýtvarUm AU                                      5,8

     Hum UMB                                             6,8

    MuzUm AU                                                   8,1

Divadelná VŠMU                                                  8,5

        Fil UKF                                                  9,0

     HumPrír PU                                                                 12,6

          Fil UK                                                                12,6

          Fil PU                                                                       15,4

      VŠVU BL                                                                          15,5

        Fil TVU                                                                               17,1

                   0          2          4         6       8          10   12     14   16      18


                                                                                                     80
Faculty group – SOC


       Zdravotnícka PU        0,0
       Sredoeur.Št.UKF        0,0
         Manažment PU         0,0
             Polit UMB        0,0
           Pedag UMB           0,7
         MasMed UCM            0,8
            Finan UMB          0,9
            Práv UMB                1,7
             Manag UK               1,7
      MedzVzťah EU BA               2,1
             Soc UKF                 2,3
               Práv UK               2,4
        ZdravSoc TVU                      3,3
      PodnHosp. EU BA                     3,4
            Práv UPJŠ                     3,7
        HospInfo EU BA                     4,1
        SocEkon TUAD                       4,3
            Eur.Št. SPU                    4,4
            Pedag KU                             6,4
          Ekonom UMB                              7,1
            Pedas ŽU                              7,5
             Práv TVU                              7,9
         Obchod EU BA                                  8,2
        PodnMan EU BA                                  8,4
          VerSpr UPJŠ                                   9,0
           Pedag UKF                                    9,1
           Pedag TVU                                     9,7
       NárHosp. EU BA                                        10,0
       EkonomManSPU                                           11,0
             Pedag PU                                           11,9
           SocEkon UK                                           12,1
                TV UK                                           12,1
          Ekonom TUKE                                                13,6
             Športu PU                                               13,7
             Pedag UK                                                13,9
          Riadenia ŽU                                                                 28,2

                          0                5            10             15   20   25    30


                                                                                             81
Study and education

"Students and Teachers" Group

SV1       Number of students divided by the number of teachers

          ARRA believes that it is better for students if there is a smaller number of
students per teacher. This allows the teacher to offer a more individual approach to
the student, which almost certainly helps to increase the quality of education and
research activity in the university or faculty. For this reason a higher number of
points was given for a lower number of students per teacher. (For this reason, the
inverse value of students per teacher was used for ranking purposes). At the same
time it is true to say that low numbers of students per teacher lead to problems in
financing universities and faculties because a major part of funding is based on the
number of students. ARRA, however, aims to look at universities through the eyes of
students or prospective students for whom the quality that the school offers them is
important. In discussion of the adequacy of these proportions the interests of
students in higher education and the financing institutions are therefore in conflict.

Table 18: Number of students per teacher
Faculty                                                       Number of students per teacher

Faculty of Performing Arts, AU                        HUM                  3,0
Faculty of Mathematics, Physics and Informatics, UK   NAT                  6,4
Faculty of Chemical and Food Technology, STUBA        TECH                 7,0
University of Veterinary Medicine                     AGRO                 6,8
Faculty of Sports, PU                                 SOC                  7,6
Faculty of Medicine, UK                               MED                  6,2


          Higher numbers of students per teacher are to be found in SOC and HUM
faculties, which relates to the fact that these faculties have as a rule a higher number
of part time students.
          The number of students per teacher reflects the level the tutor's individual
approach to students. It is also possible to speak of the technical requirements of
tuition (e.g. laboratories, studios, sports facilities, clinics, training of talents), or a
lack of interest in the given faculty among applicants (and related over-employment
of teachers in the faculty) or a lack of teachers. It is no surprise that the lowest
                                                                                       82
ratios are to be found in faculties oriented towards art, sport or medicine.
     Questions may however be asked in cases where the faculties with the same or
similar orientation show significant differences. E.g. the VSMU Theatre Faculty 9 and
the AU Faculty of Music 3; The UKF Faculty of Philosophy 24 and the UK Faculty of
Philosophy 9; the PU Faculty of Greek Catholic Theology 27 and the UK Faculty of
Roman Catholic Theology 5; The KU Faculty of Education 44 and the UK Faculty of
Education 20; or the UK Faculty of Management 40 and the ŽU Faculty of
Management and Informatics 14. A point worth noting is the role played in this
indicator by part time students. Sometimes the number of part time students is
greater than the number of full time students. For example, in the case of the TVU
Faculty of Healthcare and Social Work the proportion (part time/full time) is greater
than 4, which is by far the highest in the faculties of the Slovak universities. In 15
faculties out of 99 there are more part time than full time students. In addition, since
2002/2003 the Slovak "full time/part time" ratio has increased from 0.28 to 0.32. In
the same years the number of part time students increased by 14 028, while the
number of full time students increased by only 9 090. From this it is clear that
education in Slovak universities is gradually becoming more of a mass phenomenon
but mainly in the form of part time study. On the margin of this it should be
emphasized that part time study in Slovakia is not identical in character with distance
learning, whose popularity is increasing in other countries.
      For comparison with other countries, we can cite the example of Oregon
University, which is comparable to Comenius University. On its web site the Oregon
University states its teacher-student ratio as 1:16. Comenius University had 2 180
teachers and 23 007 students (excluding PhD students), which corresponds to
approximately 11 students per teacher. At universities in the USA, high numbers of
students per teachers are made possible mainly by the low number of hours of direct
contact between teacher and students (for students it is 15 – 18 hours per week).


                                                                                  83
Number of students (full- and part-time) divided by the number of
                                  teachers in 2004
                                                                                                       SV1


Faculty group – MED


 10

  9
                  8,8
                                                       8,4                               8,3
  8

  7
                                                                                                                           6,2
  6

  5

  4

  3

  2

  1

  0
                                                                                            Farm UK


                                                                                                                           Lek UK
                                                       JessenLek UK
                  Lek UPJŠ


Faculty group – NAT

 30
      27,3
                        26,6
 25


 20

                                           15,7
 15                                                    14,1             13,3
                                                                                       11,5
                                                                                                      10,1
 10                                                                                                              9,0
                                                                                                                                    6,4
  5


  0
                                                                                                                                    FMFI UK
                                                                         Ekolenv TUZ


                                                                                                       Prír UK
                                                             Prír UCM


                                                                                        Prír UPJŠ
       Prír UMB


                        Infor.aInf.Tech.


                                            Prír UKF


                                                                                                                 Prír ŽU
                            STUBA


                                                                                                                                              84
0
                          5
                                    10
                                         15
                                                        20
                                                                    25
       Záhrad SPU


                                                             21,7
         Agro SPU


                                                 17,2

        Drev TUZV
                                                 17,1
                                                                         Faculty group – AGRO


      BiotPotr. SPU
                                                 17,0


         Les TUZV
                                          14,8


     VeterLek. UVL
                              6,8


85
Faculty group – TECH


ChemTechn. STUBA             7,0

     Archit STUBA                       11,7

     Stroj STUBA                        12,1

         Stroj ŽU                       12,2

       Stav TUKE                        12,3

     Elektr STUBA                        13,0

  EnvirTech. TUZV                         13,1

      Stav STUBA                          13,1

       Hutn TUKE                          13,3

        Elektr ŽU                          13,8

       Elektr TUKE                         14,4

         Stav ŽU                                15,7

 ŠpecTechn TUAD                                   16,9

 MatTechn STUBA                                    18,1

    VýrTech TUKE                                       18,9

       Mech SPU                                        19,0

  PriemTech TUAD                                         20,2

       Stroj TUKE                                           21,1

      ŠpecInž ŽU                                                        28,9

   MechTron TUAD                                                        29,1

        Ban TUKE                                                        29,2

                     0   5         10      15          20          25   30     35


                                                                                    86
Faculty group – HUM


    MuzUm AU           3,0
  FilmTel VŠMU               4,9
    RímsKat UK               5,0
  VýtvarUm AU                5,3
 HudTan VŠMU                 5,5
   DramUm AU                  5,8
      VŠVU BL                 6,0
    Umení TUKE                 6,7
       Evanj UK                    6,8
      Teol.TVU                      7,8
Divadelná VŠMU                           8,9
          Fil UK                         8,9
     Filolo UMB                           9,6
        Fil TVU                                11,4
       Fil UCM                                             15,7
          Fil PU                                             17,2
         Fil KU                                              17,3
     Hum UMB                                                      18,6
       Teol KU                                                      19,8
     HumPrír PU                                                     20,0
        Fil UKF                                                            24,0
   Greckokat.PU                                                                   26,8
     Pravosl.PU                                                                          29,8

                   0     5               10           15          20       25        30         35


                                                                                                     87
Faculty group – SOC

       Športu PU        7,6
          TV UK               10,6
 Zdravotnícka PU                12,7
    Riadenia ŽU                      14,4
     SocEkon UK                       15,6
      Finan UMB                        16,6
       Polit UMB                       16,9
       Práv TVU                         17,7
MedzVzťah EU BA                             18,6
       Pedag UK                              20,3
    Ekonom TUKE                                  20,6
     Pedag UKF                                   21,1
 Sredoeur.Št.UKF                                 21,2
      Práv UPJŠ                                    22,6
 NárHosp. EU BA                                    22,9
      Práv UMB                                     23,0
PodnHosp. EU BA                                    23,0
    Ekonom UMB                                      24,2
  PodnMan EU BA                                         24,5
      Pedas ŽU                                          24,5
  HospInfo EU BA                                        24,6
       Pedag PU                                          25,5
 EkonomManSPU                                             26,3
    VerSpr UPJŠ                                            27,8
     Pedag TVU                                             28,0
      Eur.Št. SPU                                               29,2
   Obchod EU BA                                                     30,5
     Pedag UMB                                                        32,5
   MasMed UCM                                                          33,4
         Práv UK                                                           35,3
  ZdravSoc TVU                                                             35,8
       Soc UKF                                                               36,4
   Manažment PU                                                                38,4
       Manag UK                                                                     40,4
  SocEkon TUAD                                                                        42,2
      Pedag KU                                                                         43,8

                    0    10                 20                 30              40             50


                                                                                                   88
SV2              Number of students divided by the number of professors and associate
professors

Values for selected faculties.
Table 19: Number of professors and associate professors per 100 full and part time students
Faculty                                                                    Number of students/(professors +
                                                                                      ass. prof.)
Faculty of Performing Arts, AU                               HUM                          7,1
Faculty of Mathematics, Physics and Informatics, UK          NAT                         16,1
Faculty of Chemical and Food Technology, STUBA               TECH                        12,1
University of Veterinary Medicine                            AGRO                        17,5
Faculty of Sports, PU                                        SOC                         30,6
Faculty of Medicine, UK                                      MED                         19,7


          ARRA's analysis shows that the student-teacher ratio is significantly higher in
faculties with a higher number of part time students.
          The ratio of students to professors and associate professors (i.e. the inverse
value of the parameter stated in Table 19) is important for the academic quality of
subjects but also for the likelihood of individual contact between students and the
faculty members with the highest qualifications. Once again it is possible to observe
a similar trend to that observed in the case of the SV1 indicator. Faculties oriented
towards art and medicine generally have a lower ratio in the area of 26 students to
one professor or associate professor (MED) and around 14 in artistic faculties (the
AU Faculty of Music has a value of 7, which is the lowest for any of the studied
faculties in Slovak universities). Once again there are relatively large differences
between related faculties. While the UKF Faculty of Philosophy has 96 in this
parameter, it is nearly 4 times lower at the TVU Faculty of Philosophy (25). Likewise
in the case of the TUAD Faculty of Socio-Economic Relations (172; the overall
highest ratio of students to professors and associate professors) and the UK Faculty
of Social and Economic Sciences (37), the ratio is almost 5 times higher on TUAD's
side. In the case of faculties oriented towards the natural sciences, the highest
number of students per professor or associate professor is the UMB Faculty of
Natural Sciences (126) while the similar UPJŠ Faculty of Natural Sciences has 23 in
this parameter. Again it is important to notice the influence of part time students on
this criterion. It is interesting that in the case of the UK Faculty of Mathematics,

                                                                                                     89
Physics and Informatics, the value of this parameter is 16, which is on the level
       of arts-oriented faculties. An even lower ratio was calculated for the STU Faculty
of Chemical and Food Technology – 12. Both of these values may relate not only to
the technical demands of tuition but also the low level of interest from prospective
students meaning that there is over-employment of teachers in these faculties.
        Among technology-oriented faculties, the highest value was in the TUAD
Faculty of Mechatronics – 101. There is also relatively large difference in the AGRO
category. While the SPU Faculty of Horticulture and Landscape Engineering has 77
students per professor or associate professor, the University of Veterinary Medicine
has only 18, which is close to that of the medicine-oriented faculties (e.g. UK Faculty
of Medicine 20, whereas the UPJŠ Faculty of Medicine has 34 for this parameter).


       Number of students (full- and part-time) divided by the number of
                 professors and associate professors in 2004
                                             SV2


Faculty group – MED

  40

  35         33,5

  30
                             26,2
                                             25,0
  25
                                                            19,7
  20

  15

  10

   5

   0
                                              Farm UK
                              JessenLek UK


                                                             Lek UK
              Lek UPJŠ


                                                                                   90
0
                          10
                               20
                                      30
                                              40
                                                      50
                                                           60
                                                                  70
                                                                       80
                                                                              90
                                                                                                                             0
                                                                                                                                 20
                                                                                                                                                40
                                                                                                                                                                 60
                                                                                                                                                                             80
                                                                                                                                                                                  100
                                                                                                                                                                                        120
                                                                                                                                                                                                      140

       Záhrad SPU


                                                                       76,5
                                                                                                                Prír UMB
                                                                                                                                                                                              126,0


                                                                                                          Infor.aInf.Tech.
                                                                                                              STUBA


                                                                                                                                                                      63,5
      BiotPotr. SPU


                                                           57,8
                                                                                   Faculty group – AGRO
                                                                                                                Prír UKF


                                                                                                                                                              48,6
                                                                                                                                                                                                            Faculty group – NAT


         Agro SPU                                                                                               Prír UCM
                                                                                                                                                       41,2


                                               40,1
                                                                                                            Ekolenv TUZ
                                                                                                                                                34,1


        Drev TUZV


                                              37,9
                                                                                                                 Prír ŽU
                                                                                                                                                34,1


                                                                                                                  Prír UK
                                                                                                                                         25,5


         Les TUZV


                                       28,3
                                                                                                               Prír UPJŠ
                                                                                                                                        23,1


     VeterLek. UVL                                                                                               FMFI UK
                                                                                                                                 16,1


                               17,5


91
Faculty group – TECH

 ChemTechn. STUBA         12,1
      Elektr STUBA               26,0
         Hutn TUKE               27,4
   EnvirTech. TUZV               27,6
       Stroj STUBA                28,5
      Archit STUBA                30,3
       Stav STUBA                  31,6
          Stroj ŽU                 31,7
          Elektr ŽU                 33,1
        Elektr TUKE                 33,9
         Stav TUKE                  34,8
         Mech SPU                        39,7
   ŠpecTechn TUAD                        39,7
          Stav ŽU                            42,1
   PriemTech TUAD                                   52,7
   MatTechn STUBA                                     58,3
         Stroj TUKE                                   58,5
     VýrTech TUKE                                            67,9
       ŠpecInž ŽU                                              74,0
         Ban TUKE                                                     86,9
    MechTron TUAD                                                              101,4
                      0     20          40           60         80           100       120


                                                                                             92
Faculty group – HUM

     MuzUm AU          7,1

  HudTan VŠMU            12,0

    DramUm AU            12,1

   FilmTel VŠMU              13,4

    VýtvarUm AU              13,9

       VŠVU BL               14,1

       Teol.TVU              14,4

 Divadelná VŠMU              15,4

       Evanj UK                 20,4

         Fil TVU                    24,8

     RímsKat UK                     25,4

          Fil UK                    26,5

    Umení TUKE                       27,2

        Fil UCM                                  44,0

        Teol KU                                  44,3

          Fil PU                                        53,2

     HumPrír PU                                           58,0

          Fil KU                                          58,5

     Filolo UMB                                                63,9

      Hum UMB                                                     70,2

      Pravosl.PU                                                           94,5

        Fil UKF                                                            96,0

   Greckokat.PU                                                             98,3

                   0          20            40           60           80   100     120


                                                                                         93
Faculty group – SOC


        Športu PU             30,6
           TV UK              33,9
      SocEkon UK               37,1
         Soc UKF                     46,9
        Práv TVU                       56,5
       Práv UPJŠ                            64,1
   NárHosp. EU BA                           66,3
 MedzVzťah EU BA                            67,6
   PodnMan EU BA                             67,9
       Pedag TVU                             69,2
   EkonomManSPU                              70,5
     Riadenia ŽU                              72,1
  PodnHosp. EU BA                             74,2
         Polit UMB                             77,0
        Práv UMB                               77,3
         Pedag UK                              78,0
        Pedas ŽU                                   79,8
     Ekonom TUKE                                   81,9
    Obchod EU BA                                    84,0
   ZdravSoc TVU                                      88,6
  Sredoeur.Št.UKF                                    90,4
      Pedag UMB                                       93,6
     VerSpr UPJŠ                                      93,8
       Pedag UKF                                          95,4
       Eur.Št. SPU                                        98,1
          Práv UK                                          99,8
   HospInfo EU BA                                          100,2
     Ekonom UMB                                                   116,1
       Finan UMB                                                       130,2
        Pedag KU                                                       132,4
        Manag UK                                                          135,8
         Pedag PU                                                            144,7
   Zdravotnícka PU                                                           148,8
    Manažment PU                                                               153,6
     MasMed UCM                                                                   161,0
    SocEkon TUAD                                                                     172,1
                     0   20    40      60     80      100        120   140     160     180   200


                                                                                                   94
SV3               The ratio of teachers with a PhD to the total number of teachers.

      As an illustration we give the values of this ratio for a number of faculties.
Table 20: The ratio of teachers with PhD to the total number of teachers.
Faculty                                                                     The ratio of teachers with PhD to
                                                                              the total number of teachers
Orthodox Theological Faculty, PU                              HUM                         79%
Faculty of Natural Sciences, UPJŠ                             NAT                         81%
Faculty of Chemical and Food Technology, STUBA                TECH                        85%
Faculty of Agrobiology and Food Resources, SPU                AGRO                        91%
Faculty of Health Care and Social Work, TVU                   SOC                         86%
Faculty of Medicine, UK                                       MED                         61%


          The values for this ratio vary from faculty to faculty, but correlation with
success in the area of publications and citations is relatively low. A more detailed
study of the data shows that even in the longer established faculties the proportion
of teachers without a PhD is quite high.
          We assume that all active professors and associate professors operating in
Slovak universities have gained the academic degree of PhD (or its equivalent CSc,
Dr, ArtD, ThDr). For other teachers the PhD degree is a sign of a certain scientific
qualification and therefore also a certain level of quality. We can conclude that the
higher the proportion of teachers having the academic degree of PhD (or its
equivalent) in the overall number of teachers, the higher the potential level of quality
in the research and educational activity of the faculty. The differences are highly
pronounced in the faculties oriented towards the humanities. While, for example,
79% of all teachers at the PU Faculty of Orthodox Theology have a PhD degree, only
every fourth teacher at the UMB Faculty of Philology has such a degree. The same
situation exists in faculties oriented towards the social sciences, where the
differences are even greater. 86% of the teaching staff at the TVU Faculty of
Healthcare and Social Work has a PhD degree while at the similarly oriented PU
Faculty of Healthcare only every fifth teacher has this degree (19%; the lowest value
of all among the faculties of Slovak universities). Not even the faculties oriented
towards the natural sciences escape this trend to a large extent. While the UPJŠ
Faculty of Natural Sciences has this ratio at 0.81, the ŽU Faculty of Natural Sciences
has 0.35. The technology-oriented faculties are somewhat better ranging from 85 %
in the STU Faculty of Chemical and Food Technology to 52 % in the TUAD Faculty of
Mechatronics. In the faculties of medicine and the faculty of pharmacy, the
distribution is relatively narrow: 61% for the UK Faculty of Medicine and 54% for the
                                                                                                       95
UK Jessenius Faculty of Medicine. The faculties in the AGRO group where the
        proportion of teachers with PhD degrees was as high as 91% (the highest value
of all for faculties of Slovak universities) in the SPU Faculty of Agrobiology and Food
Resources. The last placed faculty in this group was the SPU Faculty of Horticulture
and Landscape Engineering with 71%.
         It is worrying that amongst all teachers in Slovak universities only 40% have a
PhD degree or its equivalent, which means that more than half of all teachers in
Slovak higher education have not completed the third level of higher education. A
possible objection is that this group includes young faculty employees under 35 who
are still studying; they do not however by far amount to 60% of all university
teachers. The high proportion of teachers without a PhD teaching in the faculties of
Slovak universities is alarming.


   Ratio of teachers with a PhD to the total number of teachers in 2004
                                                SV3


Faculty group – MED
  70%
            61%         60%
  60%
                                    58%
                                                      54%

  50%


  40%


  30%


  20%


  10%


  0%
                         Farm UK
             Lek UK


                                                      JessenLek UK
                                     Lek UPJŠ


                                                                                  96
Faculty group – NAT
 90%
         81%
 80%                         76%
                                            70%
 70%                                                        64%                 63%
 60%
                                                                                                              58%         58%
                                                                                                                                            53%
 50%

 40%                                                                                                                                                                35%

 30%

 20%

 10%

  0%
                                                  FMFI UK


                                                                                Ekolenv TUZ
                             Prír UK
          Prír UPJŠ


                                                                                                                                            Prír UCM
                                                                                                              Prír UMB


                                                                                                                         Infor.aInf.Tech.
                                                            Prír UKF


                                                                                                                                                                    Prír ŽU
                                                                                                                             STUBA


Faculty group – AGRO
 100%
              91%
  90%
                                       81%
  80%                                                        76%
                                                                                              73%                           72%                        71%
  70%

  60%

  50%

  40%

  30%

  20%

  10%

  0%
                                                                BiotPotr. SPU


                                                                                                                               Drev TUZV
                                       Les TUZV


                                                                                                                                                       Záhrad SPU
                  Agro SPU


                                                                                              VeterLek. UVL


                                                                                                                                                                              97
Faculty group – TECH

    MechTron TUAD                                        52%
   ŠpecTechn TUAD                                        54%
   MatTechn STUBA                                        55%
   PriemTech TUAD                                          58%
         Ban TUKE                                              61%
     VýrTech TUKE                                              61%
         Stroj TUKE                                             63%
          Elektr ŽU                                             64%
          Stav ŽU                                               64%
       ŠpecInž ŽU                                                    68%
       Stav STUBA                                                    69%
         Stav TUKE                                                   69%
      Archit STUBA                                                    70%
        Elektr TUKE                                                   70%
   EnvirTech. TUZV                                                     73%
         Mech SPU                                                      73%
          Stroj ŽU                                                     73%
         Hutn TUKE                                                     74%
       Stroj STUBA                                                      75%
      Elektr STUBA                                                          78%
 ChemTechn. STUBA                                                                 85%

                      0%   10%   20%   30%   40%   50%    60%    70%       80%    90%


                                                                                        98
Faculty group – HUM


    Filolo UMB                     24%
   Umení TUKE                       27%
   VýtvarUm AU                             38%
    RímsKat UK                              41%
         Fil KU                                 43%
      VŠVU BL                                     49%
       Fil UKF                                        51%
     Hum UMB                                           53%
       Fil UCM                                         54%
   DramUm AU                                           54%
Divadelná VŠMU                                              58%
    MuzUm AU                                                 60%
         Fil PU                                              61%
      Evanj UK                                               62%
  Greckokat.PU                                                64%
  FilmTel VŠMU                                                    65%
        Fil TVU                                                    69%
    HumPrír PU                                                     69%
         Fil UK                                                    69%
 HudTan VŠMU                                                        70%
      Teol.TVU                                                      71%
       Teol KU                                                           76%
     Pravosl.PU                                                           79%

                  0%   10%   20%   30%    40%    50%    60%       70%    80%    90%


                                                                                      99
Faculty group – SOC


   Zdravotnícka PU         19%
     MasMed UCM                   39%
         Polit UMB                39%
         Pedag PU                      43%
       Pedag UKF                       44%
     Riadenia ŽU                       44%
     Ekonom UMB                        45%
   HospInfo EU BA                      45%
       Finan UMB                        46%
     VerSpr UPJŠ                        48%
  Sredoeur.Št.UKF                        49%
        Práv TVU                         50%
   PodnMan EU BA                             52%
    SocEkon TUAD                             52%
    Manažment PU                             54%
        Pedag KU                             54%
        Manag UK                              55%
         Pedag UK                             56%
 MedzVzťah EU BA                              57%
        Športu PU                             57%
     Ekonom TUKE                               58%
   NárHosp. EU BA                              58%
        Práv UMB                               59%
       Pedag TVU                               59%
    Obchod EU BA                                    63%
          Práv UK                                   63%
      Pedag UMB                                     63%
        Pedas ŽU                                    63%
  PodnHosp. EU BA                                   63%
   EkonomManSPU                                     65%
       Eur.Št. SPU                                    68%
      SocEkon UK                                      68%
         Soc UKF                                      68%
           TV UK                                      69%
       Práv UPJŠ                                          71%
   ZdravSoc TVU                                                  86%
                     0%   20%    40%          60%          80%         100%


                                                                              100
SV4          The number of professors and associate professors divided by the
      number of all teachers

          This ratio varies between 10% and 60% and for most faculties the value is in
the middle of this range.
Table 21: Ratio of the number of teachers with the degree of professor or associate professor to the total
number of teachers in 2004
Faculty                                                                     Ratio of the number of professors
                                                                             or ass. prof. to the total number
                                                                                        of teachers
Faculty of Theatre Arts, VŠMU                                  HUM                          58%
Faculty of Natural Sciences, UPJŠ                              NAT                          50%
Faculty of Chemical and Food Technology, STUBA                 TECH                         57%
Faculty of Forestry, TUZV                                      AGRO                         52%
Faculty of Social and Economic Sciences, UK                    SOC                          42%
Faculty of Pharmacy, UK                                        MED                          33%


          In universities, professors and associate professors are considered to be the
teachers with the highest qualification. This means that the more such teachers a
faculty has, the greater should be the quality of its educational and research
activities. A higher number of professors and associate professors also means a
potentially higher number of accredited study programs, a potentially higher number
of grants etc. The results are not dominated by any of the faculty groups but there
are also relatively large differences within all the groups. It is worrying that out of 99
faculties assessed, the proportion of associate professors and professors in the total
teaching staff exceeded 50% in only three cases (the VSMU Theatre Faculty – 58%,
the STU Faculty of Chemical and Food Technology – 57% and the TUZV Faculty of
Forestry – 52%) There are very sharp differences in the faculties oriented towards
the humanities: 58% the VSMU Theatre Faculty and 15% UMB Faculty of Philology.
There is the same situation in the SOC faculty group: 42% UK Faculty of Socio-
Economic Sciences and 9% PU Faculty of Healthcare (which is the lowest value for
any faculty of a Slovak university). There are also differences among the faculties
oriented towards the natural sciences: the UPJŠ Faculty of Natural Sciences has the
highest proportion at 50%, with last place in this group going to the UMB Faculty of
Natural Sciences at 22%, which is similar to the TECH group of faculties – 57% in
the STU Faculty of Chemical and Food Technology and 28% in the TUKE Faculty of
Manufacturing Technologies. The distribution in the AGRO group is almost identical:
52% in the TUZV Faculty of Forestry and 28% in the STU Faculty of Horticulture and

                                                                                                        101
Landscape Engineering. The MED group of faculties has the smallest
    differences: 33% UK Faculty of Pharmacy and 26% UPJŠ Faculty of Medicine.


The number of professors and associate professors divided by the number
                        of all teachers in 2004
                                  SV4


Faculty group – MED

  35%      33%
                         32%            31%
  30%
                                                     26%
  25%


  20%


  15%


  10%


  5%


  0%
           Farm UK


                         JessenLek UK


                                        Lek UK


                                                      Lek UPJŠ


                                                                         102
0%
                            10%
                                  20%
                                        30%
                                               40%
                                                            50%
                                                                        60%
                                                                                                                        0%
                                                                                                                             10%
                                                                                                                                   20%
                                                                                                                                               30%
                                                                                                                                                            40%
                                                                                                                                                                        50%
                                                                                                                                                                                60%


          Les TUZV                                                                                        Prír UPJŠ


                                                                  52%
                                                                                                                                                                          50%


                                                                                                     Infor.aInf.Tech.
                                                                                                         STUBA
                                                                                                                                                                  42%


         Drev TUZV


                                                        45%
                                                                                                                                                                                      Faculty group – NAT


                                                                                                            FMFI UK
                                                                                                                                                              40%


                                                                              Faculty group – AGRO
          Agro SPU


                                                      43%
                                                                                                             Prír UK
                                                                                                                                                              39%


      VeterLek. UVL                                                                                    Ekolenv TUZ
                                                                                                                                                             39%


                                                39%
                                                                                                           Prír UCM
                                                                                                                                                      34%


       BiotPotr. SPU


                                         29%
                                                                                                           Prír UKF
                                                                                                                                                     32%


        Záhrad SPU


                                        28%
                                                                                                            Prír ŽU
                                                                                                                                               26%


                                                                                                           Prír UMB
                                                                                                                                         22%


103
Faculty group – TECH


    VýrTech TUKE                     28%

   MechTron TUAD                      29%

 MatTechn STUBA                        31%
        Ban TUKE                           34%

       Stav TUKE                            35%

       Stroj TUKE                           36%

         Stav ŽU                             37%
  PriemTech TUAD                             38%

         Stroj ŽU                             39%

     Archit STUBA                             39%

      ŠpecInž ŽU                                 39%

      Stav STUBA                                   42%
        Elektr ŽU                                  42%

       Elektr TUKE                                 42%

 ŠpecTechn TUAD                                    43%

     Stroj STUBA                                   43%
  EnvirTech. TUZV                                        47%

       Mech SPU                                          48%

       Hutn TUKE                                         48%

     Elektr STUBA                                          50%
ChemTechn. STUBA                                                 57%

                    0%   10%   20%   30%     40%         50%     60%   70%


                                                                             104
Faculty group – HUM

    Filolo UMB               15%
    RímsKat UK                 20%
   Umení TUKE                       25%
       Fil UKF                      25%
     Hum UMB                         27%
  Greckokat.PU                       27%
         Fil KU                       30%
     Pravosl.PU                           32%
         Fil PU                            32%
      Evanj UK                             33%
         Fil UK                            34%
    HumPrír PU                              34%
       Fil UCM                              36%
  FilmTel VŠMU                               37%
   VýtvarUm AU                                   38%
    MuzUm AU                                          42%
      VŠVU BL                                         43%
       Teol KU                                         45%
 HudTan VŠMU                                           46%
        Fil TVU                                         46%
   DramUm AU                                                48%
      Teol.TVU                                                    54%
Divadelná VŠMU                                                      58%

                  0%   10%    20%    30%        40%     50%        60%    70%


                                                                                105
Faculty group – SOC

   Zdravotnícka PU             9%
       Finan UMB                     13%
         Pedag PU                          18%
     Riadenia ŽU                             20%
     MasMed UCM                              21%
     Ekonom UMB                                  21%
         Polit UMB                                22%
       Pedag UKF                                  22%
  Sredoeur.Št.UKF                                  23%
    SocEkon TUAD                                       25%
   HospInfo EU BA                                      25%
        Športu PU                                      25%
    Manažment PU                                       25%
     Ekonom TUKE                                       25%
         Pedag UK                                        26%
         Soc UKF                                         26%
 MedzVzťah EU BA                                          28%
     VerSpr UPJŠ                                               30%
        Práv UMB                                               30%
        Manag UK                                               30%
       Eur.Št. SPU                                             30%
        Pedas ŽU                                                   31%
  PodnHosp. EU BA                                                  31%
           TV UK                                                   31%
        Práv TVU                                                   31%
        Pedag KU                                                     33%
   NárHosp. EU BA                                                        34%
      Pedag UMB                                                          35%
       Práv UPJŠ                                                         35%
          Práv UK                                                        35%
   PodnMan EU BA                                                           36%
    Obchod EU BA                                                           36%
   EkonomManSPU                                                             37%
   ZdravSoc TVU                                                                  40%
       Pedag TVU                                                                 41%
      SocEkon UK                                                                     42%
                     0%   5%   10%   15%   20%     25%       30%     35%       40%   45%


                                                                                           106
SV5                Average age of professors

The average age of professors (here referring to active professors) ranges from 51 to
68 years, and in most faculties the value is in the middle of this distribution.
Table 22: The average age of teachers in the functional position of professor in 2004
Faculty                                                                       Average age of teachers in the
                                                                             functional position of professor
Orthodox Theological Faculty, PU                              HUM                          51
Faculty of Mathematics, Physics and Informatics, UK           NAT                          46
Faculty of Mechanical Engineering, ŽU                         TECH                         52
Faculty of Wood Sciences and Technology, TUZV                 AGRO                         57
Faculty of Finances, UMB                                      SOC                          49
Jessenius Faculty of Medicine, UK                             MED                          54

          The criterion of the average age of professors holding a functional position
(active professor) is a typical example of a criterion that can be seen from a number
of points of view. A higher average age may represent a higher level of experience, a
stronger academic foundation for programs and fields, proven traditional research,
more conservative and possibly more mature view of matters. It can also be viewed
negatively as indicating that professors are overage with low performance and low
dynamism. A staff of professors with a lower average age may, on the other hand,
be perceived as precisely the opposite, as dynamic, productive, enthusiastic and
capable of rapid reactions to a changing situation, but at the same time also a group
with experience that is little for the highest rank of the academic hierarchy. We
believe that a good combination is a balance of both categories. It is however also
necessary to bear in mind that under Act no. 131/2002 on Higher Education a
university teacher may no longer be employed on an unlimited employment contract
or, in general, act as the guarantor of a study program after reaching the age of
sixty five.
          In the faculties oriented towards the humanities we can observe differences of
up to 15 years. While the average age of the active professors at the PU Faculty of
Orthodox Theology is only 51 years, at the AU Faculty of Dramatic Arts it is 65 years.
There is a similar situation in faculties oriented towards the social sciences (the
difference is 19 years). Professors at the UMB Faculty of Finance have an average
age of 49 years, making it the second "youngest" faculty in Slovakia. On the other
hand the PU Faculty of Healthcare, the TUAD Faculty of Socio-Economic Relations


                                                                                                      107
and the UKF Faculty of Social Sciences and Healthcare where the professors
       have an average age of 68 years are correspondingly among the "oldest"
faculties.
        The "youngest" faculty is the UK Faculty of Mathematics, Physics and
Informatics where the average age of active professors is 46 years. In this group
(NAT) the "oldest" is the UCM Faculty of Natural Sciences (63). The difference in this
group of faculties is 17 years. In the TECH faculty group the difference is 12 years
between the ŽU Faculty of Mechanical Engineering (52) and the TUAD Faculty of
Mechatronics (64). The smallest differences are in the AGRO group (a difference of
5): 57 years at the TUZV Faculty of Wood Sciences and 62 years at the SPU Faculty
of Horticulture and Landscape Engineering. A similar situation applies in the case of
the MED group of faculties (a difference of 6 years): 55 years in the UK Jessenius
Faculty of Medicine and 61 years in the UK Faculty of Medicine. The average of
active professors in Slovak universities is 58 years. The average age of active
professors with the academic rank of DrSc., i.e. the people with the highest
attainable scientific-academic qualification, is four years higher. The high age of
professors and associate professors can also be said to be alarming.


 Average age of professors holding a functional position (active professor)
                                 in 2004
                                                SV5

Faculty group – MED
  65
             61
  60                    59
                                     56
                                                        55
  55


  50


  45


  40
                        Farm UK
             Lek UK


                                     Lek UPJŠ


                                                      JessenLek
                                                         UK


                                                                               108
40
                                                                                                            45
                                                                                                                      50
                                                                                                                           55
                                                                                                                                     60
                                                                                                                                               65


                     40
                          45
                               50
                                    55
                                          60
                                                        65
                                                                                          Prír UCM                                         63
      Záhrad SPU


                                                   62
                                                                                    Infor.aInf.Tech.
                                                                                                                                          62


                                                                                        STUBA


                                                             Faculty group – AGRO
                                                                                      Ekolenv TUZ
                                                                                                                                          61


        Les TUZV


                                                   61
                                                                                                                                                    Faculty group – NAT


                                                                                           Prír ŽU
                                                                                                                                     59


      BiotPotr. SPU


                                              59
                                                                                          Prír UKF
                                                                                                                                57


                                                                                         Prír UPJŠ
                                                                                                                                56


        Agro SPU


                                              59
                                                                                            Prír UK
                                                                                                                                56


         VeterLek.                                                                        Prír UMB
                                                                                                                           53


                                          58
           UVL

                                                                                           FMFI UK
                                                                                                                 46


       Drev TUZV


                                         57


109
Faculty group – TECH

        Ban TUKE                    52
         Stroj ŽU                   52
       Stav TUKE                         54
 MatTechn STUBA                          54
       Elektr TUKE                        55
        Elektr ŽU                         55
         Stav ŽU                          55
       Stroj TUKE                             56
      ŠpecInž ŽU                              56
ChemTechn. STUBA                               57
       Mech SPU                                57
     Archit STUBA                              57
  EnvirTech. TUZV                                  58
    VýrTech TUKE                                   58
       Hutn TUKE                                    59
     Elektr STUBA                                   59
      Stav STUBA                                    59
     Stroj STUBA                                    59
 ŠpecTechn TUAD                                          61
  PriemTech TUAD                                              63
   MechTron TUAD                                               64

                     40   45   50        55         60         65   70


                                                                         110
Faculty group – HUM


     Pravosl.PU                   51
          Fil PU                       54
  FilmTel VŠMU                         54
          Fil UK                            56
     HumPrír PU                              57
     Hum UMB                                 57
    RímsKat UK                               57

   Greckokat.PU                              57

       Fil UCM                                   58

      VŠVU BL                                    58

    Umení TUKE                                   58
       Teol KU                                    59
 HudTan VŠMU                                      59
  VýtvarUm AU                                     59
       Evanj UK                                        61
         Fil KU                                        61
        Fil UKF                                        61
        Fil TVU                                         62
      Teol.TVU                                          62

    MuzUm AU                                            62

Divadelná VŠMU                                              63

     Filolo UMB                                             63

   DramUm AU                                                     65

                   40   45   50        55         60         65       70


                                                                           111
Faculty group – SOC

       Finan UMB               49
    Manažment PU                    52
         Pedag PU                        54
          Práv UK                         55
     VerSpr UPJŠ                              56
     Riadenia ŽU                              56
    Obchod EU BA                               57
        Pedas ŽU                               57
     Ekonom UMB                                57
      SocEkon UK                               57
     MasMed UCM                                57
   ZdravSoc TVU                                    58
        Pedag KU                                   58
       Práv UPJŠ                                   58
  PodnHosp. EU BA                                  58
           TV UK                                   58
       Pedag UKF                                   58
        Športu PU                                  58
   HospInfo EU BA                                   59
        Práv UMB                                    59
     Ekonom TUKE                                        60
       Pedag TVU                                        60
  Sredoeur.Št.UKF                                       60
   EkonomManSPU                                          61
   NárHosp. EU BA                                            62
        Manag UK                                             62
        Práv TVU                                             62
      Pedag UMB                                              62
       Eur.Št. SPU                                            63
 MedzVzťah EU BA                                                  64
         Pedag UK                                                 64
   PodnMan EU BA                                                   65
         Polit UMB                                                     66
         Soc UKF                                                            68
    SocEkon TUAD                                                            68
   Zdravotnícka PU                                                          68

                     40   45   50        55         60            65         70


                                                                                  112
"Applications for study" Group

     SV6           Admissions proceedings: ratio of actual number of applications
received to the planned number

There are dramatic differences between faculties in the SOC and HUM groups, where
there is high interest in study and between the faculties in the TECH and NAT
groups, where interest is lower. In the SOC and HUM groups there are also increases
in the high number of students in part time study. The situation is the same
throughout Europe. A welcome fact is that interest in the TECH group increased
somewhat in 2005. We shall address this question in more detail in a later ARRA
analysis covering 2005. Table 20 shows a number of values by way of illustration.

Table 23: The number of students applying for full time study compared to the planned number for the academic
year 2004/2005
Faculty                                                                        Students applying for full time
                                                                                  study / planned number
Faculty of Arts, TUKE                                          HUM                            6,3
Faculty of Natural Sciences, UPJŠ                              NAT                            4,3
Faculty of Mining, Ecol., Process Cont. and Geot., TUKE        TECH                           5,0
Faculty of Horticulture and Landscape Engineering, SPU         AGRO                           3,5
Faculty of Law, TVU                                            SOC                           11,2
Jessenius Faculty of Medicine, UK                              MED                            7,5


For the great majority of faculties the ratio of application for study received to the
number of students the university planned to admit was greater than 1. This is
probably a due to two main factors: (a) students apply to more than one faculty; (b)
demand for study is still greater than supply.
          Interest in study and also the likelihood of admission to it can also be
illustrated from the applicants point of view by a criterion based on the ration of the
number of applications submitted to the number of offered (planned) places set by
the faculty (university). Under current legislation an applicant may submit
applications to all faculties of Slovak universities at the same time. Applicants for full
time study submitted on average only 2.1 applications and for applicants for part
time study it was 1.1. Slovak university faculties accepted 75% of applicants for full
time study and 56% of applicants for part time study24. This information does not
take into consideration, however, the number of applicants who went on to take part
in entrance tests (where faculties organize them).
24
  Report on the situation in Slovak higher education for 2004, SR Ministry of Education for SR National Council
(October 2005).
                                                                                                         113
The greatest interest was in faculties oriented towards the arts, where
     the TUKE Faculty of Arts for example records 6 applicants for each place while
the KU Faculty of Theology offers 4 places for each applicant. The value for this
faculty (0.24) is the lowest for any faculty of a Slovak university. The greatest
interest of all is in study at the TVU Faculty of Law – 11 applicants for 1 place
offered. In this group of faculties (SOC) the lowest ratio is 1.35 for the UKF Faculty
of Education. Faculties in the NAT group range from 4.31 for the UPJŠ Faculty of
Natural Sciences to 1.25 for the ŽU Faculty of Natural Sciences. There is a similar
situation with regard to TECH where the highest ratio is 5 in the TUKE Faculty of
Mining, Ecology, Process Control and Geotechnology and the lowest is 0.89 for the
STU Faculty of Electrical Engineering and Information Technology. In the case of the
AGRO group, the highest number of applicants is for study at the SPU Faculty of
Horticulture and Landscape Engineering (3.5) and the lowest at University of
Veterinary Medicine (1.5). For the MED group of faculties the most prospective
students applied for one place at the UK Jessenius Faculty of Medicine (7.5) and the
least at UPJŠ Faculty of Medicine. With the exception of four faculties (the UK Faculty
of Roman Catholic Theology, the UK Faculty of Evangelical Theology, the KU Faculty
of Theology, the STU Faculty of Electrical Engineering and Information Technology)
all faculties of Slovak universities received more applicants than the faculty offered
places, even if this difference is often minimal.
       Since the ratio of applications to the planned number of students for
admission may be influenced by other factors than the reputation of the school, it is
not included in the final assessment of the faculties and universities. Nevertheless it
is one of the most important things that interest prospective students and so it is
included in the report to help complete the picture of Slovak universities.


                                                                                114
Number of applications received in proportion to number planned for
                       admission in acad. year 2004/2005
                                                                                                                      SV6


Faculty group – MED
  8               7,51

  7

  6

  5

  4                                                            3,72

  3                                                                                          2,72
                                                                                                                                2,25
  2

  1

  0
                                                                                             Farm UK
                  JessenLek UK


                                                               Lek UK


                                                                                                                                Lek UPJŠ


Faculty group – NAT
 5

4,5   4,31

 4                               3,69
3,5

 3                                           2,78
                                                                        2,63
                                                                                   2,39
2,5
                                                                                                       2,10
 2
                                                                                                                     1,48
1,5                                                                                                                                   1,31           1,25
 1

0,5

 0
                                                                                                                                           FMFI UK
                                                                                                       Ekolenv TUZ
                                                                                   Prír UK
      Prír UPJŠ


                                                                                                                     Prír UCM
                                                                        Prír UMB
                                            Infor.aInf.Tech.
                                 Prír UKF


                                                                                                                                                     Prír ŽU
                                                STUBA


                                                                                                                                                               115
Faculty group – AGRO
         4
                 3,52
        3,5


         3                              2,84

        2,5


         2
                                                        1,61                 1,58                 1,54                   1,46
        1,5


         1


        0,5


         0


                                                                                                     BiotPotr. SPU
                                            Drev TUZV


                                                         Les TUZV
                   Záhrad SPU


                                                                              Agro SPU


                                                                                                                          VeterLek. UVL
Faculty group – TECH


                 Elektr STUBA                            0,89
              ŠpecTechn TUAD                                  1,03
              PriemTech TUAD                                        1,16
                  Elektr TUKE                                       1,20
               MechTron TUAD                                         1,29
                   Stav STUBA                                         1,41
                                 Stav ŽU                              1,44
                  Stroj STUBA                                         1,45
        ChemTechn. STUBA                                              1,51
                VýrTech TUKE                                           1,59
                                 Stroj ŽU                                  1,63
                         Stav TUKE                                          1,76
                       Mech SPU                                             1,78
                                Elektr ŽU                                   1,80
               EnvirTech. TUZV                                                           2,22
                       Stroj TUKE                                                        2,32
                      Hutn TUKE                                                           2,35
                   ŠpecInž ŽU                                                              2,46
                 Archit STUBA                                                               2,67
              MatTechn STUBA                                                                         3,06
                          Ban TUKE                                                                                                            5,00
                                               0         1                   2                   3                   4                    5          6
                                                                                                                                                         116
Faculty group – HUM

       Teol KU        0,24
      Evanj UK          0,51
    RímsKat UK               0,98
     Pravosl.PU                  1,10
      Teol.TVU                     1,40
  Greckokat.PU                      1,54
         Fil KU                         1,68
 HudTan VŠMU                            1,71
  FilmTel VŠMU                                 2,22
    MuzUm AU                                   2,28
    HumPrír PU                                 2,31
         Fil PU                                           3,22
    Filolo UMB                                               3,68
       Fil UCM                                                   3,74
   DramUm AU                                                          4,00
     Hum UMB                                                             4,41
         Fil UK                                                              4,61
Divadelná VŠMU                                                                     5,05
       Fil UKF                                                                      5,16
        Fil TVU                                                                       5,43
      VŠVU BL                                                                              5,81
   VýtvarUm AU                                                                                 6,24
   Umení TUKE                                                                                  6,25

                  0          1           2            3           4            5           6          7


                                                                                                          117
Faculty group – SOC25
            Manažment PU

                Športu PU

               Pedag UKF         1,35
                Pedag KU         1,56
          Sredoeur.Št.UKF         1,64
              Pedag UMB           1,75
                   TV UK          1,80
                 Pedag PU          1,89
           Zdravotnícka PU            2,07
             Riadenia ŽU                2,40
           HospInfo EU BA               2,40
               Pedag TVU                2,49
                 Pedag UK                2,63
               Eur.Št. SPU                   3,24
              SocEkon UK                       3,33
                Pedas ŽU                       3,33
             Ekonom UMB                             4,04
                 Soc UKF                            4,17
               Práv UPJŠ                            4,20
           PodnMan EU BA                            4,21
             MasMed UCM                               4,38
            SocEkon TUAD                              4,40
           NárHosp. EU BA                                  5,00
                 Polit UMB                                 5,15
             VerSpr UPJŠ                                    5,21
                Manag UK                                     5,36
         MedzVzťah EU BA                                     5,44
           ZdravSoc TVU                                      5,54
          PodnHosp. EU BA                                     5,63
            Obchod EU BA                                            6,33
             Ekonom TUKE                                              6,77
           EkonomManSPU                                               6,92
               Finan UMB                                                         8,16
                  Práv UK                                                        8,24
                Práv UMB                                                                9,37
                Práv TVU                                                                       11,17
                             0    2             4             6              8           10      12


25
  In the data source (Správa o stave vysokého školstva za rok 2004, MŠ SR, July 2005) there are no data for
number planned for admission in acad. year 2004/2005 at the PU Faculty of Sports and PU Faculty of
management.
                                                                                                       118
SV7 Admissions proceedings: number of registered students in proportion to the
number of offers

This ratio ranges mostly from 40% to 98% and shows to which faculties students
submitted applications to as an "insurance policy" and which faculties they really
wanted to study at. Illustrative values would not provide a great deal of information
and it is more interesting to look at the individual groups of faculties.
Table 24: Number of students registered for full time study in proportion to the number of offers for academic
year 2004/2005
Faculty                                                                     Number of students registered for
                                                                            full time study in proportion to the
                                                                                      number of offers
Faculty of Film and Television, VŠMU                          HUM                           0,98
Faculty of Natural Sciences, ŽU                               NAT                           0,82
Faculty of Mechanical Engineering, TUKE                       TECH                          0,98
University of Veterinary Medicine                             AGRO                          0,83
Faculty of Economics, TUKE                                    SOC                           0,94
Faculty of Pharmacy, UK                                       MED                           0,83


          The criterion of the ratio of the number of registered applicants for study to
the number of offers issued by the faculty reflects the real interest of prospective
students in study. Apart from three faculties where this parameter was 0.98, which
can be considered to be 100% success, all faculties issued more offers than they
finally registered students. In the group of faculties oriented towards the humanities
there were differences up to 50% While, as expected, the greatest number of offers
led to registrations in the artistic faculties (VSMU Faculty of Music and Dance and the
VSMU Faculty of Film and Television, both 98%), the KU Faculty of Philosophy did
not register 49% of the students it offered places to. It is similar in the case of the
SOC faculty group, where 94% of those offered places registered at the TUKE
Faculty of Economics but only 52% registered at the UMB Faculty of Finance. Even
the NAT faculty group did not deviate strongly from these trends. 82% of those
offered places at the ŽU Faculty of Natural Sciences registered, while the UPJŠ
Faculty of Natural Sciences and the UK Faculty of Natural Sciences registered only
41% of those offered places, which are the lowest values from the 99 faculties
assessed. From the faculties oriented towards technology (TECH), the leaders are
three Košice faculties (TUKE Faculty of Mechanical Engineering 98%, the TUKE
Faculty of Electrical Engineering and Informatics 97% and the TUKE Faculty of
                                                                                                        119
Mining, Ecology, Process Control and Geotechnology 94%), with two faculties
     jointly at the back of the field, ŽU Faculty of Civil Engineering and STU Faculty
of Material Sciences and Technology registering 49% of offers made. The AGRO
group is led by the University of Veterinary Medicine on 83%, with the lowest value
at the SPU Faculty of Agrobiology and Food Resources with 59%. It may come as a
surprise that even the faculties in the MED group did not register all the potential
students that they made offers to. The best in this was the UK Faculty of Pharmacy
with 83% and the lowest number was at the UK Jessenius Faculty of Medicine (57%
of offers made). It is clear that this indicator can be influenced by whether a
particular faculty has a "monopoly" in an area of study or whether there more
faculties with the same or similar focus. Regional factors may also be involved.


Number of registered students in proportion to the number of offers in the
                      academic year r. 2004/2005
                                              SV7


Faculty group – MED

  100%

   90%
             83%
   80%
                           73%          73%
   70%

   60%                                                57%

   50%

   40%

   30%

   20%

   10%

    0%
             Farm UK


                           Lek UK


                                                       JessenLek UK
                                         Lek UPJŠ


                                                                                   120
Faculty group – NAT

     100%

      90%
            82%
      80%
                                69%
      70%                                      66%                 64%
                                                                                           58%
      60%
                                                                                                     51%
                                                                                                                  48%
      50%
                                                                                                                                             41%         41%
      40%

      30%

      20%

      10%

       0%
                                                                                           FMFI UK
                                                    Ekolenv TUZ


                                                                                                                                                         Prír UK
                                                                                                                                             Prír UPJŠ
                                                                                                                  Prír UCM
                                Prír UMB


                                                                  Infor.aInf.Tech.


                                                                                                       Prír UKF
            Prír ŽU


                                                                      STUBA


Faculty group – AGRO
     100%

      90%
             83%
                                           78%
      80%                                                                   75%
                                                                                                     72%
      70%
                                                                                                                             60%                         59%
      60%

      50%

      40%

      30%

      20%

      10%

      0%
                                                                                                                             BiotPotr. SPU
                                                                               Drev TUZV


                                                                                                     Les TUZV
                                           Záhrad SPU


                                                                                                                                                          Agro SPU
                VeterLek. UVL


                                                                                                                                                                     121
Faculty group – TECH

      MatTechn STUBA                      49%
              Stav ŽU                     49%
    ChemTechn. STUBA                      51%
              Stroj ŽU                     52%
       MechTron TUAD                            59%
           Hutn TUKE                             61%
             Elektr ŽU                           62%
          Stroj STUBA                             65%
      ŠpecTechn TUAD                              65%
        VýrTech TUKE                                  68%
         Elektr STUBA                                  69%
           ŠpecInž ŽU                                  70%
       EnvirTech. TUZV                                 70%
      PriemTech TUAD                                   70%
           Mech SPU                                     74%
            Stav TUKE                                   74%
           Stav STUBA                                        77%
         Archit STUBA                                        78%
            Ban TUKE                                               94%
          Elektr TUKE                                               97%
           Stroj TUKE                                               98%

                         0%   20%   40%     60%          80%       100%


                                                                     122
Faculty group – HUM

           Fil KU                                  51%
         Fil UCM                                         60%
       Filolo UMB                                        61%
       Hum UMB                                               62%
          Fil TVU                                            64%
         Teol KU                                               68%
          Fil UKF                                              69%
            Fil PU                                                  72%
       HumPrír PU                                                   72%
            Fil UK                                                         82%
     Greckokat.PU                                                           86%
    VýtvarUm AU                                                              87%
      RímsKat UK                                                             87%
      MuzUm AU                                                               89%
       Pravosl.PU                                                            89%
        Teol.TVU                                                                 90%
      Umení TUKE                                                                 91%
         Evanj UK                                                                91%
     DramUm AU                                                                    92%
        VŠVU BL                                                                   93%
  Divadelná VŠMU                                                                   95%
    FilmTel VŠMU                                                                       98%
   HudTan VŠMU                                                                         98%
                    0%   10%   20%   30%   40%   50%   60%    70%    80%    90%    100%


                                                                                       123
Faculty group – SOC
      Finan UMB                     52%
       Práv TVU                     53%
 Sredoeur.Št.UKF                    53%
   Obchod EU BA                     54%
  PodnMan EU BA                     54%
    VerSpr UPJŠ                      56%
    Ekonom UMB                            61%
 NárHosp. EU BA                            62%
    Riadenia ŽU                            62%
       Manag UK                            63%
PodnHosp. EU BA                            64%
       Pedag UK                             65%
  SocEkon TUAD                              66%
     Pedag UKF                              66%
       Soc UKF                              67%
      Eur.Št. SPU                           67%
     Pedag TVU                              67%
      Pedag KU                               68%
  HospInfo EU BA                                70%
 Zdravotnícka PU                                 71%
  ZdravSoc TVU                                   71%
      Práv UMB                                   72%
     Pedag UMB                                   72%
       Polit UMB                                 73%
   MasMed UCM                                    73%
      Pedas ŽU                                   73%
       Pedag PU                                   74%
MedzVzťah EU BA                                    76%
      Práv UPJŠ                                    76%
     SocEkon UK                                    77%
   Manažment PU                                       78%
       Športu PU                                        84%
          TV UK                                             87%
 EkonomManSPU                                               88%
         Práv UK                                              92%
    Ekonom TUKE                                               94%
                   0%   20%   40%    60%          80%          100%


                                                                      124
SV8         Number of students with foreign state citizenship divided by the
total number of students studying full time.

          The proportion of the number of students with other state citizenship than
Slovak in the overall number of full time students reflects the international character
of the university faculty. It is widely known that few foreign students study at Slovak
universities. We even have faculties (15 in total) that do not report having any
foreign students. There are four faculties (or universities) where the proportion of
foreign students is greater than 10% of the overall number of full time students: The
University of Veterinary Medicine 16.4%, VSMU Faculty of Music and Dance 12%, the
Academy of Fine Arts 11% and the TVU Faculty of Theology 10.4%.
Table 25: Proportion of students with a different state citizenship
Faculty                                                               Proportion of foreign students

Faculty of Music and Dance, VŠMU                               HUM                12%
Faculty of Natural Sciences, UK                                NAT                 1%
Faculty of Civil Engineering, ŽU                               TECH                2%
University of Veterinary Medicine                              AGRO               16%
Faculty of Health Care and Social Work, TVU                    SOC                 9%
Faculty of Pharmacy, UK                                        MED                 9%


          Since the total number of students with foreign state citizenship in Slovak
public universities is 1 535, i.e. around 1% of the total number of students, it is not
included in the final assessment of the faculties and universities (a criterion with such
a small amount of data is insufficiently robust). This says a great deal about Slovak
education, for example, such as how attractive Slovak universities and their faculties
are for foreign students or how intensively faculty and university management works
to gain students from other countries. For this reason the indicator is included in the
report as a supplementary picture of Slovak higher education.


                                                                                              125
Number of students with foreign state citizenship per total number of
                    students studying full time in the year 2004
                                                                                                                              SV8

Faculty group – MED
  10%
                 9,1%
   9%                                                        8,6%

   8%

   7%

   6%                                                                                                  5,6%
                                                                                                                                     5,0%
   5%

   4%

   3%

   2%

   1%

   0%
                     Farm UK


                                                                                                        Lek UK
                                                              JessenLek UK


                                                                                                                                             Lek UPJŠ


Faculty group – NAT
   1,2%

          1,0%
   1,0%                        0,9%
                                                  0,9%
   0,8%
                                                                  0,7%


   0,6%                                                                                 0,5%
                                                                                                       0,4%
   0,4%                                                                                                            0,3%         0,3%


   0,2%


                                                                                                                                                        0,0%
   0,0%
                                                   FMFI UK


                                                                                         Ekolenv TUZ
           Prír UK


                                                                                                                                 Prír UPJŠ


                                                                                                                                                         Prír UCM
                               Infor.aInf.Tech.


                                                                                                        Prír UMB
                                                                             Prír UKF


                                                                                                                    Prír ŽU
                                   STUBA


                                                                                                                                                                    126
Faculty group – AGRO

18%
      16,4%
16%

14%

12%

10%

 8%

 6%

 4%

 2%                    1,0%        0,8%            0,7%          0,5%        0,3%
 0%
                                   BiotPotr. SPU
                       Drev TUZV


                                                                              Les TUZV
                                                    Záhrad SPU


                                                                  Agro SPU
       VeterLek. UVL


                                                                                         127
Faculty group – TECH

      ŠpecInž ŽU     0,0%

  PriemTech TUAD     0,0%

         Stroj ŽU      0,1%

       Stroj TUKE      0,1%

       Hutn TUKE       0,1%

    VýrTech TUKE       0,1%

   MechTron TUAD       0,1%

  EnvirTech. TUZV       0,2%

 MatTechn STUBA                0,5%

        Ban TUKE               0,5%

       Stav TUKE                0,5%

      Stav STUBA                 0,6%

        Elektr ŽU                       0,8%

       Mech SPU                         0,9%

       Elektr TUKE                       1,0%

     Stroj STUBA                               1,1%

ChemTechn. STUBA                               1,1%

  ŠpecTechn TUAD                               1,1%

     Elektr STUBA                                            1,7%

     Archit STUBA                                                      2,1%

         Stav ŽU                                                                     2,6%

                0,0%          0,5%      1,0%          1,5%      2,0%          2,5%          3,0%


                                                                                                   128
Faculty group – HUM

    HumPrír PU     0,0%
        Fil TVU    0,1%
         Fil KU        0,2%
  Greckokat.PU         0,3%
     Hum UMB           0,3%
       Fil UCM         0,3%
         Fil PU         0,7%
    Filolo UMB          0,8%
   Umení TUKE            0,8%
   DramUm AU             1,0%
       Fil UKF            1,3%
     Pravosl.PU               1,7%
         Fil UK                2,0%
   VýtvarUm AU                  2,1%
       Teol KU                  2,1%
Divadelná VŠMU                     2,3%
  FilmTel VŠMU                     2,5%
    RímsKat UK                     2,5%
      Evanj UK                                 5,6%
    MuzUm AU                                          6,9%
      Teol.TVU                                                     10,4%
      VŠVU BL                                                        11,2%
 HudTan VŠMU                                                               12,0%

                  0%          2%          4%   6%       8%   10%      12%      14%


                                                                                     129
Faculty group – SOC


  Zdravotnícka PU    0,0%
 Sredoeur.Št.UKF     0,0%
    VerSpr UPJŠ      0,0%
       Pedag PU      0,0%
     Pedag TVU       0,0%
 PodnMan EU BA       0,0%
       Práv TVU      0,0%
PodnHosp. EU BA      0,0%
      Práv UPJŠ      0,0%
      Pedag KU       0,0%
       Práv UMB      0,0%
    Riadenia ŽU          0,2%
  Manažment PU           0,2%
  SocEkon TUAD           0,2%
   MasMed UCM            0,3%
 NárHosp. EU BA          0,3%
     Pedag UKF           0,3%
     Eur.Št. SPU          0,4%
  HospInfo EU BA          0,5%
   Ekonom UMB              0,6%
      Polit UMB            0,7%
   Ekonom TUKE             0,7%
       Pedag UK             0,9%
       Športu PU                1,1%
  Obchod EU BA                  1,2%
       Soc UKF                  1,3%
     SocEkon UK                  1,3%
          TV UK                  1,4%
 EkonomManSPU                    1,4%
         Práv UK                  1,6%
     Pedag UMB                    1,7%
     Finan UMB                     1,8%
       Pedas ŽU                           3,0%
       Manag UK                               3,1%
MedzVzťah EU BA                                  4,0%
   ZdravSoc TVU                                                               9,5%
                    0%     1%     2%     3%     4%   5%   6%   7%   8%   9%   10%


                                                                                     130
"University-level criteria" Group

     SV9 Unemployed graduates

       Since the number of university graduates unemployed for over 6 months was
quite negligible in September (362 graduates), it was not included in the final
assessment of the faculties and universities. Since this indicator may say a lot about
Slovak universities and will certainly interest those who are preparing to apply to
study at university, it is included in the report to add to its picture of Slovak
universities.


           5% 4,4%

           4%               3,4%3,3%

           3%
                                                    2,0%
           2%                                                   1,4%1,2%
                                                                        1,1%1,1%0,9%
           1%                                                                       0,7%0,7%0,6%0,6%
                                                                                                    0,4%0,3%
                                                                                                            0,0%0,0%0,0%0,0%
           0%
                                                                                ŽU Žilina


                                                                                                         UK Bratislava
                TU Zvolen


                                                                                                            Bratislava


                                                                                                            Bratislava

                                                                                                            Bratislava
                                                                                                          Ružomberok
                                                                                                         EU Bratislava


                                                                                                          UPJŠ Košice


                                                                                                           UVL Košice
                                                                   Bystrica


                                                                                                              Bystrica
                                                                   Trenčín


                                                                                            TvU Trnava
                            TU Košice


                                                    PU Prešov

                                                                UCM Trnava
                                        SPU Nitra


                                                                  UKF Nitra
                                                                   UMB B.
                                                                    TUAD


                                                                                                               AU B.


                                                                                                              VŠMU

                                                                                                              VŠVU
                                                                                                               STU


                                                                                                              KU


Purely for the sake of interest, we can state that at present university graduates
make up only 0.68% of unemployed graduates and the long-term trend is for this
number to fall. In practice this means that there are effectively no university
graduates among the long term unemployed because every one of them finds work
eventually (even if it is not necessarily in the area that they studied).


                                                                                                                               131
SV 10                              Students taking part in study abroad
     The number of university graduates taking part in study abroad (based on
information from the Erasmus and Leonardo programs and data from SAIA) was very
low (1 112) and therefore it was not included in the final assessment of the faculties
and universities. By way of illustration, we calculate that if every graduate from the
students currently studying at university were to spend at least one semester abroad,
which is the recommendation that has emerged from the Bologna process, this
would mean that every year 30 000 students of public universities would need to be
traveling as part of their study.


      5%
           4,2%
      4%
                    2,7%
      3%
                                     2,2%
                                         1,8%1,7%
      2%
                                                       1,3%1,2%1,2%
                                                                    1,0%1,0%
                                                                            0,7%0,7%0,6%0,6%0,6%
      1%                                                                                        0,5%0,5%                                                                                 0,4%
                                                                                                                                                                                             0,0%
      0%
                        UVL Košice


                                                                                                                                                                             ŽU Žilina
                                                                                       TU Košice
                                                                          Ružomberok


                                                                                                                                                                                         UPJŠ Košice
                                                              UKF Nitra


                                                                                                   TU Zvolen
                                     SPU Nitra


                                                                                                                            Trenčín
                                                                                                               UCM Trnava


                                                                                                                                                                TvU Trnava
                                                   Bystrica


                                                                                                                            Bystrica


                                                                                                                                       PU Prešov
           Bratislava


                                                 Bratislava


                                                 Bratislava


                                                                                                                                                   Bratislava
                                                                                                                            UMB B.

                                                                                                                             TUAD
                                                    AU B.
             VŠMU


                                                    STU


                                                                                                                                                      UK
                                                    EU


                                                                              KU


                                                                                                                                                                                                       132
Financing

     F1        Running cost expenditure per one student


       Running cost expenditure per student represents the total amount of funding
that the university gained from public sources in 2004 for its educational and
scientific    activities,   for    operation                         and                    also      for           social         purposes   (catering,
accommodation and grants for students) divided by the number of students of the
given university. The proportion spent per one student indicates the level of
equipment and the quality of the university's activity. It is related to the quality of
the environment in which students will study. The larger the volume allocated per
student, the higher the number of points won by the faculty. At the same time,
however, this parameter also reflects the requirements for study and also the
differences in the criteria that the SR Ministry of Education applies in allocating
funding to individual universities.


      180 163 160
      160
      140         129
      120             105
      100                 89
                                  71   69
       80                                   63
                                                        54          52          49
       60                                                                                   38   36   31    31           30   30
       40                                                                                                                          27   26
       20
        0
             UK Bratislava


                                                        ŽU Žilina
                                            TU Zvolen
                Bratislava


                Bratislava


                Bratislava


                                                                                                                          Ružomberok
               UVL Košice


              UPJŠ Košice


                                                                                                                         EU Bratislava
                  Bystrica


                                                                                                                              Bystrica
                                                                                              Trenčín


                                                                                                            TvU Trnava
                                                                                TU Košice

                                                                                            PU Prešov


                                                                                                                          UCM Trnava
                                                                    SPU Nitra


                                                                                            UKF Nitra


                                                                                                                              UMB B.
                                                                                               TUAD
                   AU B.

                  VŠMU
                  VŠVU


                   STU


                                                                                                                              KU


                                                                                                                                                133
F2          Success of the university's business activities


       It is good that universities are using a larger proportion of their own resources
to support and improve their main activities i.e. science and education. Universities
gain the largest part of their non-subsidy funding from their main activities (e.g.
lifelong learning, contract research etc.). In addition to this they also do some
business. The stated parameter shows that universities are no threat to the business
sector but also that at present they are not capable of earning enough through these
activities. In fact, in the case of the University of Veterinary Medicine, it would have
more funds for its main activities if it did not do any business. Under the Higher
Education Act, all costs of business activities must be covered from the revenues of
these activities.


          3,0% 2,8%
          2,5%
          2,0%      1,8%

          1,5%          1,1%1,1%
          1,0%                  0,8%0,8%
                                        0,5%0,5%0,5%0,4%
          0,5%                                          0,3%0,3%0,2%0,2%0,2%0,1%0,1%0,0%
          0,0%
                                                                             ŽU Žilina


                                                                                         UK Bratislava
                                                              TU Zvolen
                 Bratislava


                 Bratislava


                                                                                                         Bratislava
                                                                          Ružomberok
                                UPJŠ Košice

                                              EU Bratislava


                                                                                                                      UVL Košice
                   Bystrica


                                                                                              Bystrica


                                                                                                                      TvU Trnava

                                                                                                                         Trenčín
                                                                            TU Košice

                                                                                          UCM Trnava


                                                                                                         PU Prešov
                 SPU Nitra


                                                                                                         UKF Nitra
                   UMB B.


                                                                                                                            -0,1%
                                                                                                                          TUAD
                                                                                               AU B.


        -0,5%
                                                                                                           VŠMU
                   VŠVU
                    STU


                                                                              KU


                                                                                                                                    134
F3      The proportion of grant funding to the university's budget for its main
     activities

       In other countries the proportion of fund intended for the support of research
and development activities that the university or faculty gains in open competition is
very often given as one of the key criteria determining the quality of the
university/faculty. This number also reflects the level of research carried out in the
faculty or university. It also provides information about the quality of the employees
of the institution because the better the teachers and research and artistic
employees of the faculty, the more grants they will be able to obtain (obviously,
compared only within the given groups of faculties) and therefore the higher the
level of quality they will be able to offer to their students.
       Slovak universities would not be able to compete alongside the good world
universities even in this competition. The best universities (e.g. Oxford) are able to
get 50% of their budget from such sources and average ones (e.g. Oregon) obtain
around 25% of their budget in contests for funds for research and development
financing.


      8% 7,5%
             6,9%
      7%
                 5,8%
      6%
                     4,6%
      5%                 4,1%
                             3,7%
      4%                         3,2%2,9%
                                         2,6%
      3%
                                             1,8%
      2%                                         1,4%1,4%1,3%
                                                             1,0%0,8%
                                                                     0,7%0,7%0,5%0,5%
      1%
      0%
                                                   UK Bratislava


                                                                      ŽU Žilina
             TU Zvolen


                          Bratislava


                                                                     Bratislava


                                                                                                              Bratislava
                                                                                                            Ružomberok
                         UVL Košice


                                                                   UPJŠ Košice


                                                                                                           EU Bratislava
                                                                                                                Bystrica


                                                                                                                Bystrica
                                                                       Trenčín


                                                                                              TvU Trnava
                                       TU Košice


                                                                    PU Prešov


                                                                                                            UCM Trnava
                          SPU Nitra


                                                                                  UKF Nitra


                                                                                                                UMB B.
                                                                        TUAD


                                                                                                                 AU B.


                                                                                                                VŠMU
                                                                       VŠVU
                             STU


                                                                                                                KU


                                                                                                                           135
How much does quality cost?

         The American magazine U.S. News and World Report, which has been
assessing American universities for many years uses an interesting method – it asks
how much money a school needs to reach an appropriate point score. Transformed
to Slovak conditions, this means what does a university spend on one student and
one point on the quality scale in the final assessment? The ARRA report uses an
assessment of the university based on a so-called recalculated number of students
(taking into consideration the higher demands of PhD study and the lower demands
of part time study, as calculated by the Ministry of Education) and the school's
overall expenditure on its main activities. The number in the last column of Table 26
shows the amount in Slovak Crowns that the given university has to pay to enable
one of its students to get education with one point of quality (under the ARRA
method).


Table 26: Value of a point of quality calculated for one student in SKK
                                                 points       students     running costs    expenditures
                                                            recalculated                   points*students
  1 University of Trnava                           42           4 161            206 848          1 187
  2 University of Economics                        32          10 283            421 134          1 273
  3 Technical University in Zvolen                 55           3 626            269 984          1 345
  4 Technical University of Košice                 43          12 286            726 146          1 364
  5 University of Prešov                           35           7 539            375 840          1 405
  6 Slovak University of Technology                55          16 064          1 254 429          1 427
  7 Slovak University of Agriculture               46           7 737            518 300          1 448
  8 Matej Bel University                           30           9 483            408 509          1 457
  9 Constantine the Philosopher University         30           8 156            361 244          1 480
 10 Alexander Dubček University in Trenčín         32           3 130            149 603          1 503
 11 University of St. Cyril and Methodius          24           3 134            115 919          1 544
 12 University of Žilina                           39           9 165            577 490          1 626
 13 Comenius University                            52          21 812          1 860 390          1 650
 14 Catholic University                            27           3 942            189 717          1 791
 15 Pavol Jozef Šafárik University                 49           5 408            525 705          1 984
 16 University of Veterinary Medicine              80             943            160 699          2 125
 17 Academy of Music and Dramatic Arts             43             984            106 605          2 515
 18 Academy of Fine Arts and Design                51             609             96 041          3 105
 19 Academy of Arts                                37             349             45 179          3 481


         It is no surprise that the universities of the arts and those that involve
expensive studies need the largest amount of funding for achieving an equivalent
amount of quality. To put it simply, the Academy of the Arts in Banská Bystrica
provides the same level of quality as Trnava University at three times the price.


                                                                                                  136
A second, very closely related question is how universities remunerate the
      people who produce its quality, i.e. the teachers and research and artistic
employees. The universities that paid the least, relatively, for the quality that their
employees produced in 2003 were the University of Veterinary Medicine, the
Technical University in Zvolen and Comenius University, and those that paid the most
on the other hand were the Constantine the Philosopher University, the University of
Ss. Cyril and Methodius in Trnava and the Catholic University in Ružomberok.

Table 27: The value of one point of quality calculated from payroll expenditure for teachers and research and
artistic workers
                                                                 Average salary     Payroll expenditure
                                                      Points       of creative       per one point of
                                                                     worker               quality
  1 Constantine the Philosopher University              30           25 308                         845
  2 University of St. Cyril and Methodius               24           19 602                         818
  3 Catholic University                                 27           19 893                         740
  4 Matej Bel University                                30           20 731                         701
  5 University of Economics                             32           21 657                         673
  6 Alexander Dubček University in Trenčín              32           21 296                         670
  7 University of Prešov                                35           23 488                         662
  8 Academy of Arts                                     37           22 325                         600
  9 University of Žilina                                39           22 900                         591
 10 University of Trnava                                42           24 490                         585
 11 Technical University of Košice                      43           24 293                         561
 12 Academy of Music and Dramatic Arts                  43           21 526                         500
 13 Slovak University of Agriculture                    46           23 033                         498
 14 Academy of Fine Arts and Design                     51           23 445                         462
 15 Pavol Jozef Šafárik University                      49           22 447                         458
 16 Slovak University of Technology                     55           24 208                         443
 17 Comenius University                                 52           22 363                         433
 18 Technical University in Zvolen                      55           19 926                         360
 19 University of Veterinary Medicine                   80           25 303                         316


                                                                                                       137
Teachers  Applicati-  Publicati- PhD Studies   Grant
                                                                                                                    and      ons for    ons and   (VV4-VV6)    Success
                                           AGRO                                                                                                                         AVERAGE
                                                                                                                 students study (SV7) citations               (VV7-VV9)
                                                                                                                (SV1-SV5)             (VV1-VV3)
      1    University of Veterinary Medicine                           University of Veterinary Medicine             91       100         100          64         65      83,8
                                                                                                                                                                                                                                                                                 8.


      2    Faculty of Forestry                                         Technical University in Zvolen                78        87          33          56         73      65,5
      3    Faculty of Agrobiology and Food Resources                   Slovak University of Agriculture              72        71          20          58         87      61,6
      4    Faculty of Wood Sciences and Technology                     Technical University in Zvolen                70        90          11          71         43      57,1
      5    Faculty of Horticulture and Landscape Engineering           Slovak University of Agriculture              56        94           3          86         38      55,5
      6    Faculty of Biotechnology and Food Sciences                  Slovak University of Agriculture              61        72          26          36         11      41,3

                                                                                                                 Teachers  Applicati-  Publicati- PhD Studies   Grant
                                                                                                                    and      ons for    ons and   (VV4-VV6)    Success
                                           HUM                                                                                                                          AVERAGE
                                                                                                                 students study (SV7) citations               (VV7-VV9)
                                                                                                                (SV1-SV5)             (VV1-VV3)
       1   Faculty of Arts                                             Comenius University                           59        84         85          41         54       64,7
       2   Faculty of Arts                                             University of Prešov                          52        73         53          32         60       53,8
       3   Faculty of the Humanities and Natural Sciences              University of Prešov                          53        73         76          14         49       53,0
       4   Faculty of Arts                                             University of Trnava                          61        65         27          35         67       51,0
       5   Academy of Fine Arts and Design                             Academy of Fine Arts and Design               65        95          0          30         61       50,1
       6   Faculty of Theatre Arts                                     Academy of Music and Dramatic Arts            67        97          0          48         33       49,0
       7   Faculty of Film and Television                              Academy of Music and Dramatic Arts            71       100          0          58         11       47,9
       8   Faculty of Performing Arts                                  Academy of Arts                               86        91          0           0         59       47,1
       9   Faculty of Theology                                         University of Trnava                          71        92          0          61          0       44,7
      10   Orthodox Theological Faculty                                University of Prešov                          54        91          0          60         12       43,4
      11   Faculty of Music and Dance                                  Academy of Music and Dramatic Arts            73       100          0          35          5       42,6
      12   Evangelical Theological Faculty                             Comenius University                           60        93         29          25          5       42,3
      13   Roman Catholic Theological Faculty of Cyril and Methodius   Comenius University                           53        89          2          49         18       42,0
      14   Faculty of Arts                                             Constantine the Philosopher University        42        70          2          27         35       35,3
      15   Faculty of the Humanities                                   Matej Bel University                          46        63          8          25         34       35,2
      16   Faculty of Fine Arts and Design                             Academy of Arts                               62        89          0           0         23       34,6
      17   Faculty of Dramatic Arts                                    Academy of Arts                               68        94          0           0          0       32,4
      18   Faculty of Theology                                         Catholic University                           58        69          0          20          0       29,5
      19   Faculty of Arts                                             Technical University of Košice                47        93          0           0          0       28,0
      20   Greek Catholic Theological Faculty                          University of Prešov                          47        88          0           0          5       27,9
      21   Faculty of Arts                                             University of St. Cyril and Methodius         51        61          3           0         22       27,4
      22   Faculty of Philosophy                                       Catholic University                           44        52          4          15         18       26,5
      23   Faculty of Philology                                        Matej Bel University                          36        62          0           0          4       20,5

                                                                                                                 Teachers  Applicati-  Publicati- PhD Studies   Grant
                                                                                                                    and      ons for    ons and   (VV4-VV6)    Success
                                           MED                                                                                                                          AVERAGE
                                                                                                                 students study (SV7) citations               (VV7-VV9)
                                                                                                                                                                                                                                                                                 Aggregate assessment of faculties within groups


                                                                                                                (SV1-SV5)             (VV1-VV3)
      1    Faculty of Pharmacy                                         Comenius University                           89       100         100          47         60      79,3
      2    Jessenius Faculty of Medicine                               Comenius University                           87        69          33          83         91      72,3
                                                                                                                                                                                  Table 28: Assessment of faculties within Frascati groups – points scored and average results


      3    Faculty of Medicine                                         Pavol Jozef Šafárik University                80        88          44          90         52      70,7
      4    Faculty of Medicine                                         Comenius University                           97        88          37          53         40      63,0


138
Teachers  Applicati-  Publicati- PhD Studies   Grant
                                                                                                                             and      ons for    ons and   (VV4-VV6)    Success
                                          NAT                                                                                                                                    AVERAGE
                                                                                                                          students study (SV7) citations               (VV7-VV9)
                                                                                                                         (SV1-SV5)             (VV1-VV3)
      1    Faculty of Mathematics, Physics and Informatics                      Comenius University                           93        71          92          80         76      82,3
      2    Faculty of Natural Sciences                                          Comenius University                           76        50          52          92         90      72,0
      3    Faculty of Natural Sciences                                          Pavol Jozef Šafárik University                81        50          80          58         71      68,2
      4    Faculty of Ecology and Environmental Sciences                        Technical University in Zvolen                65        80           9          51         30      47,0
      5    Faculty of Informatics and Information Technologies                  Slovak University of Technology               56        78           1          48         45      45,4
      6    Faculty of Natural Sciences                                          Constantine the Philosopher University        60        62           9          67         26      44,9
      7    Faculty of Natural Sciences                                          Matej Bel University                          48        84           9          36          9      37,1
      8    Faculty of Natural Sciences                                          University of Žilina                          59       100           1          12          6      35,4
      9    Faculty of Natural Sciences                                          University of St. Cyril and Methodius         58        59           4         0            8      25,8

                                                                                                                          Teachers  Applicati-  Publicati- PhD Studies   Grant
                                                                                                                             and      ons for    ons and   (VV4-VV6)    Success
                                          SOC                                                                                                                                    AVERAGE
                                                                                                                          students study (SV7) citations               (VV7-VV9)
                                                                                                                         (SV1-SV5)             (VV1-VV3)
       1   Faculty of Health Care and Social Work                               University of Trnava                          67        76         100         96          12      70,2
       2   Faculty of Physical Education and Sports                             Comenius University                           80        93          3          42          42      51,9
       3   Faculty of Management and Informatics                                University of Žilina                          56        66          1          29         100      50,5
       4   Faculty of Sports                                                    University of Prešov                          82        89          0          26          47      48,9
       5   Faculty of Economics                                                 Technical University of Košice                57       100          9          24          48      47,5
       6   Faculty of Economics and Management                                  Slovak University of Agriculture              63        94          1          37          38      46,6
       7   Faculty of Social and Economic Sciences                              Comenius University                           79        82          0           0          42      40,6
       8   Faculty of International Relations                                   University of Economics                       59        81          5          50           7      40,4
       9   Faculty of Education                                                 Comenius University                           56        69          1          26          48      40,1
      10   Faculty of Operation and Economics of Transport and Communications   University of Žilina                          60        78          0          33          28      39,9
      11   Faculty of Education                                                 University of Prešov                          47        79          1          28          41      39,0
      12   Faculty of Education                                                 University of Trnava                          64        71          6          13          33      37,6
      13   Faculty of Law                                                       Comenius University                           60        98          1          17          8       36,8
      14   Faculty of National Economy                                          University of Economics                       62        66          7          15          35      36,7
      15   Faculty of Education                                                 Constantine the Philosopher University        51        70          0          25         31       35,7
      16   Faculty of Commerce                                                  University of Economics                       61        57          9          21          28      35,6
      17   Faculty of Law                                                       University of Trnava                          62        56          0          26          28      34,4
      18   Faculty of European Studies and Regional Development                 Slovak University of Agriculture              57        71          3          23         16       34,1
      19   Faculty of Economics                                                 Matej Bel University                          49        65          1          25          25      32,9
      20   Faculty of Business Management                                       University of Economics                       60        57          5          13          29      32,8
      21   Faculty of Management                                                Comenius University                           51        67          3          37           6      32,7
      22   Faculty of Law                                                       Pavol Jozef Šafárik University                66        81          1           2          13      32,5
      23   Faculty of Business Economics                                        University of Economics                       61        68          1          19          12      32,2
      24   Pedagogical Faculty                                                  Catholic University                           53        72          1          11          22      31,9
      25   Faculty of Economic Informatics                                      University of Economics                       51        74          7          12          14      31,8
      26   Faculty of Education                                                 Matej Bel University                          58        77          0          14           2      30,2
      27   Faculty of Political Sciences and International Relations            Matej Bel University                          51        78          0          21           0      30,1
      28   Faculty of Public Administration                                     Pavol Jozef Šafárik University                55        60          3           0          32      30,0
      29   Faculty of Law                                                       Matej Bel University                          59        77          0           1           6      28,6
      30   Faculty of Social Sciences and Health                                Constantine the Philosopher University        52        71          0           6          8       27,3
      31   Faculty of Management                                                University of Prešov                          51        83          0           0           0      26,8


139
      32   Faculty of Social and Economic Relations                             Alexander Dubček University in Trenčín        45        70          0           0          15      26,1
      33   Faculty of Mass Media Communication                                  University of St. Cyril and Methodius         44        78          0           0           3      25,0
                                                                                                                                                                                           Table 28: Assessment of faculties within Frascati groups – points scored and average results (continued)


      34   Faculty of Health Care                                               University of Prešov                          39        76          0           0           0      22,9
      35   Faculty of Finances                                                  Matej Bel University                          51        55          2           0           3      22,3
      36   Faculty of Central European Studies                                  Constantine the Philosopher University        53        56          0           0          0       21,9
Teachers  Applicati-  Publicati- PhD Studies   Grant
                                                                                                                        and      ons for    ons and   (VV4-VV6)    Success
                                        TECH                                                                                                                                AVERAGE
                                                                                                                     students study (SV7) citations               (VV7-VV9)
                                                                                                                    (SV1-SV5)             (VV1-VV3)
       1   Faculty of Chemical and Food Technology                         Slovak University of Technology               98        52         100         80         72       80,4
       2   Faculty of Electrical Engineering and Information Technology    Slovak University of Technology               73        70         22          56         71       58,6
       3   Faculty of Environmental and Manufacturing Technology           Technical University in Zvolen                71        71          1          45         84       54,5
       4   Faculty of Mining, Ecology, Process Control and Geotechnology   Technical University of Košice                53        96          5          74         38       53,4
       5   Faculty of Metallurgy                                           Technical University of Košice                71        62         17          69         39       51,7
       6   Faculty of Mechanical Engineering                               Technical University of Košice                57       100          1          51         44       50,4
       7   Faculty of Electrical Engineering and Informatics               Technical University of Košice                67        99          5          45         34       49,9
       8   Faculty of Mechanical Engineering                               University of Žilina                          70        53          1          70         56       49,8
       9   Faculty of Industrial Technologies                              Alexander Dubček University in Trenčín        55        71         16          40         60       48,4
      10   Faculty of Civil Engineering                                    Slovak University of Technology               67        79          6          48         36       47,2
      11   Faculty of Architecture                                         Slovak University of Technology               68        80          0          58         23       45,6
      12   Faculty of Mechanical Engineering                               Slovak University of Technology               70        66          5          49         38       45,5
      13   Faculty of Civil Engineering                                    Technical University of Košice                66        76          1          47         32       44,5
      14   Faculty of Agricultural Engineering                             Slovak University of Agriculture              65        76          1          36         28       41,1
      15   Faculty of Electrical Engineering                               University of Žilina                          66        63          2          43         22       39,3
      16   Faculty Manufacturing Technologies                              Technical University of Košice                53        69          1          29         39       38,2
      17   Faculty of Special Engineering                                  University of Žilina                          56        71          0          37         14       35,7
      18   Faculty of Civil Engineering                                    University of Žilina                          61        50          0          46         16       34,8
      19   Faculty of Special Technology                                   Alexander Dubček University in Trenčín        59        66          0          35          7       33,4
      20   Faculty of Material Sciences and Technology                     Slovak University of Technology               55        50          1          37         22       33,1
      21   Faculty of Mechatronics                                         Alexander Dubček University in Trenčín        46        60          1           0         35       28,3


140
                                                                                                                                                                                      Table 28: Assessment of faculties within Frascati groups – points scored and average results (continued)
9.       Aggregate assessment of financial indicators


Table 29: Assessment of universities by financial criteria – points scored
                                               Running costs Proportion of Proportion of      Average of
                                                per student     business         grants to     financial
                                                             activity yield to expenditures   indicators
              Financing                                       expenditures
                                                                for main
                                                                                 for main
                                                                                 activities
                                                                activities


Slovak University of Technology                       44              100          78            74
University of Veterinary Medicine                     99               -5          92            62
Academy of Fine Arts and Design                      100               40          24            54
Technical University in Zvolen                        39               18         100            52
Slovak University of Agriculture                      32               38          62            44
Pavol Jozef Šafárik University                        55               29          43            42
Comenius University                                   42               7           50            33
Academy of Arts                                       80               9           10            33
Technical University of Košice                        30               14          54            33
Matej Bel University                                  16               65          7             29
University of Žilina                                  33               17          35            29
Academy of Music and Dramatic Arts                    65               6           7             26
Alexander Dubček University in Trenčín                22               0           39            21
University of Economics                               19               27          9             18
University of Prešov                                  24               5           19            16
Catholic University                                   18               16          9             15
Constantine the Philosopher University                19               6           18            14
University of St. Cyril and Methodius                 16               10          14            14
University of Trnava                                  19               4           18            13


                                                                                                  141
10.      University level indicators


        The indicators within individual groups can be transformed into an assessment
of universities as a whole in a number of ways. The most natural way is to consider
the university as a whole composed of faculties. It is necessary to preserve the
principle of "comparing like with like" and therefore the assessment (number of
points) obtained by each faculty in the group to which it belongs is taken into
consideration. The average of the assessments for all the faculties of each university
are calculated in each of the five groups of indicators. The results of this calculation
are given in Table 28. The greatest significance is still given to the value of each
indicator for each faculty, which best illustrates the situation in each particular faculty
and enables a comparison with faculties with a similar orientation. To improve
orientation in the table, the universities are listed in alphabetical order (and not in
the order that they appear in, for example, in the Higher Education Act).


Table 30: Assessment of universities in group criteria based on the average assessment of their faculties (in
alphabetical order – points scored)
                                                Teachers Applicati- Publicati-
                                                                                         PhD         Grant
                                                   and    ons for    ons and
                                                                                        Studies     Success
                                                students   study    citations
Academy of Arts                                   71,9      91,2       0,0                 0,0         27,1
Academy of Fine Arts and Design                   64,7      94,9       0,0                30,0         60,7
Academy of Music and Dramatic Arts                70,3      99,0       0,0                47,2         16,2
Alexander Dubček University in Trenčín            51,2      67,0       4,2                18,8         29,0
Catholic University                               51,6      64,6        1,6               15,4         13,4
Comenius University                               72,3      80,9       33,7               45,5         44,7
Constantine the Philosopher University            51,5      66,1        2,4               25,0         20,1
Matej Bel University                              49,7      70,1       2,6                15,2         10,4
Pavol Jozef Šafárik University                    70,7      69,6       32,0               37,5         41,9
Slovak University of Agriculture                  62,6      79,6        8,9               46,0         36,3
Slovak University of Technology                   69,5      67,9       19,3               53,8         43,7
Technical University in Zvolen                    71,1      82,3       13,4               55,5         57,7
Technical University of Košice                    58,8      86,9        4,9               42,3         34,3
University of Economics                           59,0      67,4        5,5               21,8         20,9
University of Prešov                              53,1      81,5       16,1               19,9         26,8
University of St. Cyril and Methodius             51,1      65,8        2,4                0,0         10,9
University of Trnava                              64,8      72,1       26,7               46,4         27,9
University of Veterinary Medicine                 90,6     100,0      100,0               63,8         64,6
University of Žilina                              61,2      68,8        0,8               38,6         34,5


                                                                                                        142
11.      Aggregate assessment of universities


        In the same way as for the final assessment of the faculties, a final evaluation
can also be calculated for the university based on the average assessment for
individual groups of indicators. After incorporating the indicators F1 to F3 into the
average assessment of the universities (through a separate sixth table), the points
score for individual universities looks as shown in Table 31.


Table 31: Assessment of universities based on the average points scores of their faculties
         1   University of Veterinary Medicine                   80
         2   Slovak University of Technology                     55
        2=   Technical University in Zvolen                      55
         4   Comenius University                                 52
         5   Academy of Fine Arts and Design                     51
         6   Pavol Jozef Šafárik University                      49
         7   Slovak University of Agriculture                    46
         8   Technical University of Košice                      43
        8=   Academy of Music and Dramatic Arts                  43
        10   University of Trnava                                42
        11   University of Žilina                                39
        12   Academy of Arts                                     37
        13   University of Prešov                                35
        14   University of Economics                             32
       14=   Alexander Dubček University in Trenčín              32
        16   Constantine the Philosopher University              30
       16=   Matej Bel University                                30
        18   Catholic University                                 27
        19   University of St. Cyril and Methodius               24


        The table shows that it is basically possible to break down Slovak universities
into three groups. The University of Veterinary Medicine, which gained the highest
number of points, forms a group by itself, the second group consists of universities
from second to tenth place (the so-called "above average") with the second place
university being 25 points behind the university in first place. The difference between
second and tenth place is 13 points. The eleventh placed university is 3 points behind
the tenth placed one and leads the third group of universities, where the difference
between eleventh and nineteenth place is 15 points. The average value is rounded to
42 points, only ten universities scored this number or higher.
        With a degree of inaccuracy, it is also possible to divide universities into three
similar groups based on their orientation – the artistic (the Academy of Music and the
Performing Arts, the Academy of Fine Arts, the Academy of Arts), the mainly
technical (the Slovak University of Technology, Žilina University, the Technical

                                                                                             143
University in Zvolen, the Technical University of Košice) and general/mixed
      universities (all others apart from the University of Veterinary Medicine, though
nearly all those marked as general have at least one faculty oriented towards the
natural sciences and some have other faculties from other groups e.g. MED). A
comparison of universities in these groups is shown in Table 32

Table 32: Assessment of universities in areas
Artistic
      1 Academy of Fine Arts and Design                51
      2 Academy of Music and Dramatic Arts             43
      3 Academy of Arts                                37
Technical (mainly)
      1 Technical University in Zvolen                 55
     1= Slovak University of Technology                55
      3 Technical University of Košice                 43
      4 University of Žilina                           39
General
          1   Comenius University                      52
          2   Pavol Jozef Šafárik University           49
          3   Slovak University of Agriculture         46
          4   University of Trnava                     42
          5   University of Prešov                     35
          6   University of Economics                  32
         6=   Alexander Dubček University in Trenčín   32
          8   Constantine the Philosopher University   30
         8=   Matej Bel University                     30
         10   Catholic University                      27
         11   University of St. Cyril and Methodius    24


        It is more accurate to measure the performance of universities in particular
areas according to the performance achieved by the faculties that operate in the
given area. Fore example, the performance of UK in the area of NAT is determined
by the performance of its two faculties that fall into this group (the UK Faculty of
Mathematics, Physics and Informatics and the UK Faculty of Natural Sciences). The
results are shown in Table 33. For individual universities, only those faculties are
shown that belong to the same group.


                                                                                144
Table 33: Assessment of universities based on the average of their faculties

                                                     Teachers Applicati-   Publicati-
                                                       and     ons for      ons and     PhD Studies   Grants   AVERAGE
     AGRO                                            students   study      citations
 1 University of Veterinary Medicine          AGRO     89,7      100,0       100,0         62,7        64,6      83,4
 2 Technical University in Zvolen             AGRO     79,1      88,6        22,1          67,7        58,4      63,2
 3 Slovak University of Agriculture           AGRO     67,0      79,1        16,3          59,2        45,1      53,4


                                                     Teachers Applicati-   Publicati-
                                                       and     ons for      ons and     PhD Studies   Grants   AVERAGE
     HUM                                             students   study      citations
 1   Academy of Fine Arts and Design          HUM      62,3      94,9          0,0         43,4        60,7      52,3
 2   University of Trnava                     HUM      67,0      78,6          13,5        65,8        33,3      51,6
 3   Academy of Music and Dramatic Arts       HUM      68,4      99,0          0,0         57,7        16,2      48,2
 4   Comenius University                      HUM      61,0      88,4          38,7        23,7        25,8      47,5
 5   University of Prešov                     HUM      53,3      81,4          32,0        33,1        31,4      46,2
 6   Constantine the Philosopher University   HUM      43,7      70,4          2,4         42,7        35,2      38,9
 7   Academy of Arts                          HUM      68,5      91,2          0,0          0,0        27,1      37,4
 8   Catholic University                      HUM      52,9      60,7          1,9         30,1        8,9       30,9
 9   Matej Bel University                     HUM      42,7      62,8          4,1         15,4        19,2      28,8
10   University of St. Cyril and Methodius    HUM      51,8      61,2          3,4          0,0        21,8      27,7
11   Technical University of Košice           HUM      44,9      92,9          0,0          0,0        0,0       27,6


                                                     Teachers Applicati-   Publicati-
                                                       and     ons for      ons and     PhD Studies   Grants   AVERAGE
     MED                                             students   study      citations
 1 Comenius University                        MED      75,1      85,5          56,7        74,4        63,7      71,1
 2 Pavol Jozef Šafárik University             MED      65,5      88,0          43,5        89,9        51,6      67,7


                                                     Teachers Applicati-   Publicati-
                                                       and     ons for      ons and     PhD Studies   Grants   AVERAGE
     NAT                                             students   study      citations
 1   Comenius University                      NAT      87,1      60,4          72,0        85,8        82,8      77,6
 2   Pavol Jozef Šafárik University           NAT      81,4      50,0          80,3        53,3        71,2      67,2
 3   Slovak University of Technology          NAT      55,7      78,0          1,0         70,0        44,6      49,9
 4   Technical University in Zvolen           NAT      65,3      80,5          9,0         58,1        29,7      48,5
 5   Constantine the Philosopher University   NAT      61,3      62,2          9,4         72,3        26,1      46,3
 6   Matej Bel University                     NAT      59,3      84,1          8,8         43,8        8,5       40,9
 7   University of Žilina                     NAT      66,3      100,0         0,9         12,2        6,0       37,1
 8   University of St. Cyril and Methodius    NAT      72,1      58,5          3,8          0,0        8,1       28,5


                                                     Teachers Applicati-   Publicati-
                                                       and     ons for      ons and     PhD Studies   Grants   AVERAGE
     SOC                                             students   study      citations
 1   University of Trnava                     SOC      79,1      67,7          35,4        49,3        24,3      51,2
 2   Technical University of Košice           SOC      55,1      100,0         9,2         32,8        48,0      49,0
 3   Slovak University of Agriculture         SOC      69,0      82,4          2,1         34,4        27,2      43,0
 4   Comenius University                      SOC      64,4      81,7          1,6         30,6        29,3      41,5
 5   University of Economics                  SOC      60,2      67,4          5,5         29,1        20,9      36,6
 6   University of Prešov                     SOC      55,9      81,6          0,1         17,6        22,1      35,5
 7   Catholic University                      SOC      61,9      72,3          0,9         14,6        22,3      34,4
 8   University of Žilina                     SOC      54,5      71,8          0,7         36,2        64,0      33,7
 9   Matej Bel University                     SOC      61,5      70,2          0,8         15,7        7,2       31,1
10   Pavol Jozef Šafárik University           SOC      57,7      70,2          2,0          0,9        22,5      30,7
11   Constantine the Philosopher University   SOC      58,6      66,0          0,1         12,5        13,1      30,0
12   Alexander Dubček University in Trenčín   SOC      52,9      70,2          0,0          0,0        14,9      27,6
13   University of St. Cyril and Methodius    SOC      48,8      77,7          0,0          0,0        2,9       25,9


                                                                                                          145
Teachers Applicati-   Publicati-
                                                      and     ons for      ons and     PhD Studies   Grants   AVERAGE
    TECH                                            students   study      citations
1   Technical University in Zvolen           TECH     69,7      71,4         0,6          51,2        84,4      55,5
2   Slovak University of Technology          TECH     71,3      66,2         22,3         56,2        43,6      51,9
3   Technical University of Košice           TECH     61,3      83,7         5,0          49,8        37,7      47,5
4   Slovak University of Agriculture         TECH     67,8      75,5         0,5          38,2        27,8      42,0
5   University of Žilina                     TECH     63,0      59,4         0,7          50,4        26,9      40,1
6   Alexander Dubček University in Trenčín   TECH     58,6      66,0         5,6          36,4        33,7      40,1


         In other words, analysis shows that, for example, Comenius University
occupies the fourth place among universities with humanities-oriented faculties for
the performance of its humanities-oriented faculties, the same fourth place among
thirteen universities in the SOC area, but two first places – in MED, among two
universities and NAT among eight universities.


                                                                                                        146
12.     Conclusion

                 There can be no doubt that as in the past, universities are in the present
the heart and the driving force for the development of the knowledge based society.
They are irreplaceable for the prosperity and positive development of a globalizing
world. There are however, two requirements for them to carry out their tasks: that
their free spirit is preserved and that the education and research that they provide
and carry out have a high level of quality. This study may also encourage universities
and their faculties to think about their performance and to try to find ways to
improve.
           Many may be surprised by the findings that emerge from the analysis of the
results and which show that in Slovakia we do not have a compact area of quality
higher education but only so-called islands of positive deviation. We are convinced
that when these islands change into larger units and whole "continents” of quality
education and research emerge, some Slovak universities may make it into the list of
the top 20026 or 50027 universities in the world.


26
     The Times Higher Education Supplement (THES), 28 October 2005; www.thes.co.uk/statistics.
27
     http://ed.sjtu.edu.cn/en/index.htm.
                                                                                                 147

Assessment HEI 2005

  • 1.
    Report Assessment of publicuniversities and their faculties (2005) (c) ARRA, Bratislava 2005 1
  • 2.
    The report includesresults of the project „Quality assessment of research and development at the universities and institutes of Slovak Academy of Sciences in Bratislava Region“, financed by European Social Fund. This report originated also with financial aid of the following organizations: www.pss.sk www.luba.sk www.orange.sk www.worldbank.sk www.yhman.sk www.hp.sk Medial partner of ARRA is: www.trend.sk
  • 3.
    The authors ofthis report would like to thank the members of the Board of Trustees of ARRA, the Board of Advisors of ARRA, in particular prof. Brunovský, prof. Šucha, prof. Štich (the chairperson of the Board of Advisors), doc. Ferák, prof. Šlachta and others, and also Ing. M. Beblavý, the members of the Board of Trustees (in particular the chairperson Ing. J. Kollár) for their critical but always relevant comments, and also for frequent discussions, analyses and reviews of draft material in the production of the report. One of the factors that enabled ARRA to produce the following analysis was the fact that the SR Ministry of Education publishes a great deal of material and information about higher education. We would like to thank doc. RNDr. Peter Mederly, CSc. for his valuable discussion of this material. Conversations with Don Thornhill and Lewis Purser, experts that the World Bank arranged for ARRA, made a significant contribution to developing the criteria and the methodology used in the report, and they also deserve our thanks. We would like to point out, however, that the opinions presented in the following report are not necessarily identical with those of the persons named here. The ARRA Agency was able to carry out its activities thanks to contributions from its sponsors, in particular Prvá stavebná sporiteľňa, Orange Slovensko, Ľudová Banka, the World Bank, HP and others. The assessment of the work of the Bratislava faculties of universities was supported by a grant from the European Social Fund. 2
  • 4.
    Introduction When officials started to assess research in higher education in Great Britain in 1980 (the Research Selectivity Exercise [RSE], later the Research Assessment Exercise [RAE]), their aim was not only to increase universities' accountability to the general public for their activities but also to map their scientific activity and compare it with that of foreign institutions. It is noteworthy that although this process that was initially greeted with a degree of mistrust and resistance (like every reform) by the academic community in particular, not only did it bring about an increase in the number of relevant scientific publications and citations1, but in 2000, when the most recent assessment took place, 55% of higher education workplaces were ranked in the highest category of assessment. One of the factors in the success of the British system was that the results of assessment were and are directly linked to the financing of higher education2. This experience shows that the assessment of quality is an instrument for achieving goals and not a goal in and of itself. In addition, in other countries as well as Great Britain there is an independent system for the evaluation of universities, which determines their ranking according to predetermined criteria. In Slovakia there is as yet no functioning system of this sort. There has been no institution or organisation (either state or non-state) that would systematically address the evaluation of research and educational performance in higher education according to clear criteria set in advance that the general public can understand, drawing on information that is in the public domain or which can be easily obtained (e.g. using Act no. 211/2000 Coll. on free access to information). This is not a role carried out even by the Accreditation Commission, the government's advisory body. The Accreditation Commission has different tasks and objectives3. At present, although the SR Ministry of Education is trying to introduce RAE-like procedures in the complex system for accrediting universities, this is taking a relatively long time to be put into practice and make an impact. This system may also seem a little ponderous to the general public, as it is planned to carry it out in 1 The Times Higher Education Supplement (THES), 1 July 2005, p. 4. 2 Adams J., Science 296, May 2002, p. 805. 3 Section 81 and following of Act no. 131/2002 Coll. on Higher Education and changes and additions to certain acts. 3
  • 5.
    six-year cycles. Thismeans that in our fast changing world the information used in a given evaluation may not necessarily reflect the current situation in the higher education market. In Slovakia as in other countries, there is increasing pressure to enable the general public (including prospective university students, their parents and employers) and even the government and parliament to gain fast and easy access to a comprehensible overview of selected indicators that characterise or describe the quality of universities and/or their faculties. This pressure has increased sharply since the government tried to introduce financial cooperation by students in their education (tuition fees) as part of their reform package. This pressure also led to the creation of the civil association the Academic Ranking and Rating Agency (ARRA; www.arra.sk) at the end of 2004, although the idea of it has been forming for a number of years. It is not surprise that it was founded by former student leaders from the 1996 – 2002 period, who gained their own experience of study not only in Slovak higher education, but also abroad. This allowed them to compare the quality of tuition at home and abroad and to see that Slovak higher education is really in need of change. It needs it above all to enable its institutions to compete in an open European market against universities, which are already actively recruiting our students (e.g. branches of foreign universities but also Czech and Austrian universities). 4
  • 6.
    1. ARRA – independent evaluation of universities The Academic Ranking and Rating Agency (ARRA) is the first independent Slovak institution to decide to provide the public with regular reports on the quality of individual universities in Slovakia and information comparing them with each other. ARRA provides this information by fulfilling its objectives and abiding by quality evaluation procedures agreed in advance. The objectives of the ARRA civil association include: • providing the public with information on the quality of individual universities in Slovakia, • introducing a method of assessing the quality of education provided by universities in Slovakia, • creating an independent evaluation of the quality of education provided in individual study programs and fields of study in universities in Slovakia, • regularly ranking universities, the affiliated faculties and sections by the quality of the education the provide and the quality of their research and development ("ranking"), • assigning universities a rating based on the level of quality of their individual activities, • attempting to stimulate competition between individual universities and their faculties. The role of the agency is not to replace the duties and tasks of the SR government Accreditation Commission. The procedure that ARRA has used in assessing public universities (when talking about Slovak universities from now on, only public institutions will be referred to) in Slovakia in 2004, was based on the following steps: • the selection of indicators for the quality of education and research in individual universities and the assignment of a certain number of points to each faculty for the performance in this or that indicator (indicators are arranged into groups and each group of indicators gained a certain number of points), 5
  • 7.
    the division of faculties into six groups according to the so-called Frascati Manual (details given below) in order to compare only faculties that have the same orientation and similar working conditions, • assigning points scores to faculties (the ranking of faculties in individual groups according to the Frascati Manual is based on average points score in individual groups of indicators), • the calculation of the points score for universities (universities are ranked according to the average points gained by their faculties). The criteria (or indictors) by which ARRA produced its ranking focus on the intensity of "performance" and not on overall performance. For example, one of the criteria is the total number of publications by the given faculty listed in the Web of Knowledge database produced by the company Thomson Scientific Co. divided by the number of creative workers in the faculty (teachers and researchers). If the number of creative workers did not divide the overall number of publications, the size of the faculty would be the main influence and not the intensity of its work. The selection of criteria was also influenced by the fact that ARRA used only information in the public domain and did not, at least in its 2004 evaluations, request information from individual faculties. ARRA views the assessment of the performance of universities and faculties for 2004 as a pilot project. ARRA's results for 2004 will be analyzed in detail and this analysis will be used to prepare the assessment of public universities in future years. The ranking produced for the assessed institutions is drawn from incontrovertible official data and domestic and foreign sources in the public domain. Since 1 May 2004, Slovak universities are part of the EU higher education area and this has brought with it not only rights but also obligations, including the obligation to maintain and increase the quality of all their activities. Slovakia fully accepts the much-cited Bologna Process, which aims, amongst other things, to increase the competitiveness of European higher education in comparison with other parts of the world and has even incorporated it into its legislative system4. Quality higher education is the key to building a knowledge economy in Slovakia and will bring about the necessary structural changes in the country's economy over the 4 Act no. 131/2002 Coll. on Higher Education and changes and additions to certain acts. 6
  • 8.
    medium term. Tothis end, universities need to ensure balanced quality in their educational and research activities. We are convinced that full use should be made of any instruments that can contribute to the achievement of the objectives for the increased quality of Slovak universities so that Slovak universities keep up with the national and international competition and attract students from both Slovakia and abroad. 7
  • 9.
    2. The history and role of ranking and experience of it in other countries The history of ranking is not a very long one. The first institutions to be ranked were a selection of American colleges in the magazine U.S. News & World Report in 1983. The phenomenon grew rapidly however, and not only in the Anglo- Saxon countries (e.g. in Great Britain in the Times Higher Education Supplement, the Times Good University Guide, Guardian, Financial Times etc., in Canada McLean's), but also in other parts of the world (in Germany Stern, Spiegel and DAAD, in Japan Asiaweek [until 2001], Asahi Shimbun, in Poland Wprost, Perspektywy, Polityka, in Switzerland Swisup!, in China the Higher Education Institute of Shanghai Jiao Tong University among others). There is quite a good overview of the sources on ranking on the Internet5, where one can also find very specific evaluations e.g. for law faculties or institutions providing education in economics or MBA degrees (Master of Business Administration). In fact, even in Slovakia we have noticed attempts by some media to produce such an evaluation (SME, Hospodárske Noviny, TREND, .týždeň, Národná obroda, Pravda, TA3, Slovenský rozhlas, STV...), although these have been incomplete and focused on only a part of the problem. The basic and common characteristic of all foreign approaches is that they attempt to provide information to the general public, in particular to prospective students, in order to help them select a suitable school or faculty and/or area of study or study program. Ranking is not in principle an activity carried out for its own sake to put universities into "some sort of" order (although such evaluations are also published) but ranking is or tries to be an aid for people who are choosing a place to study and need orientation in the education marketplace. No ranking system can automatically identify the best faculty or university for an applicant but the information provided can be of great assistance in their decision-making. Research has shown that at present that the position of a school in this or that ladder is a secondary factor in their choice of where to study. The main factor is whether the given faculty or university will enable them to study the area of study or study program that they are interested in. It is only after that – if there are a number of providers – that they start to consider other criteria such as the availability of 5 http://ed.sjtu.edu.cn/rank/2004/Resources.htm 8
  • 10.
    accommodation, the costsassociated with study, the attractiveness of the place of study, the options for sports, cultural and other activities and also the standing of the faculty or the university among other institutions. In addition to providing information to the public and prospective students, assessments of quality aim to increase competition among universities through their output so that – as in the world's advanced economies – prospective students are guided not only by the geographical proximity of a university but also the quality of the education that it provides. We expect that the importance of quality factors will increase hand in hand with the complexity and the technical and intellectual demands of the Slovak economy. The second common characteristic of assessments is that although they use different numbers of criteria, there is nearly always a relatively small number of groups of criteria that reflect the institution's performance in research and education and related parameters, perspectives on the institution from within (students and the academic community) and also from outside (e.g. employers, or even the school's own graduates). Another very important characteristic of ranking is that every such assessment must always be looked at in terms of the criteria that it uses. In other words, every ranking corresponds only to the criteria that are chosen and used. In addition every compiler (but also every reader) may consider (and then also makes) certain indicators significantly more important than others (e.g. research performance is given a higher value than, say, the number of students per teacher) and may therefore give them a different weighting, which can in turn make a fundamental difference in the ranking of the faculties and universities in "his or her" resulting table. For this reason ranking provides an image of the university and its status alongside other universities entirely in terms of the selected indicators. For this reason also, everyone involved in creating ranking tries to choose a range of criteria and indicators that will be relevant to the broadest possible group of recipients. A number of universities insist that this form of comparison has limited significance because every university is unique and special in some way, or has its own specific characteristics. We can agree with the claims of uniqueness to some extent. However, if there are, for example, 4 faculties of law, 5 faculties of philosophy or 3 faculties of medicine, providing the same degree for the same form 9
  • 11.
    of higher education,it seems natural that we should ask which of them is the best in their group. This issue has given rise to other common arguments against ranking, that it is not possible to compare the incomparable, such as universities with 13 different faculties and a highly focused institution which is not even divided into faculties. This objection is acceptable. There is, however, a reasonable solution to this problem. Since 1963, the OECD countries (the Organization for Economic Cooperation and Development) have categorized systems of subjects in science and technology according to the Frascati Manual6, whose current version dating from 20027 divides such subjects into 6 groups: a) natural sciences, b) engineering and technology, c) medical sciences, d) agricultural sciences, e) social sciences, f) humanities. From 1 June 2005 this division will be included in Slovak law8, i.e. also in the Slovak research community.9 After the introduction of such a division into the ranking, it is clear that theological faculties will not be compared with medical faculties or technically oriented faculties with social science faculties. It will be possible to compare faculties with the same scientific orientation side by side. Prospective students will thus be able to determine which is the best faculty providing education in their area of interest. The quality of a university is also determined by the quality of its faculties (apart from the University of Veterinary Medicine and the Academy of Fine Arts, which have no faculties and are therefore assessed as a whole). It is therefore quite natural that the final ranking of universities depends on the quality of its 6 The authorship of this manual is quite often attributed incorrectly. Because the first meeting of OECD experts in this matter took place in 1963 in the Italian village of Frascati, the work that was created there was called the Manual from Frascati or The Frascati Manual. 7 Frascati Manual, 6th Edition, OECD 2002, Paris, p. 67. 8 Act no. 172/2005 Coll. on the organisation of state support for research and development and additions to Act no. 575/2001 Coll. on the organisation of government activities and the organisation of the central state administration as amended. 9 A more detailed breakdown is given in the International Standard Classification of Education (ISCED) 1997, UNESCO, November 1997. 10
  • 12.
    components. Another reasonfor the use of faculties as the basic unit for ranking is the fact that there is practically no university covering all fields of study in Slovakia. When assessing such universities it can also happen that the final result will be a certain weighted average of the quality of individual components of the university and that the weighting of the excellent faculties may not be enough to balance the weaker ones, or vice versa, the quality of the excellent faculties may cover for the weaker ones. Precisely for the reason the ranking of universities is carried out at the end, to make clear their strengths and weaknesses. It is up to the university itself whether to take measures to increase the quality of its components, so that the better faculties do not suffer because of the weaker ones. That such a system is able to function successfully is shown by the example of Great Britain and its RAE system. In the final analysis, it is up to prospective students to decide, just as employers must decide when employing graduates. And it is always better if decisions are taken on the basis of accessible and verified data rather than traditional, often inaccurate and incomplete information or rather feelings associated with to this or that institution. An essential public requirement is also an answer to the question as to what use universities make of their public funding and how effectively they manage them. For example, for 2003, the National Council of the Slovak Republic approved subsidies for public funds to public universities amounting to SKK 8.3 billion, for 2004 SKK 9.4 billion and an extra billion for 2005 This means that in three years universities spent at least SKK 28.1 billion from public funds. The proposed state budget for 2006 allocates SKK 11.6 billion to public higher education. It is reasonable to ask what quality students, graduates and society as a whole gets from this money, i.e. whether and to what extent these funds really improve this segment of the research and education process for which they were originally intended. 11
  • 13.
    3. Classification of faculties ARRA's approach in assessing Slovak universities is the same as is used elsewhere in the world and is based on a number of pillars. The first is quantitative information in the public domain, which is generally accepted as a reliable indicator of academic quality. The second is an independent viewpoint and results. The third is a group (cluster) approach to the assessment of faculties and universities. The faculties of Slovak universities were divided into groups based on their field of study using the definitions given in the Frascati Manual as follows: • natural sciences (NAT) consisting of mathematics and computer sciences, physical sciences, chemical sciences, biological sciences and Earth and related environmental sciences • engineering and technology (TECH) consisting of civil engineering, electrical engineering, mechanical engineering and other engineering and technological sciences, • medical sciences (MED) including basic medicine and dentistry, clinical medicine and pharmaceutical sciences (nursing and healthcare are included in the social sciences), • agricultural sciences (AGRO) consisting of agriculture, forestry, fisheries, veterinary medicine and allied subjects, • social sciences (SOC) including psychology, economics, educational sciences, law, political science, nursing, healthcare, other social sciences. • humanities (HUM) are history, languages and literature and other humanities. Some higher education faculties are hard to categorize into a particular subject area due to the diversity of their components (e.g. departments), which carry out activities lying in multiple subject areas. An example is the faculties of philosophy, whose activities cover the areas of both the humanities and the social sciences. They were classified according to the subject area into which the majority of activities fall. If the dean of a particular faculty contacts us to request that the faculty that he or she manages should be classified in a different subject area, ARRA considers the request. 12
  • 14.
    Table1: Classification offaculties (or universities) into subject areas according to ARRA10 University Group Faculty Abbreviation Akadémia umení (Academy of Arts) AU Banská Bystrica HUM Fakulta dramatických umení DramUm AU www.aku.sk (Faculty of Dramatic Arts) HUM Fakulta muzických umení MuzUm AU (Faculty of Performing Arts) HUM Fakulta výtvarných umení VýtvarUm AU (Faculty of Fine Arts and Design) Ekonomická univerzita (University of Economics) EU BA Bratislava SOC Fakulta hospodárskej informatiky HospInfo EU BA www.euba.sk (Faculty of Economic Informatics) SOC Fakulta medzinárodných vzťahov MedzVzťah EU BA (Faculty of International Relations) SOC Fakulta podnikového manažmentu PodnMan EU BA (Faculty of Business Management) SOC Národohospodárska fakulta NárHosp EU BA (Faculty of National Economy) SOC Obchodná fakulta Obchod EU BA (Faculty of Commerce) SOC Podnikovohospodárska fakulta PodnHosp EU BA (Faculty of Business Economics) Katolícka univerzita (Catholic University) KU Ružomberok HUM Filozofická fakulta Fil KU www.ku.sk (Faculty of Philosophy) SOC Pedagogická fakulta Pedag KU (Pedagogical Faculty) HUM Teologická fakulta Teol KU (Faculty of Theology) Prešovská univerzita (University of Prešov) PU Prešov HUM Fakulta humanitných a prírodných vied HumPrír PU www.unipo.sk (Faculty of the Humanities and Natural Sciences) SOC Fakulta manažmentu Manag PU (Faculty of Management) SOC Fakulta športu TV PU (Faculty of Sports) SOC Fakulta zdravotníctva Zdravotnícka PU (Faculty of Health Care) HUM Filozofická fakulta Fil PU (Faculty of Arts) HUM Gréckokatolícka bohoslovecká Greckokat PU (Greek Catholic Theological Faculty) SOC Pedagogická fakulta Pedag PU (Faculty of Education) HUM Pravoslávna bohoslovecká fakulta Pravosl PU (Orthodox Theological Faculty) Slovenská poľnohospodárska univerzita (Slovak University of Agriculture) SPU Nitra AGRO Fakulta agrobiol. potr.zdr. Agro SPU www.uniag.sk (Faculty of Agrobiology and Food Resources) AGRO Fakulta biotechnológie a potravinárstva BiotPotr SPU (Faculty of Biotechnology and Food Sciences) SOC Fakulta ekonomiky a manažmentu EkonomMan. SPU (Faculty of Economics and Management) SOC Fakulta európskych štúdií Eur.ŠT. SPU (Faculty of European Studies and Regional Development) AGRO Fakulta záhradníctva a krajinného inžinierstva Záhrad SPU (Faculty of Horticulture and Landscape Engineering) TECH Mechanizačná fakulta Mech SPU (Faculty of Agricultural Engineering) 13
  • 15.
    University Group Faculty Abbreviation Slovenská technická univerzita (Slovak University of Technology) STUBA Bratislava TECH Fakulta architektúry Archit STUBA www.stuba.sk (Faculty of Architecture) TECH Fakulta elektrotechniky a informatiky Elektr STUBA (Faculty of Electrical Engineering and Information Technology) TECH Fakulta chemickej a potravinárskej technológie ChemTechn STUBA (Faculty of Chemical and Food Technology) NAT Fakulta informatiky a informačných technológií Infor.aInf.Tech. STUBA (Faculty of Informatics and Information Technologies) TECH Materiálovotechnologická fakulta MatTechn STUBA (Faculty of Material Sciences and Technology) TECH Stavebná fakulta Stav STUBA (Faculty of Civil Engineering) TECH Strojnícka fakulta Stroj STUBA (Faculty of Mechanical Engineering) Technická univerzita Košice (Technical University of Košice) TUKE Košice SOC Ekonomická fakulta Ekonom TUKE www.tuke.sk (Faculty of Economics) TECH Fakulta BERG Ban TUKE (Faculty of Mining, Ecology, Process Control and Geotechnology) TECH Fakulta elektrotechniky a informatiky Elektr TUKE (Faculty of Electrical Engineering and Informatics) HUM Fakulta umení Umení TUKE (Faculty of Arts) TECH Fakulta výrobných technológií VýrTech TUKE (Faculty Manufacturing Technologies) TECH Hutnícka fakulta Hutn TUKE (Faculty of Metallurgy) TECH Stavebná fakulta Stav TUKE (Faculty of Civil Engineering) TECH Strojnícka fakulta Stroj TUKE (Faculty of Mechanical Engineering) Technická univerzita Zvolen (Technical University in Zvolen) TUZV Zvolen AGRO Drevárska fakulta Drev TUZV www.tuzvo.sk (Faculty of Wood Sciences and Technology) NAT Fakulta ekológie a environmentalistiky Ekolenv TUZ (Faculty of Ecology and Environmental Sciences) TECH Fakulta environmentálnej a výrobnej techniky EnvirTech TUZV (Faculty of Environmental and Manufacturing Technology) AGRO Lesnícka fakulta Les TUZV (Faculty of Forestry) Trenčianska univerzita A. Dubčeka (Alexander Dubček University in Trenčín) TUAD Trenčín TECH Fakulta mechatroniky MechTron TUAD www.tnuni.sk (Faculty of Mechatronics) TECH Fakulta priemyselných technológií PriemTechn TUAD (Faculty of Industrial Technologies) SOC Fakulta sociálno-ekonomických vzťahov SocEkon TUAD (Faculty of Social and Economic Relations) TECH Fakulta špeciálnej techniky ŠpecTechn TUAD (Faculty of Special Technology) Trnavská univerzita (University of Trnava) TVU Trnava SOC Fakulta zdravotníctva a sociálnej práce ZdravSoc TVU www.truni.sk (Faculty of Health Care and Social Work) HUM Filozofická fakulta Fil TVU (Faculty of Arts) SOC Pedagogická fakulta Pedag TVU (Faculty of Education) SOC Právnicka fakulta Práv TVU (Faculty of Law) HUM Teologická fakulta Teol TVU (Faculty of Theology) 14
  • 16.
    University Group Faculty Abbreviation Univerzita Komenského (Comenius University) UK Bratislava HUM Evanjelická bohoslovecká fakulta Evanj UK www.uniba.sk (Evangelical Theological Faculty) SOC Fakulta managementu Manag UK (Faculty of Management) NAT Fakulta matematiky, fyziky a informatiky FMFI UK (Faculty of Mathematics, Physics and Informatics) SOC Fakulta sociálnych a ekonomických vied SocEkon UK (Faculty of Social and Economic Sciences) SOC Fakulta telesnej výchovy a športu TV UK (Faculty of Physical Education and Sports) MED Farmaceutická fakulta Farm UK (Faculty of Pharmacy) HUM Filozofická fakulta Fil UK (Faculty of Arts) MED Jesseniova lekárska fakulta JessenLek UK (Jessenius Faculty of Medicine) MED Lekárska fakulta Lek UK (Faculty of Medicine) SOC Pedagogická fakulta Pedag UK (Faculty of Education) SOC Právnicka fakulta Práv UK (Faculty of Law) NAT Prírodovedecká fakulta Prír UK (Faculty of Natural Sciences) HUM Rímskokatolícka cyrilomet. bohoslovecká fakulta RímsKat UK (Roman Catholic Theological Faculty of Cyril and Methodius) Univerzita Konštantína Filozofa (Constantine the Philosopher University) UKF Nitra NAT Fakulta prírodných vied Prír UKF www.ukf.sk (Faculty of Natural Sciences) SOC Fakulta sociálnych vied Soc UKF (Faculty of Social Sciences and Health) SOC Fakulta stredoeurópskych štúdií Stredoeur.Št. UKF (Faculty of Central European Studies) HUM Filozofická fakulta Fil UKF (Faculty of Arts) SOC Pedagogická fakulta Pedag UKF (Faculty of Education) Univerzita Mateja Bela (Matej Bel University) UMB Banská Bystrica SOC Ekonomická fakulta Ekonom UMB www.umb.sk (Faculty of Economics) SOC Fakulta financií Finan UMB (Faculty of Finances) HUM Fakulta humanitných vied Hum UMB (Faculty of the Humanities) SOC Fakulta politických vied a medzinár. vzťahov Polit UMB (Faculty of Political Sciences and International Relations) NAT Fakulta prírodných vied Prír UMB (Faculty of Natural Sciences) HUM Filologická fakulta Filolo UMB (Faculty of Philology) SOC Pedagogická fakulta Pedag UMB (Faculty of Education) SOC Právnicka fakulta Práv UMB (Faculty of Law) Univerzita Pavla Jozefa Šafárika (Pavol Jozef Šafárik University) UPJŠ Košice SOC Fakulta verejnej správy VerSpr UPJŠ www.upjs.sk (Faculty of Public Administration) MED Lekárska fakulta Lek UPJŠ (Faculty of Medicine) SOC Právnicka fakulta Práv UPJŠ (Faculty of Law) NAT Prírodovedecká fakulta Prír UPJŠ (Faculty of Natural Sciences) 15
  • 17.
    University Group Faculty Abbreviation Univerzita sv. Cyrila a Metoda (University of St. Cyril and Methodius) UCM Trnava SOC Fakulta masmed.kom. MasMed UCM www.ucm.sk (Faculty of Mass Media Communication) NAT Fakulta prírodných vied Prír UCM (Faculty of Natural Sciences) HUM Filozofická fakulta Fil UCM (Faculty of Arts) Univerzita veterinárskeho lekárstva AGRO Košice UVL (University of Veterinary Medicine) www.uvm.sk Vysoká škola múzických umení (Academy of Music and Dramatic Arts) VŠMU Bratislava HUM Divadelná fakulta Divadelná VŠMU www.vsmu.sk (Faculty of Theatre Arts) HUM Filmová a televízna fakulta FilmTel VŠMU (Faculty of Film and Television) HUM Hudobná a tanečná fakulta HudTan VŠMU (Faculty of Music and Dance) Vysoká škola výtvarných umení HUM Bratislava VŠVU (Academy of Fine Arts and Design) www.vsvu.sk Žilinská univerzita (University of Žilina) ŽU Žilina TECH Elektrotechnická fakulta Elektr ŽU www.utc.sk (Faculty of Electrical Engineering) SOC Fakulta PEDAS Pedas ŽU (Faculty of Operation and Economics of Transport and Communications) NAT Fakulta prírodných vied Prír ŽU (Faculty of Natural Sciences) SOC Fakulta riadenia a informatiky Riadenia ŽU (Faculty of Management and Informatics) TECH Fakulta špeciálneho inžinierstva ŠpecInž ŽU (Faculty of Special Engineering) TECH Stavebná fakulta Stav ŽU (Faculty of Civil Engineering) TECH Strojnícka fakulta Stroj ŽU (Faculty of Mechanical Engineering) x 10 10 The stated list of public universities was composed according to Annex 1 of Act no. 131/2002 Coll. on higher education as amended, and the names of all universities were given alphabetically. The list of faculties was composed according to a report of the Ministry of Education to the SR National Council in July 2005. Some information was taken from material from the Centre for Equivalence of Diplomas in Bratislava. The ARRA list includes all public universities apart from the J. Selye University in Komarno, which has not completed the education cycle for even the first level of university education. The list of faculties does not include seminaries of the catholic faculty. In 2005 private universities operated in Slovakia in addition to the public universities (numbers in parentheses: full time students, part time students called external ones): - the Bratislava College of Law, BVŠP (167, 354), - St. Elizabeth's University of Health and Social Work, VŠZaSP (0, 1181), - College of Economics and Management of Public Administration, VŠEM (41, 463), - College of Management in Trenčin, VŠM (620, 131). Private universities are not, however, currently included in ARRA's assessments. The main reason is that nearly all private universities (apart from the College of Management in Trenčin) are relatively new and therefore in 2004 did not have any graduates. Data on them are also less accessible and incomplete. 16
  • 18.
    4. Quality criteria ARRA selected a number of criteria from those initially proposed and discussed with domestic and foreign experts, as shown in Table 2: Table 2: Criteria for assessing the quality of universities Criteria for assessing the quality of universities Category Num. Label Title Institution’s 1 ** RP1 Graduates’ quality (employers’ view) A reputation 2 RP2 Peer review 3 * VV1 Number of scientific publications in WoK database in 1995 – 2004 per number of creative workers (CW) 4 * VV2 Number of citations per CW according to the WoK database 5 * VV3 Number of scientific publications from VV1 with more than 5 citations per CW 6 * VV4 Number of PhD students in full time study (year 2004) in proportion to the number of professors and associate professors 7 * VV5 Average annual number of PhD graduates in 2002 - 2004 in proportion to the number of associate professors and professors Science and 8 * VV6 Number of PhD students in full time study in proportion to the total number of B research students studying full time in 2004 9 VV6a PhD studies’ success rate 10 * VV7 Combined grant funding from the VEGA and KEGA agencies per one creative worker in 2004 11 * VV8 Funding from AR (applied research), ISTC (international scientific and technical cooperation) and ASST (Agency for the Support of Science and Technology) grants per one creative worker 12 * VV9 Overall grant funding per one creative worker (2004) 13 VV10 Grant funding from the European Social Fund 14 SK1 Students with Internet access at the faculty 15 SK2 Students with Internet access at the dormitory 16 SK3 Number of students accommodated in a dormitory in proportion to overall number of dormitory applications Students’ 17 SK4 Number of students with scholarships granted by a university C comfort 18 SK5 Possibilities for sport and cultural life at the university 19 SK6 Number of subjects taught with literature accessible via Internet 20 SK7 Number of students attending the students survey on quality of education 21 SK8 How have the results of a students survey on quality of education manifested in quality and organisation of educational process? 22 * SV1 Number of students divided by the number of teachers 23 * SV2 Number of students divided by the number of professors and associate professors 24 * SV3 The ratio of teachers with a PhD to the total number of teachers 25 * SV4 The number of professors and associate professors divided by the number of all teachers 26 * SV5 Average age of professors holding a functional position (active professor) Study and D 27 ** SV6 Admissions proceedings: ratio of actual number of applications received to the education planned number 28 * SV7 Admissions proceedings: number of registered students in proportion to the number of offers 29 ** SV8 Number of students with foreign state citizenship divided by the total number of students studying full time 30 ** SV9 Number of university graduates unemployed for over 6 months 31 ** SV10 Students taking part in study abroad 32 * F1 Regular expenditure per one student E Financing 33 * F2 Success of the university's business activities 34 * F3 The proportion of grant funding to the university's budget for its main activities From the given list, data was available only for those criteria that are marked with one or with two stars. The criteria RP1, SV6, SV8, SV9 and SV10 are mentioned 17
  • 19.
    in this reportbut they are not included in the final score for the universities. The reason why several of the approved criteria were not used is that the report is the result of a pilot project and not all the information was accessible at the time of assessment. In the case of some indicators the collection of data was still not complete or collection would require more time and be expensive. These include: - the results of student surveys, - the results of surveys among teachers in individual faculties, - information on the financing of individual faculties. In some cases the data for all schools are extremely low and therefore – to prevent the assessment from being too dependent on fluctuation in small numbers – they were not included in the scoring, although they are mentioned in the report (they are marked with two stars) Some data were available only for universities as a whole and not for individual faculties (in Table 2 they are highlighted in turquoise). These are included in the final assessment of the universities but not, however, of their faculties. Numbers for professors and associate professors refer to the number of chairs occupied in 2004. 18
  • 20.
    5. Basic characteristics of the indicators and their classification into groups The indicators that ARRA uses are classified in a number of materially compact groups. For purposes of clarity, this section lists the basic characteristics of the individual indicators and classifies them into groups. The names of the groups provide sufficient explanation of why a given indicator belongs in its group. A more detailed analysis of the indicators is given in Part 8, in which specific examples will be used to show how they affect the assessment.11 "Science and Research" Category "Publications and citations" Group VV1 Number of scientific articles12 in proportion to the number of creative workers (CW), i.e. teachers and researchers and artistic employees with higher education, in periodicals registered in the Thomson database for the years 1995 – 2004.13 VV2 Number of citations in proportion to the number of CW. Only citations of papers included in VV1 will be counted. Citations of papers published in or before 1994 will therefore not be included. The decisive factor is whether the given work appeared in the database as at 31 December 2004. VV3 The number of papers published in the years 1995 – 2004, for which more than 5 citations had been registered by 31 December 2004, divided by the number of CW in the faculty. "PhD Studies" Group VV4 The ratio of the number of PhD students in full time study to the number of professors and associate professors. As a rule, associate professors and professors 11 Unless stated otherwise, information given relates to 2004. 12 The terms publication and citation hereafter refer to publications from the stated database and citation in papers included in it. 13 http://www.thomson.com/scientific/scientific.jsp, Thanks to the SR Ministry of Education, all universities in Slovakia have access to this database as do the university's teachers and research and artistic employees, the Accreditation Commission, the SR Ministry of Education and the Slovak Academy of Sciences 19
  • 21.
    supervise PhD students(and a small number of holders of scientific ranks IIa and I, about whom there is no information in the public domain) and this is one of the duties of their employment under the Higher Education Act no. 131/2002 Coll. VV5 The annual average number of PhD graduates in the period 2002 -2004 divided by the number of professors and associate professors in 2004. Since the number of graduates fluctuates from year to year, it has been necessary to expand the time scale for the collection of these data. As a baseline we took the minimum length of full time PhD study under applicable legislation, i.e. 3 years. VV6 The proportion of the number of PhD students in full time study to the total number of students studying full time in 2004. "Grant Success" Group VV7 Overall grant funding from the VEGA and KEGA agencies per creative worker. VV8 Funding from AR (applied research) ISTC (international scientific and technical cooperation) and ASST (agency for the support of science and technology) grants per creative worker. VV9 Total grant funding for each creative worker. "Study and Education" Category14 "Students and Teachers" Group SV1 The number of students in full and part time study divided by the number of teachers. Points are awarded so that the lower the number of students per teacher the higher the number of points. 14 Where students are referred to in this category of indicators, it refers to students in bachelors and masters programs studying both full and part time. The only exception is indicator SV10, which includes – where information is available – full time PhD students. Where it is not explicitly stated (e.g. financing), students are not recalculated according to the SR Ministry of Education formula. 20
  • 22.
    SV2 The number of students studying full and part time divided by the number of teachers. Points are awarded in the same way as for indicator SV1. SV3 The proportion of teachers with PhD to the total number of teachers. It is assumed that every professor and associate professor in a functional position has a PhD. SV4 The ratio of teachers with a PhD to the total number of teachers. SV5 The average age of active professors. Points are awarded using the value of the formula 100/(average age of professors). The term active professor (associate professor) refers to any person who occupies the functional position of a professor or associate professor15. "Applications for study" Group SV6 Admissions proceedings: the number of applications submitted to the planned number to be admitted, i.e. the number of applications to study divided by the number of study places offered by the faculty. SV7 Admissions proceedings: number of registered students to the number of applicants accepted, i.e. the number of applicants registered divided by the number of places offered for study. SV8 Number of students with foreign state citizenship divided by the total number of students studying full time. "University Level Criteria" Group SV9 Number of graduates unemployed for longer than 6 months per 100 university graduates in 2004. 15 Act no. 131/2002 Coll. on higher education and changes and additions to certain acts. 21
  • 23.
    SV10 Number of students taking part in study abroad through the Erasmus and Socrates programs and using SAIA grants, per 100 students of the university. "Financing" Category F1 Running costs expenditure from state funding for one student of the university. F2 The proportion of the result of the university's business activities to the overall costs of its main activities. This indicator reflects the proportion of its research and education expenditure that the institution is able to cover from its own business activities. F3 The proportion of funds from public grants (VEGA, KEGA, AP MŠ, APVT a MVTS) to the overall costs of its main activities. This indicator shows what part of its expenditure the institution is able to gain through the active efforts of its employees in free competition for public funds made available to support research and development. "Reputation" Category RP1 Quality of graduates (from the perspective of employers). The weekly magazine TREND cooperated with ARRA to carry out a survey of businesses belonging to the Association for the Development of Human Resources (a questionnaire sent to around 110 firms operation in Slovakia). The conclusions from the information gained are not included in the final score for the faculties and universities and will be published separately. 22
  • 24.
    6. Method for the assessment of faculties and universities The indicators listed in Chapter 5 have been selected to ensure that a higher score corresponds to higher performance. For example, one of the indicators is the number of students to one professor or associate professor. The higher this number is, the less likely it is that professors and associate professors can give individual attention to students. From the perspective of individual approach, which ARRA considers to be most beneficial for students, it is better if this indicator has a lower value. If, however, we consider its inverted value (the number of associate professors and professors for a hundred students), a higher level of performance in the faculty corresponds to a higher value of this indicator. The number of students includes both full and part time students. The degree awarded to a part time student is the same as the degree awarded to a full time student and the quality of education provided to both should be the same, so teachers should pay the same amount of attention to full and part time students. In most cases the number in the table is the same as the indicator. There are only three exceptions: • SV1 shows the number of teachers per hundred full and part time students, • SV2 shows the number of professors and associate professors per hundred full and part time students. • SV5 shows the number 100/(average age of active professors). The faculty that scored the highest in a particular indicator is assigned 100 points. The other faculties receive points by linear interpolation, with zero points being assigned to a zero value. Each faculty of each university is assessed in the group to which it was assigned in Chapter 4. The overall ranking of faculties in each group depends on the average points scores in the groups of indicators. The overall ranking of universities is based on the average points scores of their faculties. Details are given in later chapters. 23
  • 25.
    Method for theassessment of faculties and universities An example for illustration purposes may be the indicator VV1 (number of publications per creative worker) and the faculty group AGRO (which covers a relatively small number of faculties). Table 3: Values of the VV1 indicator for faculties in the AGRO group Faculty Creative workers Published Ratio Points papers University of Veterinary Medicine 183 1077 5,89 100 Faculty of Forestry TUZV 83,8 187 2,23 38 Faculty of Biotechnology and Food Sciences SPU 54,7 90 1,65 28 Faculty of Agrobiology and Food Resources SPU 159,2 151 0,95 16 Faculty of Wood Sciences and Technology TUZV 123,9 62 0,50 9 Faculty of Horticult. and Landscape Engineering SPU 69,9 7 0,10 2 The first column contains the name of the faculty (for other faculties see the collected results), the second column contains the number of creative workers, the third column gives number of publications in the WoK database for 1995 – 2004. The next column has the number of publications for each creative worker followed by the number of points corresponding to this number in this group (calculated as the value in the fourth column divided by the highest value in the fourth column multiplied by a hundred and rounded to a whole number). The next step is to combine the values for indicators VV1, VV2 and VV3 into summary values for the "Publications and Citations" indicator group (see Table 4). Table 4: Assignment of scores for the "Publications and Citations" indicator group for faculties in the AGRO group Faculty VV1 VV2 VV3 Points University of Veterinary Medicine 100 100 100 100 Faculty of Forestry TUZV 26 38 36 33 Faculty of Biotechnology and Food Sciences SPU 31 28 19 26 Faculty of Agrobiology and Food Resources SPU 32 16 11 20 Faculty of Wood Sciences and Technology TUZV 19 9 4 11 Faculty of Horticult. and Landscape Engineering SPU 5 2 4 3 The first three columns show the number of points that each of the faculties gained in the "Publications and Citations" indicator group. The last column shows the number of points calculated as the average of all the indicators belonging to the group. The values in this column are transferred to the final assessment of the faculties in the group and the overall assessment of the universities. The method used to prepare the output value for universities is shown in Table 5. The Technical University in Zvolen is given as an example. 24
  • 26.
    Table 5: Assessmentof a university by individual areas and overall Faculty Teachers and Applications Publications PhD Grants Average University's Students for study and citations studies score Faculty of Forestry 82 87 33 62 73 67 Faculty of Wood Sciences and Technology 77 90 11 74 43 59 Faculty of Environmen. and Manufactur. Technology 70 71 1 51 84 55 Faculty of Ecology and Environmental Sciences 65 80 9 58 30 49 Technical University in Zvolen 57,6 The evaluations that each faculty received in the indicator groups are given in individual columns, with the names of the groups being given in the first row. For example, the number 33 in the row for the Faculty of Forestry and the column "Publications and Citations" is taken from Table 4. The results for all indicator groups are then summed and divided by the number of indicators (total/5). The resulting score for the whole university is the average score of its faculties. The overall evaluation of the universities also includes a sixth group of indicators (Financing, F1 – F3), in which data are available only for the university as a whole. In Table 5, the Faculties of Forestry and Wood Sciences and Technology have points from the AGRO Group (Table 4), the Faculty of Ecology and Environmental Sciences from the NAT group and the Faculty of Environmental and Manufacturing Technology from the TECH group. A few more notes need to be given on this scheme for the assessment of faculties and universities. - The most significant information is given in Table 3. This informs us the number of publications from the faculty for the 1995 – 2004 period. This number can be compared with foreign institutions or institutes of SAV (the Slovak Academy of Sciences) working in the same area. ARRA will carry out such a comparison in the near future. - The benchmark for faculties' success in a given indicator is the most successful Slovak faculty in the relevant group, not some comparison point from abroad, so it is necessary to compare the relevant data in the tables and not the point score. - It is necessary to bear in mind that the gradual aggregation of information (the creation of averages of averages as can be most clearly seen in the data for the university in Table 5) the information value of the ranking changes, becoming relative. - In the ideal scenario, the analysis would go even deeper and instead of faculties as a whole we would assess, and compare with each other and with foreign 25
  • 27.
    groups, relatively homogenousgroups within the faculty corresponding approximately to fields of studies. Such an analysis cannot currently be performed using data in the public domain. It is however ARRA's ambition for the future to assess also individual study programs in similar/related areas. 26
  • 28.
    7. Commentary on individual indicators16 Science and research "Publications and citations" Group17 VV1 Number of scientific publications and number of creative workers The scientific performance of individual faculties can be assessed in various ways Around the world, the most widely recognized approach is to use the number of publications, citations, major awards, ability to obtain research funding in open competition. The VV1 criterion is based on the number of publications calculated for one creative worker (CW) in the time period 1995 to 2004, i.e. 10 years. The term creative worker refers to all teachers and research and artistic employees of the faculty with higher education. A publication is any work that is recorded in the WoS database18 for the ten-year period 1995 – 2004. A work is included in the ARRA analysis if at least one of its authors papers in a faculty of a public university in SR19. The current ARRA analysis does not take into consideration the number of authors of the given work (publication). A survey of the database shows that the average number of papers published by authors from public universities in SR increased gradually in the 1995 – 2004 period – in 1995 there were 999 papers and in 2004 the number had increased to 1273. In 2004 public universities in SR had a total of 9 810.5 teachers and 1 269 research and artistic workers in with higher education, representing a total of 11 079.5 creative workers. This means that for each worker 0.12 papers were published in 2004. The results in the tables and graphs published in this ARRA report show that the average number of papers per creative worker depend to a large extent on the groups of faculties given in the Frascati Manual. 16 To decode a abbreviation of a faculty in the graphs please have a look at the Table 1 in Chapter 3. 17 The selection of data from a ten-year period disadvantages faculties that have existed for a shorter time. It should therefore be assumed that their ranking in this group of indicators might improve in future. A ten-year period for the assessment of scientific performance is the generally used standard. 18 The Thomson Web of Knowledge (WoK) includes the following databases: Web of Science (WoS), Science Citation Index Expanded (SCI-EXPANDED), Social Sciences Citation Index (SSCI), Arts & Humanities Citation Index (A&HCI) (available for the years 1985 to 2005) and Essential Science Indicators (ESI). The WoK database (including WoS and ESI) is available to all employees of all universities, the Slovak Academy of Sciences, the Accreditation Commission and the SR Ministry of Education. 19 Where the name of the author could not be linked to a faculty from the database, the link was made through the list of university (faculty) employees on the web page. 27
  • 29.
    Table 6: Numberof papers for the years 1995 – 2004 per one creative worker (situation in 2004) Group Papers published in 1995 – 2004 per one creative worker TECH 0,0 – 7,8 NAT 0,1 – 5,8 AGRO 0,2 – 3,2 MED 1,1 – 3,2 SOC 0,0 – 2,5 HUM 0,0 – 0,6 A number of faculty employees, especially in the groups SOC and HUM often publish their work in periodicals that are not included in the WoK database. This means that the approach has a negative impact on the arts faculties in particular. Nevertheless the ARRA analysis includes only papers from the WoK database. The reasons for this are as follows: - the WoK database is in the public domain, which is in accordance with ARRA's data collection plan, - the inclusion of a magazine in the WoK database provides a certain guarantee of quality, since inclusion is based on an assessment of the level of the published articles, the history of the periodical and the like, - the WoK database is a source of bibliographic data that is recognized by the general academic community - the WoK database is available from any location in the world and the data it contains can be compared internationally, - in each group of faculties there are faculties that have publications in the WoK database, which shows that it is possible to publish in periodicals that are in this database; the fears of discrimination in some faculties and fields of study are reduced by the fact that they are compared only within their own group and with faculties that have the same or a similar orientation, - assessments of universities and social sciences in other countries20 are based on similar principles of records of publications in the WoK. Other important scientific papers that WoS does not record are patents and monographs (or articles in monographs). We believe that these types of publication are included in the survey to a certain extent, even if indirectly. Monographs or 20 E.g. THES, October 21, 2005, p. 10. 28
  • 30.
    chapters in themare produced mainly from the results of the scientific papers of their author or authors. These scientific results are as a rule also published in articles in recognized periodicals. A quite natural question to ask is whether the numbers stated in individual graphs and tables for indicator VV1 are low, average or high. Comparison with other assessments of a similar type in other countries led to the conclusion that they are on the low side. A serious answer to this question depends on a comparison with the faculties of other – foreign – universities or comparison with the results of non- university scientific institutions (e.g. the institutes of the Slovak Academy of Sciences). As one of the first, ARRA will make a comparison with the individual institutes of SAV in the near future. (Red lines in the graphs indicate average values). Number of publications per one creative worker in 2004 VV1 Faculty group – MED 3,5 3,21 3,0 2,5 2,0 1,5 1,42 1,30 1,11 1,0 0,5 0,0 Farm UK JessenLek UK Lek UK Lek UPJŠ 29
  • 31.
    0,0 0,5 1,0 1,5 2,0 2,5 3,0 3,5 0 1 2 3 4 5 6 7 VeterLek. UVL 3,15 Prír UPJŠ 5,80 FMFI UK 4,40 Agro SPU 1,01 Faculty group – AGRO Prír UK 3,97 Faculty group – NAT BiotPotr. SPU 0,97 Ekolenv TUZ 0,96 Prír UMB 0,70 Les TUZV 0,82 Prír UKF 0,63 Drev TUZV Prír UCM 0,61 0,33 Infor a InfTech 0,18 STUBA Záhrad SPU 0,16 Prír ŽU 0,15 30
  • 32.
    Faculty group –TECH ŠpecTechn TUAD 0,00 ŠpecInž ŽU 0,00 Archit STUBA 0,02 Stav ŽU 0,08 Stroj TUKE 0,08 Stroj ŽU 0,11 Mech SPU 0,12 VýrTech TUKE 0,12 EnvirTech. TUZV 0,14 MatTechn STUBA 0,20 MechTron TUAD 0,21 Stav TUKE 0,23 Elektr ŽU 0,31 Stroj STUBA 0,38 Stav STUBA 0,58 Ban TUKE 0,61 Elektr TUKE 0,63 PriemTech TUAD 1,62 Elektr STUBA 2,03 Hutn TUKE 2,25 ChemTechn. STUBA 7,80 0 1 2 3 4 5 6 7 8 9 31
  • 33.
    Faculty group –HUM VýtvarUm AU 0,00 VŠVU BL 0,00 Umení TUKE 0,00 Teol.TVU 0,00 Teol KU 0,00 Pravosl.PU 0,00 MuzUm AU 0,00 HudTan VŠMU 0,00 Greckokat.PU 0,00 Filolo UMB 0,00 FilmTel VŠMU 0,00 DramUm AU 0,00 Divadelná VŠMU 0,00 Fil UKF 0,03 Fil UCM 0,04 RímsKat UK 0,04 Fil KU 0,07 Hum UMB 0,10 HumPrír PU 0,25 Fil TVU 0,27 Evanj UK 0,38 Fil UK 0,48 Fil PU 0,62 0,0 0,1 0,2 0,3 0,4 0,5 0,6 0,7 32
  • 34.
    Faculty group –SOC Zdravotnícka PU 0,00 Športu PU 0,00 Sredoeur.Št.UKF 0,00 SocEkon UK 0,00 SocEkon TUAD 0,00 Soc UKF 0,00 Práv UMB 0,00 Práv TVU 0,00 Pedas ŽU 0,00 Pedag UMB 0,00 MasMed UCM 0,00 Manažment PU 0,00 Pedag UKF 0,02 Polit UMB 0,02 Pedag PU 0,04 PodnHosp. EU BA 0,05 Práv UPJŠ 0,06 Pedag KU 0,06 Práv UK 0,07 EkonomManSPU 0,07 Pedag UK 0,08 Ekonom UMB 0,09 Riadenia ŽU 0,09 Finan UMB 0,16 Pedag TVU 0,16 Manag UK 0,19 TV UK 0,21 VerSpr UPJŠ 0,22 EurŠt SPU 0,24 PodnMan EU BA 0,33 MedzVzťah EU BA 0,33 HospInfo EU BA 0,42 NárHosp. EU BA 0,45 Ekonom TUKE 0,50 Obchod EU BA 0,62 ZdravSoc TVU 2,46 0,0 0,5 1,0 1,5 2,0 2,5 3,0 33
  • 35.
    VV2 Number of citations per CW according to the WoS database Citations represent another indicator of scientific performance that is widely accepted around the world, in particular of the domestic and international response to the published results of the scientific work of individuals and work groups. In discussions of this indicator there have been a number of misunderstandings, which is why we give more space to its explanation. In the WoS database, every work is linked to information about the number of times and in which papers it has been cited, and the citations of each author's work can be found. Citations for all papers come only from the periodicals for which WoS collects information The papers whose citations are analyzed here are precisely those papers that were included in indicator VV1, i.e. papers published in the years 1995 – 2004 and recorded in the WoS database. For example, if an author in a particular faculty published a work in 1994 (i.e. before the monitored period), which has a number of citations, neither this work nor its citations are included in the current ARRA analysis. If the work was published in 2002, the work appears in the VV1 indicator and its citations will be counted in the VV2 indicator. This leads to a certain reduction in the number of citations but this is not considered to be a fundamental problem. The same conditions were applied to each university in the study. This reduction has also helped to capture the current situation, which is more important for today's prospective students than the rich scientific history of the university since its foundation. Citations for papers published in the years 1995 – 2004 are accumulating in 2005 and will continue to accumulate in future years. The analysis of citations was carried out as at 31 December 2004, and therefore the set of citations includes only those from before this date. A classic problem in analyzing citations is excluding self-citations, i.e. citations of papers where at least one of the authors of the citing work is one of the authors of the cited work. When calculating the number of citations of the work of a given author, especially in career progression, self-citations are not taken into consideration. The ARRA analysis however includes self-citations. The available and suitable software for the analysis of publications and citations does not contain filters that could exclude self-citations. The time requirements for "manual" filtering would 34
  • 36.
    be extremely high.We believe, however, that the removal of self-citations would not have a significant effect on the results presented here. Just for information, employees of Slovak universities published a total of 11 163 papers that are recorded in WoK in the period 1995 – 2004. 43 545 citations of these papers were recorded. Of these 11 163 papers, however, 3 382 papers i.e. 30%, did not receive a single citation. This fact shows that even the papers' own author did not cite it during this period. As mentioned above, the number of citations was determined for the period 1995 – 2004 for papers that were published in the same period. In the HUM group, only 6 faculties recorded any result, with the other 17 (of which 8 are faculties of art) having no record. The situation is the same in the SOC group – 19 faculties out of a total of 36 did not record any data. The VV2 indicator combined with the VV1 indicator makes possible certain comparisons with the highest international level. If we divide result VV2 by result VV1, we get the average number of citations for one published paper. Some of the more successful faculties of public universities in SR are shown in Table 7. Table 7: Average number of citations per paper for certain faculties of public universities, 1995 – 2004 Faculty Average number of citations per one paper Faculty of Mathematics, Physics and Informatics, UK 8,30 Faculty of Natural Sciences, UK 4,24 Faculty of Chemical and Food Technology, STUBA 4,19 Faculty of Medicine, UPJŠ 4,11 Faculty of Pharmacy, UK 3,99 Jessenius Faculty of Medicine, UK 3,98 Faculty of Natural Sciences, UPJŠ 3,77 Faculty of Medicine, UK 3,60 University of Veterinary Medicine 1,87 It is also possible to give a comparison of this indicator for all Slovak public universities. 35
  • 37.
    Table 8: Averagenumber of citations per paper for Slovak public universities, 1995 – 2004 University Average number of citations per paper (1995 – 2004) Comenius University, Bratislava 5,2 Slovak University of Technology, Bratislava 3,9 Pavol Jozef Šafárik University, Košice 3,9 University of Trnava, Trnava 3,7 Matej Bel University, Banská Bystrica 2,2 Alexander Dubček University in Trenčín, Trenčín 2,1 Constantine the Philosopher University, Nitra 2,1 University of Veterinary Medicine, Košice 1,9 Technical University of Košice, Košice 1,7 Technical University in Zvolen, Zvolen 1,5 University of St. Cyril and Methodius, Trnava 1,1 Slovak University of Agriculture, Nitra 1,0 University of Žilina, Žilina 0,9 University of Prešov, Prešov 0,3 University of Economics, Bratislava 0,3 Catholic University, Ružomberok 0,2 Academy of Arts, Banská Bystrica 0,0 Academy of Music and Dramatic Arts, Bratislava 0,0 Academy of Fine Arts and Design, Bratislava 0,0 21 A comparison with other countries can be made fairly simply because THES uses the same methodology. First those of the best universities: Table 9: Average number of citations per paper for some of the most successful universities in the world, 1995 – 2004 University Average number of citations per paper published in 1995 – 2004 Harvard University 20,6 Princeton University 17,7 Stanford University 17,3 University of California, Berkeley 16,0 ETH Zurich 14,0 Cambridge University 12,9 Oxford University 12,2 Middle of the table in the stated magazine: Table 10: Average number of citations per paper for some other universities from around the world, 11095 – 2004 University Average number of citations per paper published in 1995 – 2004 University of British Columbia 10,1 Copenhagen University 8,7 Osaka University 7,3 La Sapienza University Roma 7,8 21 The Times Higher Education Supplement (THES), 7 October 2005, p. 9. 36
  • 38.
    From this comparisonwe can see that not even the relatively successful faculties of Slovak public universities (apart from the UK Faculty of Mathematics, Physics and Informatics) achieve even a medium position in the average number of citations for a published paper. Number of citations per creative worker in 1995 – 2004 VV2 Faculty group – MED 14 12,81 12 10 8 5,85 6 4,68 4,43 4 2 0 Farm UK Lek UK Lek UPJŠ JessenLek UK Faculty group – NAT 40 36,5 35 30 25 21,9 20 16,8 15 10 5 2,0 1,5 1,1 0,4 0,0 0,0 0 FMFI UK Ekolenv TUZ Prír UK Prír UPJŠ Prír UCM STUBA Prír UMB Prír UKF InfTech Prír ŽU Infor a 37
  • 39.
    Faculty group –AGRO 7 5,89 6 5 4 3 2,23 2 1,65 0,95 1 0,50 0,10 0 BiotPotr. SPU Drev TUZV Les TUZV VeterLek. Záhrad SPU Agro SPU UVL Faculty group – TECH ŠpecTechn TUAD 0,00 ŠpecInž ŽU 0,00 EnvirTech. TUZV 0,00 Archit STUBA 0,01 Stav ŽU 0,01 Mech SPU 0,03 VýrTech TUKE 0,05 Stroj TUKE 0,08 Stroj ŽU 0,09 MechTron TUAD 0,12 MatTechn STUBA 0,16 Stav TUKE 0,26 Elektr ŽU 0,39 Elektr TUKE 1,10 Ban TUKE 1,35 Stroj STUBA 1,50 Stav STUBA 1,78 Hutn TUKE 3,60 PriemTech TUAD 3,76 Elektr STUBA 6,90 32,64 ChemTechn. STUBA 0 5 10 15 20 25 30 35 38
  • 40.
    Faculty group –HUM VýtvarUm AU 0,00 VŠVU BL 0,00 Umení TUKE 0,00 Teol.TVU 0,00 Teol KU 0,00 RímsKat UK 0,00 Pravosl.PU 0,00 MuzUm AU 0,00 HudTan VŠMU 0,00 Greckokat.PU 0,00 Filolo UMB 0,00 FilmTel VŠMU 0,00 Fil KU 0,00 DramUm AU 0,00 Divadelná VŠMU 0,00 Fil UKF 0,01 Fil UCM 0,01 Hum UMB 0,02 Evanj UK 0,05 Fil TVU 0,07 Fil PU 0,11 HumPrír PU 0,17 Fil UK 0,20 0,0 0,1 0,1 0,2 0,2 0,3 39
  • 41.
    Faculty group –SOC Zdravotnícka PU 0,00 Športu PU 0,00 Sredoeur.Št.UKF 0,00 SocEkon UK 0,00 SocEkon TUAD 0,00 Soc UKF 0,00 Práv UMB 0,00 Práv UK 0,00 Práv TVU 0,00 Polit UMB 0,00 PodnHosp. EU BA 0,00 Pedas ŽU 0,00 Pedag UMB 0,00 Pedag UKF 0,00 MasMed UCM 0,00 Manažment PU 0,00 EurŠt SPU 0,00 Ekonom UMB 0,00 PodnMan EU BA 0,01 EkonomManSPU 0,02 Pedag PU 0,02 Pedag KU 0,02 Pedag UK 0,02 VerSpr UPJŠ 0,04 Práv UPJŠ 0,04 MedzVzťah EU BA 0,04 Manag UK 0,05 Riadenia ŽU 0,05 Finan UMB 0,06 TV UK 0,11 NárHosp. EU BA 0,17 Obchod EU BA 0,17 HospInfo EU BA 0,20 Ekonom TUKE 0,36 Pedag TVU 0,51 ZdravSoc TVU 10,46 0 2 4 6 8 10 12 40
  • 42.
    VV3 The number of papers published in the years 1995 – 2004, for which more than 5 citations had been registered within that faculty, divided by the number of creative workers in the faculty. One of the criteria that can show the impact that faculties or universities have had on scientific progress around the world is to set a minimum number of references (citations) for publications by authors from the faculty. In the ARRA analysis, the original intention was to identify and analyze numbers of papers with a high number of citations, which could relate to the presence of strong scientific personalities in individual faculties. It turned out, however, that even if you choose only 10 as the minimum number of citations (and it is normal to study 50 and even more), the majority of faculties in Slovak universities did not have even one such paper in the period from 1995 to 2004. For this reason, ARRA, taking into consideration the Slovak research community, decided to use a more generous threshold value in this evaluation period. This analysis includes the indicator VV3 so that it provides information on the number of papers with more than 5 citations per publication (including self-citations). From 97 faculties and two universities with no faculties (hereafter we shall discuss 99 faculties) only 37 faculties, i.e. approximately one third, met this criterion. In the HUM group there was not even one (the values 0.007 and 0.006 are basically insignificant, and we again emphasize that 8 of the faculties are faculties of art), in the SOC group only the TVU Faculty of Healthcare and Social Work in Trnava and the TVU Faculty of Education in Trnava have such papers while the other 4 faculties are close to zero. The UK Faculty of Mathematics, Physics and Informatics lead the NAT GROUP with a value of 0.8, the STU Faculty of Informatics and Information Technology and the ŽU Faculty of Natural Sciences rank lowest in the table with a value of 0. In other groups the situation is the same. In TECH the STU Faculty of Chemical and Food Technology had a score of 2.3, which is the highest of any of the studied faculties. It is surprising that only 8 of the 21 TECH faculties met this criterion. In the case of MED faculties, the best is the UK Faculty of Pharmacy with 0.9, the UK Faculty of Medicine and Jessenius Faculty of Medicine had identical scores of 0.3. For the sake of interest, we can again state that only 2 595 of the 11 163 papers produced by Slovak universities in the period 1995 – 2004 met the criterion 41
  • 43.
    (and more thanthree fifths of these came from three faculties – the STU Faculty of Chemical and Food Technology, the UK Faculty of Mathematics, Physics and Informatics, and the UK Faculty of Natural Sciences), i.e. for each creative worker there 0.023 such papers per year. Number of published papers with more than 5 citations per number of creative workers VV3 Faculty group – MED 1,0 0,87 0,9 0,8 0,7 0,6 0,5 0,4 0,35 0,29 0,3 0,26 0,2 0,1 0,0 Farm UK Lek UK Lek UPJŠ JessenLek UK Faculty group – NAT 0,9 0,8 0,76 0,7 0,62 0,6 0,5 0,4 0,32 0,3 0,2 0,10 0,07 0,06 0,1 0,03 0,00 0,00 0,0 FMFI UK Ekolenv TUZ Prír UK Prír UPJŠ Prír UCM STUBA Prír UMB Prír UKF InfTech Prír ŽU Infor a 42
  • 44.
    Faculty group –AGRO 0,45 0,39 0,40 0,35 0,30 0,25 0,20 0,14 0,15 0,10 0,07 0,04 0,05 0,02 0,01 0,00 BiotPotr. SPU Drev TUZV Les TUZV VeterLek. Záhrad SPU Agro SPU UVL 43
  • 45.
    Faculty group –TECH VýrTech TUKE 0,000 ŠpecTechn TUAD 0,000 ŠpecInž ŽU 0,000 Stroj ŽU 0,000 Stav ŽU 0,000 MechTron TUAD 0,000 Mech SPU 0,000 EnvirTech. TUZV 0,000 Archit STUBA 0,000 Stroj TUKE 0,005 Stav TUKE 0,009 MatTechn STUBA 0,010 Elektr ŽU 0,025 Ban TUKE 0,075 Stroj STUBA 0,096 Elektr TUKE 0,098 Stav STUBA 0,119 Hutn TUKE 0,271 PriemTech TUAD 0,334 Elektr STUBA 0,426 ChemTechn. STUBA 2,266 0,0 0,5 1,0 1,5 2,0 2,5 44
  • 46.
    0,000 0,001 0,002 0,003 0,004 0,005 0,006 0,007 0,008 HumPrír PU 0,007 Fil UK 0,006 0 Divadelná VŠMU 0 DramUm AU 0 Evanj UK Faculty group – HUM 0 Fil KU 0 Fil PU 0 Fil TVU 0 Fil UCM 0 Fil UKF 0 FilmTel VŠMU 0 Filolo UMB 0 Greckokat.PU 0 HudTan VŠMU 0 Hum UMB 0 MuzUm AU 0 Pravosl.PU 0 RímsKat UK 0 Teol KU 0 Teol.TVU 0 Umení TUKE 45 0 VŠVU BL 0 VýtvarUm AU
  • 47.
    Faculty group –SOC Zdravotnícka PU 0 VerSpr UPJŠ 0 TV UK 0 Športu PU 0 Sredoeur.Št.UKF 0 SocEkon UK 0 SocEkon TUAD 0 Soc UKF 0 Riadenia ŽU 0 Práv UPJŠ 0 Práv UMB 0 Práv UK 0 Práv TVU 0 Polit UMB 0 PodnMan EU BA 0 PodnHosp. EU BA 0 Pedas ŽU 0 Pedag UMB 0 Pedag UKF 0 Pedag UK 0 Pedag PU 0 Pedag KU 0 MedzVzťah EU BA 0 MasMed UCM 0 Manažment PU 0 Manag UK 0 Finan UMB 0 EurŠt SPU 0 EkonomManSPU 0 Ekonom UMB 0 NárHosp. EU BA 0,007 HospInfo EU BA 0,009 Obchod EU BA 0,010 Ekonom TUKE 0,024 Pedag TVU 0,047 ZdravSoc TVU 0,619 0,0 0,1 0,2 0,3 0,4 0,5 0,6 0,7 46
  • 48.
    "PhD studies" Group VV4 The number of PhD students in full time study in proportion to the number of professors and associate professors As a rule only a few associate professor and professors supervise PhD students (and a small number of holders of scientific degree IIa and I, about whom there is no information in the public domain). This indicator shows the proportion of the faculty's (university's) supervision capacity that is used. The most successful faculties in the individual groups of faculties in this indicator are shown in Table 11. Table. 11: The number of PhD students in full time study in proportion to the number of professors and associate professors22 Faculty PhD students (full time)/ (number of profs. and assoc. profs.) Orthodox Theological Faculty, PU HUM 1,67 Faculty of Informatics and Inform. Technolog., STUBA NAT 1,58 Faculty of Mining, Ecol., Process Cont. and Geot., TUKE TECH 1,25 Faculty of Horticulture and Landscape Engineering, SPU AGRO 1,74 Faculty of International Relations, EU BA SOC 1,97 Faculty of Medicine, UPJŠ MED 0,86 These numbers can also be compared with top foreign universities. In the cited article in THES it shows that Oxford University has a "staff" of around 3 000 and approximately 3 000 postgraduate students. At first glance, this would correspond to number 1 in Table 11 and would be the same as in our faculties. There are however a number of differences. Oxford University is significantly more productive in scientific work than our faculties; the papers of its teachers and research workers are cited significantly more often and it is also much better financed. If the results of our faculties in indicator VV4 are compared and at the same time indicators VV1 – VV2 and indicators VV7 – VV8 are taken into consideration, it is clear that in several faculties with high numbers of PhD students, publication success and success in obtaining grants are relatively low. The question then arises whether it is possible to provide quality education for PhD students in such a situation. The following graphs and Table 12 clearly show that there is practically no correlation between the quality of scientific performance in our 22 In this and other tables we always give the best faculty from each of the six groups, unless stated otherwise 47
  • 49.
    universities and thenumber of PhD students23, which is quite an alarming discovery. What is more, the SR Ministry of Education allocates funds for paying PhD students to universities for this purpose. It is clear that this allocation is not based on the scientific performance of the faculty. The following graphs illustrate the low relatedness of the parameters (the blue points represent faculties, the red line the relatedness of parameters), the correlation coefficient is given in Table 12 (the highest correlation is if the correlation coefficient R equals 1. The lower the value, the lower the correlation. If the value of R is lower than 0.8, it is statistically impossible to speak about a demonstrable mutual relation between variables (correlation)). Publikácie a doktorandi Published papers and PhD students PhD students / (professors doc.) prof.) 14 Doktorandi/(prof. a + assoc. 12 10 8 6 4 2 0 0 1 2 3 4 5 6 7 8 Published papers per creative worker Publikácie na tvorivého pracovníka Citations and doktorandi Citácie a PhD students PhD students / (professors + assoc. prof.) 14 12 Doktorandi/(prof. a doc.) 10 8 6 4 2 0 0 5 10 15 20 25 30 35 40 Citations per creativepracovníka Citácie na tvorivého worker 23 Both full and part time PhD students are counted. The difference between these two groups should not be in the quality of the education and the scientific work of the supervisor but only in the length of study. 48
  • 50.
    Granty a doktorandi Grants and PhD students PhD students / (professors + assoc. prof.) 14 12 Doktorandi/(prof. a doc.) 10 8 6 4 2 0 0 100 200 300 400 500 Granty na tvorivého pracovníka Grants per creative worker Table 12: Correlation coefficient (R) for the number of PhD students in full time study per professor and the data from the previous graphs Graph 1 Graph 2 Graph 3 Correlation coefficient 0,14 0,12 0,10 The ratio of the number of full time PhD students to the number of professors and associate professors reflects not only the efforts of the faculty to provide itself with a young, successor generation, but also the "exploitation" of supervisors. It may be noticed that the average values cover the fact that there are professors and associate professors that supervise a number of PhD students and also some who supervise no one. It should be the task and power of the faculty to analyze and address issues relating to its own human resources. 49
  • 51.
    The number offull time PhD students in proportion to the number of professors and associate professors in 2004 VV4 Faculty group – MED 0,9 0,86 0,84 0,8 0,7 0,6 0,57 0,57 0,5 0,4 0,3 0,2 0,1 0 Lek UK JessenLek UK Farm UK Lek UPJŠ Faculty group – NAT 1,8 1,58 1,6 1,49 1,37 1,4 1,30 1,2 1,06 1 0,80 0,8 0,63 0,6 0,4 0,17 0,2 0,00 0 FMFI UK Ekolenv TUZ Prír UK Infor.aInf.Tech. Prír UCM Prír UMB Prír ŽU Prír UKF Prír UPJŠ STUBA 50
  • 52.
    Faculty group –AGRO 2 1,8 1,74 1,6 1,4 1,18 1,2 1,09 1 0,92 0,83 0,78 0,8 0,6 0,4 0,2 0 BiotPotr. SPU Drev TUZV Les TUZV Záhrad SPU Agro SPU VeterLek. UVL 51
  • 53.
    Faculty group –TECH MechTron TUAD 0,00 ŠpecInž ŽU 0,63 VýrTech TUKE 0,66 Mech SPU 0,71 MatTechn STUBA 0,73 Stav TUKE 0,74 Elektr ŽU 0,84 Elektr TUKE 0,86 Stroj TUKE 0,89 ŠpecTechn TUAD 0,90 EnvirTech. TUZV 0,91 Elektr STUBA 0,97 Stroj STUBA 0,98 Stav ŽU 1,00 Hutn TUKE 1,02 Stav STUBA 1,03 Stroj ŽU 1,09 Archit STUBA 1,09 PriemTech TUAD 1,11 ChemTechn. STUBA 1,18 Ban TUKE 1,25 0 0,2 0,4 0,6 0,8 1 1,2 1,4 52
  • 54.
    Faculty group –HUM VýtvarUm AU 0,00 Umení TUKE 0,00 MuzUm AU 0,00 Greckokat.PU 0,00 Filolo UMB 0,00 Fil UCM 0,00 DramUm AU 0,00 Evanj UK 0,29 RímsKat UK 0,36 HumPrír PU 0,38 Teol KU 0,62 Fil KU 0,63 Hum UMB 0,67 Fil UK 0,67 HudTan VŠMU 0,67 VŠVU BL 0,74 Fil PU 0,79 Fil TVU 0,91 Fil UKF 0,96 Divadelná VŠMU 1,06 FilmTel VŠMU 1,16 Teol.TVU 1,31 1,67 Pravosl.PU 0 0,2 0,4 0,6 0,8 1 1,2 1,4 1,6 1,8 53
  • 55.
    Faculty group –SOC Zdravotnícka PU 0,00 VerSpr UPJŠ 0,00 Sredoeur.Št.UKF 0,00 SocEkon UK 0,00 SocEkon TUAD 0,00 Práv UPJŠ 0,00 Práv UMB 0,00 MasMed UCM 0,00 Manažment PU 0,00 Finan UMB 0,00 Soc UKF 0,18 HospInfo EU BA 0,35 NárHosp. EU BA 0,37 PodnMan EU BA 0,37 Pedag TVU 0,38 Pedag UMB 0,39 Pedag KU 0,44 Práv UK 0,61 Obchod EU BA 0,62 PodnHosp. EU BA 0,64 Polit UMB 0,69 Pedag UK 0,75 Ekonom UMB 0,82 Pedag UKF 0,86 Športu PU 0,86 Eur.Št. SPU 0,86 Práv TVU 0,97 Ekonom TUKE 1,09 Pedas ŽU 1,12 Pedag PU 1,22 EkonomManSPU 1,24 Manag UK 1,25 TV UK 1,30 Riadenia ŽU 1,32 ZdravSoc TVU 1,74 MedzVzťah EU BA 1,97 0 0,5 1 1,5 2 2,5 54
  • 56.
    VV5 Average annual number of PhD graduates in 2002 - 2004 in proportion to the number of associate professors and professors. One of the problems of PhD study in Slovakia is the relatively low numbers who have completed it. ARRA's analysis shows that the success rate in PhD studies in our faculties is around 30%. By including indicator VV5, ARRA hopes to add to the analysis not only the number of PhD students but also in a certain sense also includes the success of PhD studies. For illustration, here are few examples. Table 13: The average annual number of PhD graduates in proportion to the number of professors and associate professors in 2002 – 2004. Faculty Average number of PhD graduates in proportion to the number of profs. and assoc. profs. Roman Cath. Theol. Faculty of Cyr. and Meth., UK HUM 0,60 Faculty of Natural Sciences, UK NAT 0,36 Faculty of Mining, Ecol., Process Cont. and Geot., TUKE TECH 0,37 Faculty of Horticulture and Landscape Engineering, SPU AGRO 0,52 Faculty of Health Care and Social Work, TVU SOC 1,61 Faculty of Medicine, UPJŠ MED 0,57 The average number of PhD graduates in proportion to the number of professors and associate professors in 2002 – 2004 VV5 Faculty group – MED 0,6 0,57 0,5 0,4 0,29 0,3 0,2 0,13 0,09 0,1 0 Farm UK Lek UK Lek UPJŠ JessenLek UK 55
  • 57.
    Faculty group –NAT 0,4 0,36 0,35 0,30 0,3 0,27 0,25 0,19 0,19 0,19 0,2 0,15 0,1 0,06 0,05 0,05 0,00 0 FMFI UK Ekolenv TUZ Prír UK Prír UPJŠ Prír UCM Prír UMB Infor.aInf.Tech. Prír UKF Prír ŽU STUBA Faculty group – AGRO 0,6 0,53 0,5 0,39 0,4 0,3 0,25 0,23 0,20 0,2 0,1 0,00 0 BiotPotr. SPU Drev TUZV Les TUZV VeterLek. Záhrad SPU Agro SPU UVL 56
  • 58.
    Faculty group –TECH PriemTech TUAD 0,00 MechTron TUAD 0,00 ŠpecTechn TUAD 0,03 VýrTech TUKE 0,09 Mech SPU 0,11 EnvirTech. TUZV 0,11 Stav STUBA 0,12 Stav ŽU 0,12 MatTechn STUBA 0,13 Elektr ŽU 0,14 Stroj STUBA 0,14 Elektr TUKE 0,14 ŠpecInž ŽU 0,17 ChemTechn. STUBA 0,17 Archit STUBA 0,19 Elektr STUBA 0,21 Stroj TUKE 0,23 Stav TUKE 0,24 Hutn TUKE 0,29 Stroj ŽU 0,33 0,37 Ban TUKE 0 0,05 0,1 0,15 0,2 0,25 0,3 0,35 0,4 57
  • 59.
    Faculty group –HUM VýtvarUm AU 0,00 Umení TUKE 0,00 Teol KU 0,00 MuzUm AU 0,00 Greckokat.PU 0,00 Filologická UMB 0,00 Filozofická UCM 0,00 Filozofická KU 0,00 DramUm AU 0,00 VŠVU BL 0,02 Teol.TVU 0,03 Filozofická UKF 0,05 HumPrír PU 0,07 HudTan VŠMU 0,12 Hum.vied UMB 0,13 Filozofická TVU 0,14 Divadelná VŠMU 0,16 Filozofická PU 0,19 FilmTel VŠMU 0,19 Pravosl.PU 0,28 Evanj UK 0,29 Filozofická UK 0,38 RímsKat UK 0,60 0 0,1 0,2 0,3 0,4 0,5 0,6 0,7 58
  • 60.
    Faculty group –SOC Zdravotnícka PU 0,00 VerSpr UPJŠ 0,00 Športu PU 0,00 Stred.Eur.Št.UKF 0,00 SocEkon UK 0,00 SocEkon TUAD 0,00 Pedag KU 0,00 MasMed UCM 0,00 Manažment PU 0,00 Finan UMB 0,00 Eur.Št. SPU 0,00 Ekonom TUKE 0,00 Riadenia ŽU 0,02 Pedag TVU 0,05 Práv UMB 0,06 Soc UKF 0,08 Práv UPJŠ 0,08 Práv TVU 0,10 Pedag UMB 0,11 Pedag PU 0,11 Práv UK 0,15 Polit UMB 0,17 PodnMan EU BA 0,20 HospInfo EU BA 0,21 PodnHosp. EU BA 0,21 Pedag UKF 0,25 Ekonom UMB 0,25 NárHosp. EU BA 0,27 EkonomManSPU 0,28 TV UK 0,31 Obchod EU BA 0,34 MedzVzťah EU BA 0,35 Pedag UK 0,36 Pedas ŽU 0,39 Manag UK 0,44 ZdravSoc TVU 1,61 0 0,2 0,4 0,6 0,8 1 1,2 1,4 1,6 1,8 59
  • 61.
    VV6 The number of PhD students in full time study in proportion to the total number of students studying full time in 2004. Typical foreign research universities have a relatively high number of PhD students from abroad in proportion to the overall number of full time students. This ratio may in fact provide an image of a certain scientific level in the relevant faculty, which is the parameter monitored by indicator VV6. Table 14: Proportion of PhD students from all students (in full time study) Faculty PhD students (full time) / students (full time) Faculty of Theology, TVU HUM 0,12 Faculty of Mathematics, Physics and Informatics, UK NAT 0,08 Faculty of Chemical and Food Technology, STUBA TECH 0,11 University of Veterinary Medicine AGRO 0,05 Faculty of Health Care and Social Work, TVU SOC 0,10 Jessenius Faculty of Medicine, UK MED 0,04 ARRA's analysis shows that PhD students make up more than 10% of the total number of students in only three faculties: TVU Faculty of Theology 12.6 %, STU Faculty of Chemical and Food Technology 11 % an TVU Faculty of Healthcare and Social Work 10 %. 19 faculties out of 99 had a value of zero for this parameter. 60
  • 62.
    The average numberof full time PhD students in proportion to the number of all full time students VV6 Faculty group – MED Počet doktorandov denn.štúdia/počet študentov denného štúdia 5,0% 4,5% 4,3% 4,0% 3,5% 3,3% 3,0% 3,0% 2,5% 2,3% 2,0% 1,5% 1,0% 0,5% 0,0% Farm UK Lek UK Lek UPJŠ JessenLek UK Faculty group – NAT 9% 8,5% 8% 6,9% 7% 6% 5% 4,6% 4% 3,0% 3% 2,5% 2,3% 2% 1,3% 1% 0,7% 0,0% 0% FMFI UK Ekolenv TUZ Prír UK Prír UPJŠ Prír UCM Prír UMB Prír UKF Infor.aInf.Tech. Prír ŽU STUBA 61
  • 63.
    0% 1% 2% 3% 4% 5% 6% VeterLek. UVL 5,1% Drev TUZV 4,9% Faculty group – AGRO Les TUZV 3,9% Záhrad SPU 3,0% Agro SPU 2,8% BiotPotr. SPU 2,3% 62
  • 64.
    Faculty group –TECH MechTron TUAD 0,0% VýrTech TUKE 1,3% ŠpecInž ŽU 1,7% Stroj TUKE 2,0% Stav TUKE 2,1% MatTechn STUBA 2,2% Ban TUKE 2,4% Mech SPU 2,5% Elektr ŽU 2,7% ŠpecTechn TUAD 2,9% Elektr TUKE 2,9% Stav ŽU 2,9% Stav STUBA 3,4% Stroj STUBA 3,4% PriemTech TUAD 3,5% EnvirTech. TUZV 3,5% Archit STUBA 3,6% Elektr STUBA 3,7% Stroj ŽU 3,9% Hutn TUKE 5,1% 11,0% ChemTechn. STUBA 0% 2% 4% 6% 8% 10% 12% 63
  • 65.
    Faculty group –HUM Fil UCM 0,0% MuzUm AU 0,0% VýtvarUm AU 0,0% Greckokat.PU 0,0% Filolo UMB 0,0% DramUm AU 0,0% Umení TUKE 0,0% HumPrír PU 0,9% Fil KU 1,1% Evanj UK 1,4% Hum UMB 1,6% Fil UKF 1,6% Fil PU 1,9% Fil UK 2,5% Teol KU 2,8% RímsKat UK 3,2% Fil TVU 3,7% Pravosl.PU 4,3% VŠVU BL 5,2% HudTan VŠMU 5,6% Divadelná VŠMU 6,9% FilmTel VŠMU 9,3% Teol.TVU 12,6% 0% 2% 4% 6% 8% 10% 12% 14% 64
  • 66.
    Faculty group –SOC Zdravotnícka PU 0,0% Sredoeur.Št.UKF 0,0% Manažment PU 0,0% VerSpr UPJŠ 0,0% SocEkon UK 0,0% SocEkon TUAD 0,0% Práv UPJŠ 0,0% MasMed UCM 0,0% Práv UMB 0,0% Finan UMB 0,0% Soc UKF 0,4% HospInfo EU BA 0,6% PodnMan EU BA 0,8% NárHosp. EU BA 0,8% Pedag KU 1,0% Obchod EU BA 1,1% Práv UK 1,2% PodnHosp. EU BA 1,2% Pedag PU 1,4% Pedag UMB 1,5% Ekonom TUKE 1,6% Ekonom UMB 1,7% Pedag TVU 1,7% Pedag UK 1,7% Pedag UKF 1,7% Polit UMB 1,8% Pedas ŽU 1,9% Riadenia ŽU 1,9% Manag UK 2,0% Práv TVU 2,3% Eur.Št. SPU 2,4% MedzVzťah EU BA 2,9% EkonomManSPU 3,1% Športu PU 3,4% TV UK 3,9% ZdravSoc TVU 10,0% 0% 2% 4% 6% 8% 10% 12% 65
  • 67.
    "Grant Success" Group VV7 Combined grant funding from the VEGA and KEGA agencies per one creative worker The VEGA (Scientific Grant Agency) and KEGA (Cultural and Educational Grant Agency) agencies have a long tradition in SR and are open to all faculties and universities (and only to them) although the typical grant level varies from group to group. Within a given group, however, faculties have approximately equal opportunities to win grants. For this reason, ARRA combined VEGA and KEGA funding into one indicator. Some examples are given in Table 15. Table 15: Combined grant funding from the VEGA and KEGA agencies per creative worker in 2004 in thousand SKK Faculty Funding per creative worker (in thousand SKK) Faculty of Arts, TVU HUM 17,1 Faculty of Natural Sciences, UK NAT 67,2 Faculty of Chemical and Food Technology, STUBA TECH 70,0 Faculty of Forestry, TUZV AGRO 114,2 Faculty of Management and Informatics, ŽU SOC 14,6 Faculty of Pharmacy, UK MED 31,0 Grant funding from the VEGA and KEGA agencies per one creative worker (in thousand SKK) VV7 Faculty group – MED Prostriedky v tis.Sk z grantov VEGA+KEGA / Počet tvorivých hláv 35 31,0 30 25 22,2 20,9 20 16,0 15 10 5 0 Farm UK Lek UK JessenLek UK Lek UPJŠ 66
  • 68.
    0 10 20 30 40 50 60 70 80 0 20 40 60 80 100 120 Prír UK 67,2 Les TUZV Prír UPJŠ 59,3 114,2 Faculty group – AGRO Infor.aInf.Tech. Faculty group – NAT Agro SPU 52,3 STUBA 73,9 FMFI UK 35,9 VeterLek. UVL 69,8 EKOLENV TUZ 34,8 Prír UKF 28,4 Záhrad SPU 65,2 Prír UMB 10,0 Drev TUZV Prír UCM 54,0 9,5 Prír ŽU 2,0 BiotPotr. SPU 8,9 67
  • 69.
    Faculty group –TECH Elektr ŽU 6,8 ŠpecTechn TUAD 8,7 ŠpecInž ŽU 14,3 MatTechn STUBA 19,5 Stav ŽU 20,9 Archit STUBA 24,1 Ban TUKE 25,5 Mech SPU 29,9 Stroj ŽU 30,4 PriemTech TUAD 33,5 Elektr TUKE 34,0 Stav STUBA 35,9 VýrTech TUKE 36,4 MechTron TUAD 36,7 EnvirTech. TUZV 37,3 Stroj STUBA 38,3 Stav TUKE 42,0 Hutn TUKE 44,7 Stroj TUKE 51,1 Elektr STUBA 52,4 ChemTechn. STUBA 70,0 0 10 20 30 40 50 60 70 80 68
  • 70.
    Faculty group –HUM Teol.TVU 0,0 DramUm AU 0,0 Umení TUKE 0,0 Teol KU 0,0 Filolo UMB 1,1 Greckokat.PU 1,2 HudTan VŠMU 1,2 Evanj UK 1,4 FilmTel VŠMU 2,7 Pravosl.PU 3,0 Fil UCM 3,2 RímsKat UK 4,5 Fil KU 4,6 MuzUm AU 4,9 VýtvarUm AU 5,8 Hum UMB 5,9 Divadelná VŠMU 8,5 Fil UKF 9,0 Fil UK 12,1 HumPrír PU 12,6 Fil PU 15,4 VŠVU BL 15,5 17,1 Fil TVU 0 2 4 6 8 10 12 14 16 18 69
  • 71.
    Faculty group –SOC Zdravotnícka PU 0,0 Eur.Št. SPU 0,0 Sredoeur.Št.UKF 0,0 Manažment PU 0,0 Polit UMB 0,0 Pedag UMB 0,7 MasMed UCM 0,8 Finan UMB 0,9 ZdravSoc TVU 1,3 Práv UMB 1,7 Manag UK 1,7 MedzVzťah EU BA 2,1 Soc UKF 2,3 Práv UK 2,4 PodnHosp. EU BA 3,4 Práv UPJŠ 3,7 HospInfo EU BA 4,1 SocEkon TUAD 4,3 Pedag KU 6,4 Ekonom UMB 7,1 Pedas ŽU 7,5 Práv TVU 7,9 Obchod EU BA 8,2 PodnMan EU BA 8,4 Ekonom TUKE 8,9 VerSpr UPJŠ 9,0 Pedag UKF 9,1 Pedag TVU 9,7 NárHosp. EU BA 10,0 EkonomManSPU 11,0 Pedag PU 11,9 SocEkon UK 12,1 TV UK 12,1 Športu PU 13,7 Pedag UK 13,9 Riadenia ŽU 14,6 0 2 4 6 8 10 12 14 16 70
  • 72.
    VV8 Funding from AR (applied research), ISTC (international scientific and technical cooperation) and ASST (Agency for the Support of Science and Technology) grants per one creative worker. In 2004, it was mainly faculties oriented towards technology, natural history and medicine that drew funding from AR and ASST. Within individual groups of faculties, the faculties had approximately equal chances of obtaining funding from the stated sources, as in the previous examples. Some examples of the most successful faculties in the relevant groups are given in Table 16. Table 16: Funding from AR + ISTC + ASST funding per creative worker in 2004 in thousand SKK Faculty Funding per creative worker (in thousand SKK) Faculty of Performing Arts, AU HUM 3,2 Faculty of Mathematics, Physics and Informatics, UK NAT 33,5 Faculty of Environm. and Manuf. Technology, TUZV TECH 84,7 Faculty of Agrobiology and Food Resources, SPU AGRO 48,8 Faculty of Management and Informatics, ŽU SOC 13,6 Jessenius Faculty of Medicine, UK MED 20,0 Funding from AR (applied research), ISTC (international scientific and technical cooperation) and ASST (Agency for the Support of Science and Technology) grants (in thousand SKK) per one creative worker VV8 Faculty group – MED 25 20,0 20 15 10 8,8 5 1,0 0,1 0 Farm UK Lek UK Lek UPJŠ JessenLek UK 71
  • 73.
    0 10 20 30 40 50 60 0 5 10 15 20 25 30 35 40 FMFI UK 33,5 Agro SPU 48,8 Prír UK 23,1 VeterLek. Faculty group – AGRO UVL 26,8 Prír UPJŠ 15,3 Faculty group – NAT Prír ŽU 3,2 Drev TUZV 13,7 Prír UKF 1,4 Les TUZV 9,9 EKOLENV 0,0 TUZ Prír UCM 0,0 BiotPotr. SPU 5,9 Prír UMB 0,0 Záhrad SPU 1,7 Infor.STUBA 0,0 72
  • 74.
    Faculty group –TECH Stav ŽU 0,0 ŠpecTechn TUAD 0,0 Stav TUKE 0,9 ŠpecInž ŽU 4,9 Archit STUBA 7,0 Mech SPU 8,1 Hutn TUKE 8,6 Stroj TUKE 8,7 MechTron TUAD 10,7 MatTechn STUBA 11,6 Elektr TUKE 12,7 Stroj STUBA 13,4 Stav STUBA 13,8 VýrTech TUKE 16,9 Elektr ŽU 25,8 ChemTechn. STUBA 28,6 Ban TUKE 28,9 Elektr STUBA 46,4 Stroj ŽU 49,1 PriemTech TUAD 52,1 EnvirTech. TUZV 84,7 0 10 20 30 40 50 60 70 80 90 73
  • 75.
    Faculty group –HUM Teol TVU 0,0 Fil TVU 0,0 VŠVU BL 0,0 Fil PU 0,0 HumPrír PU 0,0 Fil UKF 0,0 VýtvarUm AU 0,0 Divadelna VŠMU 0,0 Fil KU 0,0 FilmTel VŠMU 0,0 Pravosl.PU 0,0 Evanj UK 0,0 Filolo UMB 0,0 HudTan VŠMU 0,0 RímsKat UK 0,0 Greckokat.PU 0,0 DramUm AU 0,0 Umení TUKE 0,0 Teol KU 0,0 Fil UK 0,6 Fil UCM 0,8 Hum UMB 0,9 MuzUm AU 3,2 0 0,5 1 1,5 2 2,5 3 3,5 74
  • 76.
    Faculty group –SOC Športu PU 0,0 Zdravotnícka PU 0,0 StredEur UKF 0,0 Manag PU 0,0 TV UK 0,0 Pedag UK 0,0 SocEkon UK 0,0 EkonomManSPU 0,0 Pedag PU 0,0 NárHosp. EU BA 0,0 Pedag TVU 0,0 Práv TVU 0,0 Pedag UKF 0,0 Obchod EU BA 0,0 PodnMan EU BA 0,0 Ekonom UMB 0,0 Pedag KU 0,0 SocEkon TUAD 0,0 HospInfo EU BA 0,0 Práv UPJŠ 0,0 PodnHosp. EU BA 0,0 Soc UKF 0,0 Práv UK 0,0 Práv UMB 0,0 MedzVzťah EU BA 0,0 Manag UK 0,0 MasMed UCM 0,0 Finan UMB 0,0 Pedag UMB 0,0 Polit UMB 0,0 VerSpr UPJŠ 0,4 Pedas ŽU 0,8 ZdravSoc TVU 2,0 Eur.št.SPU 4,5 Ekonom TUKE 4,8 Riadenia ŽU 13,6 0 2 4 6 8 10 12 14 16 75
  • 77.
    VV9 Overall grantfunding per one creative worker. This indicator is based on the total of all grant funding from public sources. To some extent this reproduces the preceding criteria (double counting), however ARRA believes that VV9 has its own informational value as a measurement of faculties' ability to gain funding through their own efforts without regard to the type of donor. Table 17: Overall grant funding per one creative worker in 2004 in thousand SKK Faculty Overall grant funding/creative worker (in thousand SKK) Faculty of Arts, TVU HUM 17,1 Faculty of Natural Sciences, UK NAT 93,5 Faculty of Environm. and Manuf. Technology, TUZV TECH 122,0 Faculty of Forestry, TUZV AGRO 124,1 Faculty of Management and Informatics, ŽU SOC 28,2 Jessenius Faculty of Medicine, UK MED 42,2 In the HUM group of faculties, the TVU Faculty of Philosophy got the greatest amount of funding per CW, amounting in total to SKK 17 100. On the other hand, 4 faculties out of 23 did not gain any funding in this "competition". The results are somewhat better in the SOC group. In the ŽU Faculty of Management and Informatics, one CW was able to gain on average SKK 28 200. Once again 4 faculties (from 36) did not gain any funding for their research. In the NAT group, the most successful faculty was the UK Faculty of Natural Sciences with an average of SKK 93 500 per CW, while at the ŽU Faculty of Natural Sciences 1 CW earned on average SKK 5 540. In the TECH group, the best performer was the TUZV Faculty of Environmental and Manufacturing Technology with SKK 122 000 per CW, while the TUAD Faculty of Special Technology came at the bottom of the table with SKK 8 730. In the AGRO group, one CW of the TUZV Faculty of Forestry gained SKK 124 100, which is the highest level of funding of all gained by one CW on average. The SPU Faculty of Biotechnological and Food Sciences came last with SKK 14 800 per CW. In the MED group, the most successful faculty was the UK Jessenius Faculty of Medicine, where on average each CW had SKK 42 200, while one CW of the UK Faculty of Medicine had on average SKK 22 300 from the stated funding. It is surprising that 8 faculties out of 99 were unable to gain a single crown of public funding for their research or development or artistic projects. There is no reliable 76
  • 78.
    data available onEU or other funding, especially that which the may have been gained individually, and therefore it could not be included in the assessment. Overall grant funding (in thousand SKK) per one creative worker in 2004 VV9 Faculty group – MED 45 42,2 40 35 32,0 30 24,9 25 22,3 20 15 10 5 0 Farm UK Lek UK JessenLek UK Lek UPJŠ Faculty group – NAT 100 93,5 90 80 74,5 69,4 70 60 52,3 50 40 34,8 29,8 30 20 10,0 9,5 10 5,2 0 FMFI UK EKOLENV TUZ Infor.aInf.Tech. Prír UK Prír UMB Prír UCM Prír UKF Prír ŽU Prír UPJŠ STUBA 77
  • 79.
    Faculty group –AGRO 140 124,1 118,2 120 100 96,6 80 67,7 66,9 60 40 20 14,8 0 BiotPotr. SPU Drev TUZV Les TUZV Záhrad SPU Agro SPU VeterLek. UVL 78
  • 80.
    Faculty group –TECH ŠpecTechn TUAD 8,7 ŠpecInž ŽU 19,2 Stav ŽU 20,9 MatTechn STUBA 31,1 Archit STUBA 31,1 Elektr ŽU 32,6 Mech SPU 38,0 Stav TUKE 42,9 Elektr TUKE 45,8 MechTron TUAD 47,5 Stav STUBA 49,8 Stroj STUBA 51,7 VýrTech TUKE 53,3 Hutn TUKE 53,3 Ban TUKE 54,4 Stroj TUKE 59,7 Stroj ŽU 79,5 PriemTech TUAD 85,6 ChemTechn. STUBA 98,6 Elektr STUBA 101,5 EnvirTech. TUZV 122,0 0 20 40 60 80 100 120 140 79
  • 81.
    Faculty group –HUM Teol.TVU 0,0 DramUm AU 0,0 Umení TUKE 0,0 Teol KU 0,0 Filolo UMB 1,1 Greckokat.PU 1,2 HudTan VŠMU 1,2 Evanj UK 1,4 FilmTel VŠMU 2,7 Pravosl.PU 3,0 Fil UCM 3,9 RímsKat UK 4,5 Fil KU 4,6 VýtvarUm AU 5,8 Hum UMB 6,8 MuzUm AU 8,1 Divadelná VŠMU 8,5 Fil UKF 9,0 HumPrír PU 12,6 Fil UK 12,6 Fil PU 15,4 VŠVU BL 15,5 Fil TVU 17,1 0 2 4 6 8 10 12 14 16 18 80
  • 82.
    Faculty group –SOC Zdravotnícka PU 0,0 Sredoeur.Št.UKF 0,0 Manažment PU 0,0 Polit UMB 0,0 Pedag UMB 0,7 MasMed UCM 0,8 Finan UMB 0,9 Práv UMB 1,7 Manag UK 1,7 MedzVzťah EU BA 2,1 Soc UKF 2,3 Práv UK 2,4 ZdravSoc TVU 3,3 PodnHosp. EU BA 3,4 Práv UPJŠ 3,7 HospInfo EU BA 4,1 SocEkon TUAD 4,3 Eur.Št. SPU 4,4 Pedag KU 6,4 Ekonom UMB 7,1 Pedas ŽU 7,5 Práv TVU 7,9 Obchod EU BA 8,2 PodnMan EU BA 8,4 VerSpr UPJŠ 9,0 Pedag UKF 9,1 Pedag TVU 9,7 NárHosp. EU BA 10,0 EkonomManSPU 11,0 Pedag PU 11,9 SocEkon UK 12,1 TV UK 12,1 Ekonom TUKE 13,6 Športu PU 13,7 Pedag UK 13,9 Riadenia ŽU 28,2 0 5 10 15 20 25 30 81
  • 83.
    Study and education "Studentsand Teachers" Group SV1 Number of students divided by the number of teachers ARRA believes that it is better for students if there is a smaller number of students per teacher. This allows the teacher to offer a more individual approach to the student, which almost certainly helps to increase the quality of education and research activity in the university or faculty. For this reason a higher number of points was given for a lower number of students per teacher. (For this reason, the inverse value of students per teacher was used for ranking purposes). At the same time it is true to say that low numbers of students per teacher lead to problems in financing universities and faculties because a major part of funding is based on the number of students. ARRA, however, aims to look at universities through the eyes of students or prospective students for whom the quality that the school offers them is important. In discussion of the adequacy of these proportions the interests of students in higher education and the financing institutions are therefore in conflict. Table 18: Number of students per teacher Faculty Number of students per teacher Faculty of Performing Arts, AU HUM 3,0 Faculty of Mathematics, Physics and Informatics, UK NAT 6,4 Faculty of Chemical and Food Technology, STUBA TECH 7,0 University of Veterinary Medicine AGRO 6,8 Faculty of Sports, PU SOC 7,6 Faculty of Medicine, UK MED 6,2 Higher numbers of students per teacher are to be found in SOC and HUM faculties, which relates to the fact that these faculties have as a rule a higher number of part time students. The number of students per teacher reflects the level the tutor's individual approach to students. It is also possible to speak of the technical requirements of tuition (e.g. laboratories, studios, sports facilities, clinics, training of talents), or a lack of interest in the given faculty among applicants (and related over-employment of teachers in the faculty) or a lack of teachers. It is no surprise that the lowest 82
  • 84.
    ratios are tobe found in faculties oriented towards art, sport or medicine. Questions may however be asked in cases where the faculties with the same or similar orientation show significant differences. E.g. the VSMU Theatre Faculty 9 and the AU Faculty of Music 3; The UKF Faculty of Philosophy 24 and the UK Faculty of Philosophy 9; the PU Faculty of Greek Catholic Theology 27 and the UK Faculty of Roman Catholic Theology 5; The KU Faculty of Education 44 and the UK Faculty of Education 20; or the UK Faculty of Management 40 and the ŽU Faculty of Management and Informatics 14. A point worth noting is the role played in this indicator by part time students. Sometimes the number of part time students is greater than the number of full time students. For example, in the case of the TVU Faculty of Healthcare and Social Work the proportion (part time/full time) is greater than 4, which is by far the highest in the faculties of the Slovak universities. In 15 faculties out of 99 there are more part time than full time students. In addition, since 2002/2003 the Slovak "full time/part time" ratio has increased from 0.28 to 0.32. In the same years the number of part time students increased by 14 028, while the number of full time students increased by only 9 090. From this it is clear that education in Slovak universities is gradually becoming more of a mass phenomenon but mainly in the form of part time study. On the margin of this it should be emphasized that part time study in Slovakia is not identical in character with distance learning, whose popularity is increasing in other countries. For comparison with other countries, we can cite the example of Oregon University, which is comparable to Comenius University. On its web site the Oregon University states its teacher-student ratio as 1:16. Comenius University had 2 180 teachers and 23 007 students (excluding PhD students), which corresponds to approximately 11 students per teacher. At universities in the USA, high numbers of students per teachers are made possible mainly by the low number of hours of direct contact between teacher and students (for students it is 15 – 18 hours per week). 83
  • 85.
    Number of students(full- and part-time) divided by the number of teachers in 2004 SV1 Faculty group – MED 10 9 8,8 8,4 8,3 8 7 6,2 6 5 4 3 2 1 0 Farm UK Lek UK JessenLek UK Lek UPJŠ Faculty group – NAT 30 27,3 26,6 25 20 15,7 15 14,1 13,3 11,5 10,1 10 9,0 6,4 5 0 FMFI UK Ekolenv TUZ Prír UK Prír UCM Prír UPJŠ Prír UMB Infor.aInf.Tech. Prír UKF Prír ŽU STUBA 84
  • 86.
    0 5 10 15 20 25 Záhrad SPU 21,7 Agro SPU 17,2 Drev TUZV 17,1 Faculty group – AGRO BiotPotr. SPU 17,0 Les TUZV 14,8 VeterLek. UVL 6,8 85
  • 87.
    Faculty group –TECH ChemTechn. STUBA 7,0 Archit STUBA 11,7 Stroj STUBA 12,1 Stroj ŽU 12,2 Stav TUKE 12,3 Elektr STUBA 13,0 EnvirTech. TUZV 13,1 Stav STUBA 13,1 Hutn TUKE 13,3 Elektr ŽU 13,8 Elektr TUKE 14,4 Stav ŽU 15,7 ŠpecTechn TUAD 16,9 MatTechn STUBA 18,1 VýrTech TUKE 18,9 Mech SPU 19,0 PriemTech TUAD 20,2 Stroj TUKE 21,1 ŠpecInž ŽU 28,9 MechTron TUAD 29,1 Ban TUKE 29,2 0 5 10 15 20 25 30 35 86
  • 88.
    Faculty group –HUM MuzUm AU 3,0 FilmTel VŠMU 4,9 RímsKat UK 5,0 VýtvarUm AU 5,3 HudTan VŠMU 5,5 DramUm AU 5,8 VŠVU BL 6,0 Umení TUKE 6,7 Evanj UK 6,8 Teol.TVU 7,8 Divadelná VŠMU 8,9 Fil UK 8,9 Filolo UMB 9,6 Fil TVU 11,4 Fil UCM 15,7 Fil PU 17,2 Fil KU 17,3 Hum UMB 18,6 Teol KU 19,8 HumPrír PU 20,0 Fil UKF 24,0 Greckokat.PU 26,8 Pravosl.PU 29,8 0 5 10 15 20 25 30 35 87
  • 89.
    Faculty group –SOC Športu PU 7,6 TV UK 10,6 Zdravotnícka PU 12,7 Riadenia ŽU 14,4 SocEkon UK 15,6 Finan UMB 16,6 Polit UMB 16,9 Práv TVU 17,7 MedzVzťah EU BA 18,6 Pedag UK 20,3 Ekonom TUKE 20,6 Pedag UKF 21,1 Sredoeur.Št.UKF 21,2 Práv UPJŠ 22,6 NárHosp. EU BA 22,9 Práv UMB 23,0 PodnHosp. EU BA 23,0 Ekonom UMB 24,2 PodnMan EU BA 24,5 Pedas ŽU 24,5 HospInfo EU BA 24,6 Pedag PU 25,5 EkonomManSPU 26,3 VerSpr UPJŠ 27,8 Pedag TVU 28,0 Eur.Št. SPU 29,2 Obchod EU BA 30,5 Pedag UMB 32,5 MasMed UCM 33,4 Práv UK 35,3 ZdravSoc TVU 35,8 Soc UKF 36,4 Manažment PU 38,4 Manag UK 40,4 SocEkon TUAD 42,2 Pedag KU 43,8 0 10 20 30 40 50 88
  • 90.
    SV2 Number of students divided by the number of professors and associate professors Values for selected faculties. Table 19: Number of professors and associate professors per 100 full and part time students Faculty Number of students/(professors + ass. prof.) Faculty of Performing Arts, AU HUM 7,1 Faculty of Mathematics, Physics and Informatics, UK NAT 16,1 Faculty of Chemical and Food Technology, STUBA TECH 12,1 University of Veterinary Medicine AGRO 17,5 Faculty of Sports, PU SOC 30,6 Faculty of Medicine, UK MED 19,7 ARRA's analysis shows that the student-teacher ratio is significantly higher in faculties with a higher number of part time students. The ratio of students to professors and associate professors (i.e. the inverse value of the parameter stated in Table 19) is important for the academic quality of subjects but also for the likelihood of individual contact between students and the faculty members with the highest qualifications. Once again it is possible to observe a similar trend to that observed in the case of the SV1 indicator. Faculties oriented towards art and medicine generally have a lower ratio in the area of 26 students to one professor or associate professor (MED) and around 14 in artistic faculties (the AU Faculty of Music has a value of 7, which is the lowest for any of the studied faculties in Slovak universities). Once again there are relatively large differences between related faculties. While the UKF Faculty of Philosophy has 96 in this parameter, it is nearly 4 times lower at the TVU Faculty of Philosophy (25). Likewise in the case of the TUAD Faculty of Socio-Economic Relations (172; the overall highest ratio of students to professors and associate professors) and the UK Faculty of Social and Economic Sciences (37), the ratio is almost 5 times higher on TUAD's side. In the case of faculties oriented towards the natural sciences, the highest number of students per professor or associate professor is the UMB Faculty of Natural Sciences (126) while the similar UPJŠ Faculty of Natural Sciences has 23 in this parameter. Again it is important to notice the influence of part time students on this criterion. It is interesting that in the case of the UK Faculty of Mathematics, 89
  • 91.
    Physics and Informatics,the value of this parameter is 16, which is on the level of arts-oriented faculties. An even lower ratio was calculated for the STU Faculty of Chemical and Food Technology – 12. Both of these values may relate not only to the technical demands of tuition but also the low level of interest from prospective students meaning that there is over-employment of teachers in these faculties. Among technology-oriented faculties, the highest value was in the TUAD Faculty of Mechatronics – 101. There is also relatively large difference in the AGRO category. While the SPU Faculty of Horticulture and Landscape Engineering has 77 students per professor or associate professor, the University of Veterinary Medicine has only 18, which is close to that of the medicine-oriented faculties (e.g. UK Faculty of Medicine 20, whereas the UPJŠ Faculty of Medicine has 34 for this parameter). Number of students (full- and part-time) divided by the number of professors and associate professors in 2004 SV2 Faculty group – MED 40 35 33,5 30 26,2 25,0 25 19,7 20 15 10 5 0 Farm UK JessenLek UK Lek UK Lek UPJŠ 90
  • 92.
    0 10 20 30 40 50 60 70 80 90 0 20 40 60 80 100 120 140 Záhrad SPU 76,5 Prír UMB 126,0 Infor.aInf.Tech. STUBA 63,5 BiotPotr. SPU 57,8 Faculty group – AGRO Prír UKF 48,6 Faculty group – NAT Agro SPU Prír UCM 41,2 40,1 Ekolenv TUZ 34,1 Drev TUZV 37,9 Prír ŽU 34,1 Prír UK 25,5 Les TUZV 28,3 Prír UPJŠ 23,1 VeterLek. UVL FMFI UK 16,1 17,5 91
  • 93.
    Faculty group –TECH ChemTechn. STUBA 12,1 Elektr STUBA 26,0 Hutn TUKE 27,4 EnvirTech. TUZV 27,6 Stroj STUBA 28,5 Archit STUBA 30,3 Stav STUBA 31,6 Stroj ŽU 31,7 Elektr ŽU 33,1 Elektr TUKE 33,9 Stav TUKE 34,8 Mech SPU 39,7 ŠpecTechn TUAD 39,7 Stav ŽU 42,1 PriemTech TUAD 52,7 MatTechn STUBA 58,3 Stroj TUKE 58,5 VýrTech TUKE 67,9 ŠpecInž ŽU 74,0 Ban TUKE 86,9 MechTron TUAD 101,4 0 20 40 60 80 100 120 92
  • 94.
    Faculty group –HUM MuzUm AU 7,1 HudTan VŠMU 12,0 DramUm AU 12,1 FilmTel VŠMU 13,4 VýtvarUm AU 13,9 VŠVU BL 14,1 Teol.TVU 14,4 Divadelná VŠMU 15,4 Evanj UK 20,4 Fil TVU 24,8 RímsKat UK 25,4 Fil UK 26,5 Umení TUKE 27,2 Fil UCM 44,0 Teol KU 44,3 Fil PU 53,2 HumPrír PU 58,0 Fil KU 58,5 Filolo UMB 63,9 Hum UMB 70,2 Pravosl.PU 94,5 Fil UKF 96,0 Greckokat.PU 98,3 0 20 40 60 80 100 120 93
  • 95.
    Faculty group –SOC Športu PU 30,6 TV UK 33,9 SocEkon UK 37,1 Soc UKF 46,9 Práv TVU 56,5 Práv UPJŠ 64,1 NárHosp. EU BA 66,3 MedzVzťah EU BA 67,6 PodnMan EU BA 67,9 Pedag TVU 69,2 EkonomManSPU 70,5 Riadenia ŽU 72,1 PodnHosp. EU BA 74,2 Polit UMB 77,0 Práv UMB 77,3 Pedag UK 78,0 Pedas ŽU 79,8 Ekonom TUKE 81,9 Obchod EU BA 84,0 ZdravSoc TVU 88,6 Sredoeur.Št.UKF 90,4 Pedag UMB 93,6 VerSpr UPJŠ 93,8 Pedag UKF 95,4 Eur.Št. SPU 98,1 Práv UK 99,8 HospInfo EU BA 100,2 Ekonom UMB 116,1 Finan UMB 130,2 Pedag KU 132,4 Manag UK 135,8 Pedag PU 144,7 Zdravotnícka PU 148,8 Manažment PU 153,6 MasMed UCM 161,0 SocEkon TUAD 172,1 0 20 40 60 80 100 120 140 160 180 200 94
  • 96.
    SV3 The ratio of teachers with a PhD to the total number of teachers. As an illustration we give the values of this ratio for a number of faculties. Table 20: The ratio of teachers with PhD to the total number of teachers. Faculty The ratio of teachers with PhD to the total number of teachers Orthodox Theological Faculty, PU HUM 79% Faculty of Natural Sciences, UPJŠ NAT 81% Faculty of Chemical and Food Technology, STUBA TECH 85% Faculty of Agrobiology and Food Resources, SPU AGRO 91% Faculty of Health Care and Social Work, TVU SOC 86% Faculty of Medicine, UK MED 61% The values for this ratio vary from faculty to faculty, but correlation with success in the area of publications and citations is relatively low. A more detailed study of the data shows that even in the longer established faculties the proportion of teachers without a PhD is quite high. We assume that all active professors and associate professors operating in Slovak universities have gained the academic degree of PhD (or its equivalent CSc, Dr, ArtD, ThDr). For other teachers the PhD degree is a sign of a certain scientific qualification and therefore also a certain level of quality. We can conclude that the higher the proportion of teachers having the academic degree of PhD (or its equivalent) in the overall number of teachers, the higher the potential level of quality in the research and educational activity of the faculty. The differences are highly pronounced in the faculties oriented towards the humanities. While, for example, 79% of all teachers at the PU Faculty of Orthodox Theology have a PhD degree, only every fourth teacher at the UMB Faculty of Philology has such a degree. The same situation exists in faculties oriented towards the social sciences, where the differences are even greater. 86% of the teaching staff at the TVU Faculty of Healthcare and Social Work has a PhD degree while at the similarly oriented PU Faculty of Healthcare only every fifth teacher has this degree (19%; the lowest value of all among the faculties of Slovak universities). Not even the faculties oriented towards the natural sciences escape this trend to a large extent. While the UPJŠ Faculty of Natural Sciences has this ratio at 0.81, the ŽU Faculty of Natural Sciences has 0.35. The technology-oriented faculties are somewhat better ranging from 85 % in the STU Faculty of Chemical and Food Technology to 52 % in the TUAD Faculty of Mechatronics. In the faculties of medicine and the faculty of pharmacy, the distribution is relatively narrow: 61% for the UK Faculty of Medicine and 54% for the 95
  • 97.
    UK Jessenius Facultyof Medicine. The faculties in the AGRO group where the proportion of teachers with PhD degrees was as high as 91% (the highest value of all for faculties of Slovak universities) in the SPU Faculty of Agrobiology and Food Resources. The last placed faculty in this group was the SPU Faculty of Horticulture and Landscape Engineering with 71%. It is worrying that amongst all teachers in Slovak universities only 40% have a PhD degree or its equivalent, which means that more than half of all teachers in Slovak higher education have not completed the third level of higher education. A possible objection is that this group includes young faculty employees under 35 who are still studying; they do not however by far amount to 60% of all university teachers. The high proportion of teachers without a PhD teaching in the faculties of Slovak universities is alarming. Ratio of teachers with a PhD to the total number of teachers in 2004 SV3 Faculty group – MED 70% 61% 60% 60% 58% 54% 50% 40% 30% 20% 10% 0% Farm UK Lek UK JessenLek UK Lek UPJŠ 96
  • 98.
    Faculty group –NAT 90% 81% 80% 76% 70% 70% 64% 63% 60% 58% 58% 53% 50% 40% 35% 30% 20% 10% 0% FMFI UK Ekolenv TUZ Prír UK Prír UPJŠ Prír UCM Prír UMB Infor.aInf.Tech. Prír UKF Prír ŽU STUBA Faculty group – AGRO 100% 91% 90% 81% 80% 76% 73% 72% 71% 70% 60% 50% 40% 30% 20% 10% 0% BiotPotr. SPU Drev TUZV Les TUZV Záhrad SPU Agro SPU VeterLek. UVL 97
  • 99.
    Faculty group –TECH MechTron TUAD 52% ŠpecTechn TUAD 54% MatTechn STUBA 55% PriemTech TUAD 58% Ban TUKE 61% VýrTech TUKE 61% Stroj TUKE 63% Elektr ŽU 64% Stav ŽU 64% ŠpecInž ŽU 68% Stav STUBA 69% Stav TUKE 69% Archit STUBA 70% Elektr TUKE 70% EnvirTech. TUZV 73% Mech SPU 73% Stroj ŽU 73% Hutn TUKE 74% Stroj STUBA 75% Elektr STUBA 78% ChemTechn. STUBA 85% 0% 10% 20% 30% 40% 50% 60% 70% 80% 90% 98
  • 100.
    Faculty group –HUM Filolo UMB 24% Umení TUKE 27% VýtvarUm AU 38% RímsKat UK 41% Fil KU 43% VŠVU BL 49% Fil UKF 51% Hum UMB 53% Fil UCM 54% DramUm AU 54% Divadelná VŠMU 58% MuzUm AU 60% Fil PU 61% Evanj UK 62% Greckokat.PU 64% FilmTel VŠMU 65% Fil TVU 69% HumPrír PU 69% Fil UK 69% HudTan VŠMU 70% Teol.TVU 71% Teol KU 76% Pravosl.PU 79% 0% 10% 20% 30% 40% 50% 60% 70% 80% 90% 99
  • 101.
    Faculty group –SOC Zdravotnícka PU 19% MasMed UCM 39% Polit UMB 39% Pedag PU 43% Pedag UKF 44% Riadenia ŽU 44% Ekonom UMB 45% HospInfo EU BA 45% Finan UMB 46% VerSpr UPJŠ 48% Sredoeur.Št.UKF 49% Práv TVU 50% PodnMan EU BA 52% SocEkon TUAD 52% Manažment PU 54% Pedag KU 54% Manag UK 55% Pedag UK 56% MedzVzťah EU BA 57% Športu PU 57% Ekonom TUKE 58% NárHosp. EU BA 58% Práv UMB 59% Pedag TVU 59% Obchod EU BA 63% Práv UK 63% Pedag UMB 63% Pedas ŽU 63% PodnHosp. EU BA 63% EkonomManSPU 65% Eur.Št. SPU 68% SocEkon UK 68% Soc UKF 68% TV UK 69% Práv UPJŠ 71% ZdravSoc TVU 86% 0% 20% 40% 60% 80% 100% 100
  • 102.
    SV4 The number of professors and associate professors divided by the number of all teachers This ratio varies between 10% and 60% and for most faculties the value is in the middle of this range. Table 21: Ratio of the number of teachers with the degree of professor or associate professor to the total number of teachers in 2004 Faculty Ratio of the number of professors or ass. prof. to the total number of teachers Faculty of Theatre Arts, VŠMU HUM 58% Faculty of Natural Sciences, UPJŠ NAT 50% Faculty of Chemical and Food Technology, STUBA TECH 57% Faculty of Forestry, TUZV AGRO 52% Faculty of Social and Economic Sciences, UK SOC 42% Faculty of Pharmacy, UK MED 33% In universities, professors and associate professors are considered to be the teachers with the highest qualification. This means that the more such teachers a faculty has, the greater should be the quality of its educational and research activities. A higher number of professors and associate professors also means a potentially higher number of accredited study programs, a potentially higher number of grants etc. The results are not dominated by any of the faculty groups but there are also relatively large differences within all the groups. It is worrying that out of 99 faculties assessed, the proportion of associate professors and professors in the total teaching staff exceeded 50% in only three cases (the VSMU Theatre Faculty – 58%, the STU Faculty of Chemical and Food Technology – 57% and the TUZV Faculty of Forestry – 52%) There are very sharp differences in the faculties oriented towards the humanities: 58% the VSMU Theatre Faculty and 15% UMB Faculty of Philology. There is the same situation in the SOC faculty group: 42% UK Faculty of Socio- Economic Sciences and 9% PU Faculty of Healthcare (which is the lowest value for any faculty of a Slovak university). There are also differences among the faculties oriented towards the natural sciences: the UPJŠ Faculty of Natural Sciences has the highest proportion at 50%, with last place in this group going to the UMB Faculty of Natural Sciences at 22%, which is similar to the TECH group of faculties – 57% in the STU Faculty of Chemical and Food Technology and 28% in the TUKE Faculty of Manufacturing Technologies. The distribution in the AGRO group is almost identical: 52% in the TUZV Faculty of Forestry and 28% in the STU Faculty of Horticulture and 101
  • 103.
    Landscape Engineering. TheMED group of faculties has the smallest differences: 33% UK Faculty of Pharmacy and 26% UPJŠ Faculty of Medicine. The number of professors and associate professors divided by the number of all teachers in 2004 SV4 Faculty group – MED 35% 33% 32% 31% 30% 26% 25% 20% 15% 10% 5% 0% Farm UK JessenLek UK Lek UK Lek UPJŠ 102
  • 104.
    0% 10% 20% 30% 40% 50% 60% 0% 10% 20% 30% 40% 50% 60% Les TUZV Prír UPJŠ 52% 50% Infor.aInf.Tech. STUBA 42% Drev TUZV 45% Faculty group – NAT FMFI UK 40% Faculty group – AGRO Agro SPU 43% Prír UK 39% VeterLek. UVL Ekolenv TUZ 39% 39% Prír UCM 34% BiotPotr. SPU 29% Prír UKF 32% Záhrad SPU 28% Prír ŽU 26% Prír UMB 22% 103
  • 105.
    Faculty group –TECH VýrTech TUKE 28% MechTron TUAD 29% MatTechn STUBA 31% Ban TUKE 34% Stav TUKE 35% Stroj TUKE 36% Stav ŽU 37% PriemTech TUAD 38% Stroj ŽU 39% Archit STUBA 39% ŠpecInž ŽU 39% Stav STUBA 42% Elektr ŽU 42% Elektr TUKE 42% ŠpecTechn TUAD 43% Stroj STUBA 43% EnvirTech. TUZV 47% Mech SPU 48% Hutn TUKE 48% Elektr STUBA 50% ChemTechn. STUBA 57% 0% 10% 20% 30% 40% 50% 60% 70% 104
  • 106.
    Faculty group –HUM Filolo UMB 15% RímsKat UK 20% Umení TUKE 25% Fil UKF 25% Hum UMB 27% Greckokat.PU 27% Fil KU 30% Pravosl.PU 32% Fil PU 32% Evanj UK 33% Fil UK 34% HumPrír PU 34% Fil UCM 36% FilmTel VŠMU 37% VýtvarUm AU 38% MuzUm AU 42% VŠVU BL 43% Teol KU 45% HudTan VŠMU 46% Fil TVU 46% DramUm AU 48% Teol.TVU 54% Divadelná VŠMU 58% 0% 10% 20% 30% 40% 50% 60% 70% 105
  • 107.
    Faculty group –SOC Zdravotnícka PU 9% Finan UMB 13% Pedag PU 18% Riadenia ŽU 20% MasMed UCM 21% Ekonom UMB 21% Polit UMB 22% Pedag UKF 22% Sredoeur.Št.UKF 23% SocEkon TUAD 25% HospInfo EU BA 25% Športu PU 25% Manažment PU 25% Ekonom TUKE 25% Pedag UK 26% Soc UKF 26% MedzVzťah EU BA 28% VerSpr UPJŠ 30% Práv UMB 30% Manag UK 30% Eur.Št. SPU 30% Pedas ŽU 31% PodnHosp. EU BA 31% TV UK 31% Práv TVU 31% Pedag KU 33% NárHosp. EU BA 34% Pedag UMB 35% Práv UPJŠ 35% Práv UK 35% PodnMan EU BA 36% Obchod EU BA 36% EkonomManSPU 37% ZdravSoc TVU 40% Pedag TVU 41% SocEkon UK 42% 0% 5% 10% 15% 20% 25% 30% 35% 40% 45% 106
  • 108.
    SV5 Average age of professors The average age of professors (here referring to active professors) ranges from 51 to 68 years, and in most faculties the value is in the middle of this distribution. Table 22: The average age of teachers in the functional position of professor in 2004 Faculty Average age of teachers in the functional position of professor Orthodox Theological Faculty, PU HUM 51 Faculty of Mathematics, Physics and Informatics, UK NAT 46 Faculty of Mechanical Engineering, ŽU TECH 52 Faculty of Wood Sciences and Technology, TUZV AGRO 57 Faculty of Finances, UMB SOC 49 Jessenius Faculty of Medicine, UK MED 54 The criterion of the average age of professors holding a functional position (active professor) is a typical example of a criterion that can be seen from a number of points of view. A higher average age may represent a higher level of experience, a stronger academic foundation for programs and fields, proven traditional research, more conservative and possibly more mature view of matters. It can also be viewed negatively as indicating that professors are overage with low performance and low dynamism. A staff of professors with a lower average age may, on the other hand, be perceived as precisely the opposite, as dynamic, productive, enthusiastic and capable of rapid reactions to a changing situation, but at the same time also a group with experience that is little for the highest rank of the academic hierarchy. We believe that a good combination is a balance of both categories. It is however also necessary to bear in mind that under Act no. 131/2002 on Higher Education a university teacher may no longer be employed on an unlimited employment contract or, in general, act as the guarantor of a study program after reaching the age of sixty five. In the faculties oriented towards the humanities we can observe differences of up to 15 years. While the average age of the active professors at the PU Faculty of Orthodox Theology is only 51 years, at the AU Faculty of Dramatic Arts it is 65 years. There is a similar situation in faculties oriented towards the social sciences (the difference is 19 years). Professors at the UMB Faculty of Finance have an average age of 49 years, making it the second "youngest" faculty in Slovakia. On the other hand the PU Faculty of Healthcare, the TUAD Faculty of Socio-Economic Relations 107
  • 109.
    and the UKFFaculty of Social Sciences and Healthcare where the professors have an average age of 68 years are correspondingly among the "oldest" faculties. The "youngest" faculty is the UK Faculty of Mathematics, Physics and Informatics where the average age of active professors is 46 years. In this group (NAT) the "oldest" is the UCM Faculty of Natural Sciences (63). The difference in this group of faculties is 17 years. In the TECH faculty group the difference is 12 years between the ŽU Faculty of Mechanical Engineering (52) and the TUAD Faculty of Mechatronics (64). The smallest differences are in the AGRO group (a difference of 5): 57 years at the TUZV Faculty of Wood Sciences and 62 years at the SPU Faculty of Horticulture and Landscape Engineering. A similar situation applies in the case of the MED group of faculties (a difference of 6 years): 55 years in the UK Jessenius Faculty of Medicine and 61 years in the UK Faculty of Medicine. The average of active professors in Slovak universities is 58 years. The average age of active professors with the academic rank of DrSc., i.e. the people with the highest attainable scientific-academic qualification, is four years higher. The high age of professors and associate professors can also be said to be alarming. Average age of professors holding a functional position (active professor) in 2004 SV5 Faculty group – MED 65 61 60 59 56 55 55 50 45 40 Farm UK Lek UK Lek UPJŠ JessenLek UK 108
  • 110.
    40 45 50 55 60 65 40 45 50 55 60 65 Prír UCM 63 Záhrad SPU 62 Infor.aInf.Tech. 62 STUBA Faculty group – AGRO Ekolenv TUZ 61 Les TUZV 61 Faculty group – NAT Prír ŽU 59 BiotPotr. SPU 59 Prír UKF 57 Prír UPJŠ 56 Agro SPU 59 Prír UK 56 VeterLek. Prír UMB 53 58 UVL FMFI UK 46 Drev TUZV 57 109
  • 111.
    Faculty group –TECH Ban TUKE 52 Stroj ŽU 52 Stav TUKE 54 MatTechn STUBA 54 Elektr TUKE 55 Elektr ŽU 55 Stav ŽU 55 Stroj TUKE 56 ŠpecInž ŽU 56 ChemTechn. STUBA 57 Mech SPU 57 Archit STUBA 57 EnvirTech. TUZV 58 VýrTech TUKE 58 Hutn TUKE 59 Elektr STUBA 59 Stav STUBA 59 Stroj STUBA 59 ŠpecTechn TUAD 61 PriemTech TUAD 63 MechTron TUAD 64 40 45 50 55 60 65 70 110
  • 112.
    Faculty group –HUM Pravosl.PU 51 Fil PU 54 FilmTel VŠMU 54 Fil UK 56 HumPrír PU 57 Hum UMB 57 RímsKat UK 57 Greckokat.PU 57 Fil UCM 58 VŠVU BL 58 Umení TUKE 58 Teol KU 59 HudTan VŠMU 59 VýtvarUm AU 59 Evanj UK 61 Fil KU 61 Fil UKF 61 Fil TVU 62 Teol.TVU 62 MuzUm AU 62 Divadelná VŠMU 63 Filolo UMB 63 DramUm AU 65 40 45 50 55 60 65 70 111
  • 113.
    Faculty group –SOC Finan UMB 49 Manažment PU 52 Pedag PU 54 Práv UK 55 VerSpr UPJŠ 56 Riadenia ŽU 56 Obchod EU BA 57 Pedas ŽU 57 Ekonom UMB 57 SocEkon UK 57 MasMed UCM 57 ZdravSoc TVU 58 Pedag KU 58 Práv UPJŠ 58 PodnHosp. EU BA 58 TV UK 58 Pedag UKF 58 Športu PU 58 HospInfo EU BA 59 Práv UMB 59 Ekonom TUKE 60 Pedag TVU 60 Sredoeur.Št.UKF 60 EkonomManSPU 61 NárHosp. EU BA 62 Manag UK 62 Práv TVU 62 Pedag UMB 62 Eur.Št. SPU 63 MedzVzťah EU BA 64 Pedag UK 64 PodnMan EU BA 65 Polit UMB 66 Soc UKF 68 SocEkon TUAD 68 Zdravotnícka PU 68 40 45 50 55 60 65 70 112
  • 114.
    "Applications for study"Group SV6 Admissions proceedings: ratio of actual number of applications received to the planned number There are dramatic differences between faculties in the SOC and HUM groups, where there is high interest in study and between the faculties in the TECH and NAT groups, where interest is lower. In the SOC and HUM groups there are also increases in the high number of students in part time study. The situation is the same throughout Europe. A welcome fact is that interest in the TECH group increased somewhat in 2005. We shall address this question in more detail in a later ARRA analysis covering 2005. Table 20 shows a number of values by way of illustration. Table 23: The number of students applying for full time study compared to the planned number for the academic year 2004/2005 Faculty Students applying for full time study / planned number Faculty of Arts, TUKE HUM 6,3 Faculty of Natural Sciences, UPJŠ NAT 4,3 Faculty of Mining, Ecol., Process Cont. and Geot., TUKE TECH 5,0 Faculty of Horticulture and Landscape Engineering, SPU AGRO 3,5 Faculty of Law, TVU SOC 11,2 Jessenius Faculty of Medicine, UK MED 7,5 For the great majority of faculties the ratio of application for study received to the number of students the university planned to admit was greater than 1. This is probably a due to two main factors: (a) students apply to more than one faculty; (b) demand for study is still greater than supply. Interest in study and also the likelihood of admission to it can also be illustrated from the applicants point of view by a criterion based on the ration of the number of applications submitted to the number of offered (planned) places set by the faculty (university). Under current legislation an applicant may submit applications to all faculties of Slovak universities at the same time. Applicants for full time study submitted on average only 2.1 applications and for applicants for part time study it was 1.1. Slovak university faculties accepted 75% of applicants for full time study and 56% of applicants for part time study24. This information does not take into consideration, however, the number of applicants who went on to take part in entrance tests (where faculties organize them). 24 Report on the situation in Slovak higher education for 2004, SR Ministry of Education for SR National Council (October 2005). 113
  • 115.
    The greatest interestwas in faculties oriented towards the arts, where the TUKE Faculty of Arts for example records 6 applicants for each place while the KU Faculty of Theology offers 4 places for each applicant. The value for this faculty (0.24) is the lowest for any faculty of a Slovak university. The greatest interest of all is in study at the TVU Faculty of Law – 11 applicants for 1 place offered. In this group of faculties (SOC) the lowest ratio is 1.35 for the UKF Faculty of Education. Faculties in the NAT group range from 4.31 for the UPJŠ Faculty of Natural Sciences to 1.25 for the ŽU Faculty of Natural Sciences. There is a similar situation with regard to TECH where the highest ratio is 5 in the TUKE Faculty of Mining, Ecology, Process Control and Geotechnology and the lowest is 0.89 for the STU Faculty of Electrical Engineering and Information Technology. In the case of the AGRO group, the highest number of applicants is for study at the SPU Faculty of Horticulture and Landscape Engineering (3.5) and the lowest at University of Veterinary Medicine (1.5). For the MED group of faculties the most prospective students applied for one place at the UK Jessenius Faculty of Medicine (7.5) and the least at UPJŠ Faculty of Medicine. With the exception of four faculties (the UK Faculty of Roman Catholic Theology, the UK Faculty of Evangelical Theology, the KU Faculty of Theology, the STU Faculty of Electrical Engineering and Information Technology) all faculties of Slovak universities received more applicants than the faculty offered places, even if this difference is often minimal. Since the ratio of applications to the planned number of students for admission may be influenced by other factors than the reputation of the school, it is not included in the final assessment of the faculties and universities. Nevertheless it is one of the most important things that interest prospective students and so it is included in the report to help complete the picture of Slovak universities. 114
  • 116.
    Number of applicationsreceived in proportion to number planned for admission in acad. year 2004/2005 SV6 Faculty group – MED 8 7,51 7 6 5 4 3,72 3 2,72 2,25 2 1 0 Farm UK JessenLek UK Lek UK Lek UPJŠ Faculty group – NAT 5 4,5 4,31 4 3,69 3,5 3 2,78 2,63 2,39 2,5 2,10 2 1,48 1,5 1,31 1,25 1 0,5 0 FMFI UK Ekolenv TUZ Prír UK Prír UPJŠ Prír UCM Prír UMB Infor.aInf.Tech. Prír UKF Prír ŽU STUBA 115
  • 117.
    Faculty group –AGRO 4 3,52 3,5 3 2,84 2,5 2 1,61 1,58 1,54 1,46 1,5 1 0,5 0 BiotPotr. SPU Drev TUZV Les TUZV Záhrad SPU Agro SPU VeterLek. UVL Faculty group – TECH Elektr STUBA 0,89 ŠpecTechn TUAD 1,03 PriemTech TUAD 1,16 Elektr TUKE 1,20 MechTron TUAD 1,29 Stav STUBA 1,41 Stav ŽU 1,44 Stroj STUBA 1,45 ChemTechn. STUBA 1,51 VýrTech TUKE 1,59 Stroj ŽU 1,63 Stav TUKE 1,76 Mech SPU 1,78 Elektr ŽU 1,80 EnvirTech. TUZV 2,22 Stroj TUKE 2,32 Hutn TUKE 2,35 ŠpecInž ŽU 2,46 Archit STUBA 2,67 MatTechn STUBA 3,06 Ban TUKE 5,00 0 1 2 3 4 5 6 116
  • 118.
    Faculty group –HUM Teol KU 0,24 Evanj UK 0,51 RímsKat UK 0,98 Pravosl.PU 1,10 Teol.TVU 1,40 Greckokat.PU 1,54 Fil KU 1,68 HudTan VŠMU 1,71 FilmTel VŠMU 2,22 MuzUm AU 2,28 HumPrír PU 2,31 Fil PU 3,22 Filolo UMB 3,68 Fil UCM 3,74 DramUm AU 4,00 Hum UMB 4,41 Fil UK 4,61 Divadelná VŠMU 5,05 Fil UKF 5,16 Fil TVU 5,43 VŠVU BL 5,81 VýtvarUm AU 6,24 Umení TUKE 6,25 0 1 2 3 4 5 6 7 117
  • 119.
    Faculty group –SOC25 Manažment PU Športu PU Pedag UKF 1,35 Pedag KU 1,56 Sredoeur.Št.UKF 1,64 Pedag UMB 1,75 TV UK 1,80 Pedag PU 1,89 Zdravotnícka PU 2,07 Riadenia ŽU 2,40 HospInfo EU BA 2,40 Pedag TVU 2,49 Pedag UK 2,63 Eur.Št. SPU 3,24 SocEkon UK 3,33 Pedas ŽU 3,33 Ekonom UMB 4,04 Soc UKF 4,17 Práv UPJŠ 4,20 PodnMan EU BA 4,21 MasMed UCM 4,38 SocEkon TUAD 4,40 NárHosp. EU BA 5,00 Polit UMB 5,15 VerSpr UPJŠ 5,21 Manag UK 5,36 MedzVzťah EU BA 5,44 ZdravSoc TVU 5,54 PodnHosp. EU BA 5,63 Obchod EU BA 6,33 Ekonom TUKE 6,77 EkonomManSPU 6,92 Finan UMB 8,16 Práv UK 8,24 Práv UMB 9,37 Práv TVU 11,17 0 2 4 6 8 10 12 25 In the data source (Správa o stave vysokého školstva za rok 2004, MŠ SR, July 2005) there are no data for number planned for admission in acad. year 2004/2005 at the PU Faculty of Sports and PU Faculty of management. 118
  • 120.
    SV7 Admissions proceedings:number of registered students in proportion to the number of offers This ratio ranges mostly from 40% to 98% and shows to which faculties students submitted applications to as an "insurance policy" and which faculties they really wanted to study at. Illustrative values would not provide a great deal of information and it is more interesting to look at the individual groups of faculties. Table 24: Number of students registered for full time study in proportion to the number of offers for academic year 2004/2005 Faculty Number of students registered for full time study in proportion to the number of offers Faculty of Film and Television, VŠMU HUM 0,98 Faculty of Natural Sciences, ŽU NAT 0,82 Faculty of Mechanical Engineering, TUKE TECH 0,98 University of Veterinary Medicine AGRO 0,83 Faculty of Economics, TUKE SOC 0,94 Faculty of Pharmacy, UK MED 0,83 The criterion of the ratio of the number of registered applicants for study to the number of offers issued by the faculty reflects the real interest of prospective students in study. Apart from three faculties where this parameter was 0.98, which can be considered to be 100% success, all faculties issued more offers than they finally registered students. In the group of faculties oriented towards the humanities there were differences up to 50% While, as expected, the greatest number of offers led to registrations in the artistic faculties (VSMU Faculty of Music and Dance and the VSMU Faculty of Film and Television, both 98%), the KU Faculty of Philosophy did not register 49% of the students it offered places to. It is similar in the case of the SOC faculty group, where 94% of those offered places registered at the TUKE Faculty of Economics but only 52% registered at the UMB Faculty of Finance. Even the NAT faculty group did not deviate strongly from these trends. 82% of those offered places at the ŽU Faculty of Natural Sciences registered, while the UPJŠ Faculty of Natural Sciences and the UK Faculty of Natural Sciences registered only 41% of those offered places, which are the lowest values from the 99 faculties assessed. From the faculties oriented towards technology (TECH), the leaders are three Košice faculties (TUKE Faculty of Mechanical Engineering 98%, the TUKE Faculty of Electrical Engineering and Informatics 97% and the TUKE Faculty of 119
  • 121.
    Mining, Ecology, ProcessControl and Geotechnology 94%), with two faculties jointly at the back of the field, ŽU Faculty of Civil Engineering and STU Faculty of Material Sciences and Technology registering 49% of offers made. The AGRO group is led by the University of Veterinary Medicine on 83%, with the lowest value at the SPU Faculty of Agrobiology and Food Resources with 59%. It may come as a surprise that even the faculties in the MED group did not register all the potential students that they made offers to. The best in this was the UK Faculty of Pharmacy with 83% and the lowest number was at the UK Jessenius Faculty of Medicine (57% of offers made). It is clear that this indicator can be influenced by whether a particular faculty has a "monopoly" in an area of study or whether there more faculties with the same or similar focus. Regional factors may also be involved. Number of registered students in proportion to the number of offers in the academic year r. 2004/2005 SV7 Faculty group – MED 100% 90% 83% 80% 73% 73% 70% 60% 57% 50% 40% 30% 20% 10% 0% Farm UK Lek UK JessenLek UK Lek UPJŠ 120
  • 122.
    Faculty group –NAT 100% 90% 82% 80% 69% 70% 66% 64% 58% 60% 51% 48% 50% 41% 41% 40% 30% 20% 10% 0% FMFI UK Ekolenv TUZ Prír UK Prír UPJŠ Prír UCM Prír UMB Infor.aInf.Tech. Prír UKF Prír ŽU STUBA Faculty group – AGRO 100% 90% 83% 78% 80% 75% 72% 70% 60% 59% 60% 50% 40% 30% 20% 10% 0% BiotPotr. SPU Drev TUZV Les TUZV Záhrad SPU Agro SPU VeterLek. UVL 121
  • 123.
    Faculty group –TECH MatTechn STUBA 49% Stav ŽU 49% ChemTechn. STUBA 51% Stroj ŽU 52% MechTron TUAD 59% Hutn TUKE 61% Elektr ŽU 62% Stroj STUBA 65% ŠpecTechn TUAD 65% VýrTech TUKE 68% Elektr STUBA 69% ŠpecInž ŽU 70% EnvirTech. TUZV 70% PriemTech TUAD 70% Mech SPU 74% Stav TUKE 74% Stav STUBA 77% Archit STUBA 78% Ban TUKE 94% Elektr TUKE 97% Stroj TUKE 98% 0% 20% 40% 60% 80% 100% 122
  • 124.
    Faculty group –HUM Fil KU 51% Fil UCM 60% Filolo UMB 61% Hum UMB 62% Fil TVU 64% Teol KU 68% Fil UKF 69% Fil PU 72% HumPrír PU 72% Fil UK 82% Greckokat.PU 86% VýtvarUm AU 87% RímsKat UK 87% MuzUm AU 89% Pravosl.PU 89% Teol.TVU 90% Umení TUKE 91% Evanj UK 91% DramUm AU 92% VŠVU BL 93% Divadelná VŠMU 95% FilmTel VŠMU 98% HudTan VŠMU 98% 0% 10% 20% 30% 40% 50% 60% 70% 80% 90% 100% 123
  • 125.
    Faculty group –SOC Finan UMB 52% Práv TVU 53% Sredoeur.Št.UKF 53% Obchod EU BA 54% PodnMan EU BA 54% VerSpr UPJŠ 56% Ekonom UMB 61% NárHosp. EU BA 62% Riadenia ŽU 62% Manag UK 63% PodnHosp. EU BA 64% Pedag UK 65% SocEkon TUAD 66% Pedag UKF 66% Soc UKF 67% Eur.Št. SPU 67% Pedag TVU 67% Pedag KU 68% HospInfo EU BA 70% Zdravotnícka PU 71% ZdravSoc TVU 71% Práv UMB 72% Pedag UMB 72% Polit UMB 73% MasMed UCM 73% Pedas ŽU 73% Pedag PU 74% MedzVzťah EU BA 76% Práv UPJŠ 76% SocEkon UK 77% Manažment PU 78% Športu PU 84% TV UK 87% EkonomManSPU 88% Práv UK 92% Ekonom TUKE 94% 0% 20% 40% 60% 80% 100% 124
  • 126.
    SV8 Number of students with foreign state citizenship divided by the total number of students studying full time. The proportion of the number of students with other state citizenship than Slovak in the overall number of full time students reflects the international character of the university faculty. It is widely known that few foreign students study at Slovak universities. We even have faculties (15 in total) that do not report having any foreign students. There are four faculties (or universities) where the proportion of foreign students is greater than 10% of the overall number of full time students: The University of Veterinary Medicine 16.4%, VSMU Faculty of Music and Dance 12%, the Academy of Fine Arts 11% and the TVU Faculty of Theology 10.4%. Table 25: Proportion of students with a different state citizenship Faculty Proportion of foreign students Faculty of Music and Dance, VŠMU HUM 12% Faculty of Natural Sciences, UK NAT 1% Faculty of Civil Engineering, ŽU TECH 2% University of Veterinary Medicine AGRO 16% Faculty of Health Care and Social Work, TVU SOC 9% Faculty of Pharmacy, UK MED 9% Since the total number of students with foreign state citizenship in Slovak public universities is 1 535, i.e. around 1% of the total number of students, it is not included in the final assessment of the faculties and universities (a criterion with such a small amount of data is insufficiently robust). This says a great deal about Slovak education, for example, such as how attractive Slovak universities and their faculties are for foreign students or how intensively faculty and university management works to gain students from other countries. For this reason the indicator is included in the report as a supplementary picture of Slovak higher education. 125
  • 127.
    Number of studentswith foreign state citizenship per total number of students studying full time in the year 2004 SV8 Faculty group – MED 10% 9,1% 9% 8,6% 8% 7% 6% 5,6% 5,0% 5% 4% 3% 2% 1% 0% Farm UK Lek UK JessenLek UK Lek UPJŠ Faculty group – NAT 1,2% 1,0% 1,0% 0,9% 0,9% 0,8% 0,7% 0,6% 0,5% 0,4% 0,4% 0,3% 0,3% 0,2% 0,0% 0,0% FMFI UK Ekolenv TUZ Prír UK Prír UPJŠ Prír UCM Infor.aInf.Tech. Prír UMB Prír UKF Prír ŽU STUBA 126
  • 128.
    Faculty group –AGRO 18% 16,4% 16% 14% 12% 10% 8% 6% 4% 2% 1,0% 0,8% 0,7% 0,5% 0,3% 0% BiotPotr. SPU Drev TUZV Les TUZV Záhrad SPU Agro SPU VeterLek. UVL 127
  • 129.
    Faculty group –TECH ŠpecInž ŽU 0,0% PriemTech TUAD 0,0% Stroj ŽU 0,1% Stroj TUKE 0,1% Hutn TUKE 0,1% VýrTech TUKE 0,1% MechTron TUAD 0,1% EnvirTech. TUZV 0,2% MatTechn STUBA 0,5% Ban TUKE 0,5% Stav TUKE 0,5% Stav STUBA 0,6% Elektr ŽU 0,8% Mech SPU 0,9% Elektr TUKE 1,0% Stroj STUBA 1,1% ChemTechn. STUBA 1,1% ŠpecTechn TUAD 1,1% Elektr STUBA 1,7% Archit STUBA 2,1% Stav ŽU 2,6% 0,0% 0,5% 1,0% 1,5% 2,0% 2,5% 3,0% 128
  • 130.
    Faculty group –HUM HumPrír PU 0,0% Fil TVU 0,1% Fil KU 0,2% Greckokat.PU 0,3% Hum UMB 0,3% Fil UCM 0,3% Fil PU 0,7% Filolo UMB 0,8% Umení TUKE 0,8% DramUm AU 1,0% Fil UKF 1,3% Pravosl.PU 1,7% Fil UK 2,0% VýtvarUm AU 2,1% Teol KU 2,1% Divadelná VŠMU 2,3% FilmTel VŠMU 2,5% RímsKat UK 2,5% Evanj UK 5,6% MuzUm AU 6,9% Teol.TVU 10,4% VŠVU BL 11,2% HudTan VŠMU 12,0% 0% 2% 4% 6% 8% 10% 12% 14% 129
  • 131.
    Faculty group –SOC Zdravotnícka PU 0,0% Sredoeur.Št.UKF 0,0% VerSpr UPJŠ 0,0% Pedag PU 0,0% Pedag TVU 0,0% PodnMan EU BA 0,0% Práv TVU 0,0% PodnHosp. EU BA 0,0% Práv UPJŠ 0,0% Pedag KU 0,0% Práv UMB 0,0% Riadenia ŽU 0,2% Manažment PU 0,2% SocEkon TUAD 0,2% MasMed UCM 0,3% NárHosp. EU BA 0,3% Pedag UKF 0,3% Eur.Št. SPU 0,4% HospInfo EU BA 0,5% Ekonom UMB 0,6% Polit UMB 0,7% Ekonom TUKE 0,7% Pedag UK 0,9% Športu PU 1,1% Obchod EU BA 1,2% Soc UKF 1,3% SocEkon UK 1,3% TV UK 1,4% EkonomManSPU 1,4% Práv UK 1,6% Pedag UMB 1,7% Finan UMB 1,8% Pedas ŽU 3,0% Manag UK 3,1% MedzVzťah EU BA 4,0% ZdravSoc TVU 9,5% 0% 1% 2% 3% 4% 5% 6% 7% 8% 9% 10% 130
  • 132.
    "University-level criteria" Group SV9 Unemployed graduates Since the number of university graduates unemployed for over 6 months was quite negligible in September (362 graduates), it was not included in the final assessment of the faculties and universities. Since this indicator may say a lot about Slovak universities and will certainly interest those who are preparing to apply to study at university, it is included in the report to add to its picture of Slovak universities. 5% 4,4% 4% 3,4%3,3% 3% 2,0% 2% 1,4%1,2% 1,1%1,1%0,9% 1% 0,7%0,7%0,6%0,6% 0,4%0,3% 0,0%0,0%0,0%0,0% 0% ŽU Žilina UK Bratislava TU Zvolen Bratislava Bratislava Bratislava Ružomberok EU Bratislava UPJŠ Košice UVL Košice Bystrica Bystrica Trenčín TvU Trnava TU Košice PU Prešov UCM Trnava SPU Nitra UKF Nitra UMB B. TUAD AU B. VŠMU VŠVU STU KU Purely for the sake of interest, we can state that at present university graduates make up only 0.68% of unemployed graduates and the long-term trend is for this number to fall. In practice this means that there are effectively no university graduates among the long term unemployed because every one of them finds work eventually (even if it is not necessarily in the area that they studied). 131
  • 133.
    SV 10 Students taking part in study abroad The number of university graduates taking part in study abroad (based on information from the Erasmus and Leonardo programs and data from SAIA) was very low (1 112) and therefore it was not included in the final assessment of the faculties and universities. By way of illustration, we calculate that if every graduate from the students currently studying at university were to spend at least one semester abroad, which is the recommendation that has emerged from the Bologna process, this would mean that every year 30 000 students of public universities would need to be traveling as part of their study. 5% 4,2% 4% 2,7% 3% 2,2% 1,8%1,7% 2% 1,3%1,2%1,2% 1,0%1,0% 0,7%0,7%0,6%0,6%0,6% 1% 0,5%0,5% 0,4% 0,0% 0% UVL Košice ŽU Žilina TU Košice Ružomberok UPJŠ Košice UKF Nitra TU Zvolen SPU Nitra Trenčín UCM Trnava TvU Trnava Bystrica Bystrica PU Prešov Bratislava Bratislava Bratislava Bratislava UMB B. TUAD AU B. VŠMU STU UK EU KU 132
  • 134.
    Financing F1 Running cost expenditure per one student Running cost expenditure per student represents the total amount of funding that the university gained from public sources in 2004 for its educational and scientific activities, for operation and also for social purposes (catering, accommodation and grants for students) divided by the number of students of the given university. The proportion spent per one student indicates the level of equipment and the quality of the university's activity. It is related to the quality of the environment in which students will study. The larger the volume allocated per student, the higher the number of points won by the faculty. At the same time, however, this parameter also reflects the requirements for study and also the differences in the criteria that the SR Ministry of Education applies in allocating funding to individual universities. 180 163 160 160 140 129 120 105 100 89 71 69 80 63 54 52 49 60 38 36 31 31 30 30 40 27 26 20 0 UK Bratislava ŽU Žilina TU Zvolen Bratislava Bratislava Bratislava Ružomberok UVL Košice UPJŠ Košice EU Bratislava Bystrica Bystrica Trenčín TvU Trnava TU Košice PU Prešov UCM Trnava SPU Nitra UKF Nitra UMB B. TUAD AU B. VŠMU VŠVU STU KU 133
  • 135.
    F2 Success of the university's business activities It is good that universities are using a larger proportion of their own resources to support and improve their main activities i.e. science and education. Universities gain the largest part of their non-subsidy funding from their main activities (e.g. lifelong learning, contract research etc.). In addition to this they also do some business. The stated parameter shows that universities are no threat to the business sector but also that at present they are not capable of earning enough through these activities. In fact, in the case of the University of Veterinary Medicine, it would have more funds for its main activities if it did not do any business. Under the Higher Education Act, all costs of business activities must be covered from the revenues of these activities. 3,0% 2,8% 2,5% 2,0% 1,8% 1,5% 1,1%1,1% 1,0% 0,8%0,8% 0,5%0,5%0,5%0,4% 0,5% 0,3%0,3%0,2%0,2%0,2%0,1%0,1%0,0% 0,0% ŽU Žilina UK Bratislava TU Zvolen Bratislava Bratislava Bratislava Ružomberok UPJŠ Košice EU Bratislava UVL Košice Bystrica Bystrica TvU Trnava Trenčín TU Košice UCM Trnava PU Prešov SPU Nitra UKF Nitra UMB B. -0,1% TUAD AU B. -0,5% VŠMU VŠVU STU KU 134
  • 136.
    F3 The proportion of grant funding to the university's budget for its main activities In other countries the proportion of fund intended for the support of research and development activities that the university or faculty gains in open competition is very often given as one of the key criteria determining the quality of the university/faculty. This number also reflects the level of research carried out in the faculty or university. It also provides information about the quality of the employees of the institution because the better the teachers and research and artistic employees of the faculty, the more grants they will be able to obtain (obviously, compared only within the given groups of faculties) and therefore the higher the level of quality they will be able to offer to their students. Slovak universities would not be able to compete alongside the good world universities even in this competition. The best universities (e.g. Oxford) are able to get 50% of their budget from such sources and average ones (e.g. Oregon) obtain around 25% of their budget in contests for funds for research and development financing. 8% 7,5% 6,9% 7% 5,8% 6% 4,6% 5% 4,1% 3,7% 4% 3,2%2,9% 2,6% 3% 1,8% 2% 1,4%1,4%1,3% 1,0%0,8% 0,7%0,7%0,5%0,5% 1% 0% UK Bratislava ŽU Žilina TU Zvolen Bratislava Bratislava Bratislava Ružomberok UVL Košice UPJŠ Košice EU Bratislava Bystrica Bystrica Trenčín TvU Trnava TU Košice PU Prešov UCM Trnava SPU Nitra UKF Nitra UMB B. TUAD AU B. VŠMU VŠVU STU KU 135
  • 137.
    How much doesquality cost? The American magazine U.S. News and World Report, which has been assessing American universities for many years uses an interesting method – it asks how much money a school needs to reach an appropriate point score. Transformed to Slovak conditions, this means what does a university spend on one student and one point on the quality scale in the final assessment? The ARRA report uses an assessment of the university based on a so-called recalculated number of students (taking into consideration the higher demands of PhD study and the lower demands of part time study, as calculated by the Ministry of Education) and the school's overall expenditure on its main activities. The number in the last column of Table 26 shows the amount in Slovak Crowns that the given university has to pay to enable one of its students to get education with one point of quality (under the ARRA method). Table 26: Value of a point of quality calculated for one student in SKK points students running costs expenditures recalculated points*students 1 University of Trnava 42 4 161 206 848 1 187 2 University of Economics 32 10 283 421 134 1 273 3 Technical University in Zvolen 55 3 626 269 984 1 345 4 Technical University of Košice 43 12 286 726 146 1 364 5 University of Prešov 35 7 539 375 840 1 405 6 Slovak University of Technology 55 16 064 1 254 429 1 427 7 Slovak University of Agriculture 46 7 737 518 300 1 448 8 Matej Bel University 30 9 483 408 509 1 457 9 Constantine the Philosopher University 30 8 156 361 244 1 480 10 Alexander Dubček University in Trenčín 32 3 130 149 603 1 503 11 University of St. Cyril and Methodius 24 3 134 115 919 1 544 12 University of Žilina 39 9 165 577 490 1 626 13 Comenius University 52 21 812 1 860 390 1 650 14 Catholic University 27 3 942 189 717 1 791 15 Pavol Jozef Šafárik University 49 5 408 525 705 1 984 16 University of Veterinary Medicine 80 943 160 699 2 125 17 Academy of Music and Dramatic Arts 43 984 106 605 2 515 18 Academy of Fine Arts and Design 51 609 96 041 3 105 19 Academy of Arts 37 349 45 179 3 481 It is no surprise that the universities of the arts and those that involve expensive studies need the largest amount of funding for achieving an equivalent amount of quality. To put it simply, the Academy of the Arts in Banská Bystrica provides the same level of quality as Trnava University at three times the price. 136
  • 138.
    A second, veryclosely related question is how universities remunerate the people who produce its quality, i.e. the teachers and research and artistic employees. The universities that paid the least, relatively, for the quality that their employees produced in 2003 were the University of Veterinary Medicine, the Technical University in Zvolen and Comenius University, and those that paid the most on the other hand were the Constantine the Philosopher University, the University of Ss. Cyril and Methodius in Trnava and the Catholic University in Ružomberok. Table 27: The value of one point of quality calculated from payroll expenditure for teachers and research and artistic workers Average salary Payroll expenditure Points of creative per one point of worker quality 1 Constantine the Philosopher University 30 25 308 845 2 University of St. Cyril and Methodius 24 19 602 818 3 Catholic University 27 19 893 740 4 Matej Bel University 30 20 731 701 5 University of Economics 32 21 657 673 6 Alexander Dubček University in Trenčín 32 21 296 670 7 University of Prešov 35 23 488 662 8 Academy of Arts 37 22 325 600 9 University of Žilina 39 22 900 591 10 University of Trnava 42 24 490 585 11 Technical University of Košice 43 24 293 561 12 Academy of Music and Dramatic Arts 43 21 526 500 13 Slovak University of Agriculture 46 23 033 498 14 Academy of Fine Arts and Design 51 23 445 462 15 Pavol Jozef Šafárik University 49 22 447 458 16 Slovak University of Technology 55 24 208 443 17 Comenius University 52 22 363 433 18 Technical University in Zvolen 55 19 926 360 19 University of Veterinary Medicine 80 25 303 316 137
  • 139.
    Teachers Applicati- Publicati- PhD Studies Grant and ons for ons and (VV4-VV6) Success AGRO AVERAGE students study (SV7) citations (VV7-VV9) (SV1-SV5) (VV1-VV3) 1 University of Veterinary Medicine University of Veterinary Medicine 91 100 100 64 65 83,8 8. 2 Faculty of Forestry Technical University in Zvolen 78 87 33 56 73 65,5 3 Faculty of Agrobiology and Food Resources Slovak University of Agriculture 72 71 20 58 87 61,6 4 Faculty of Wood Sciences and Technology Technical University in Zvolen 70 90 11 71 43 57,1 5 Faculty of Horticulture and Landscape Engineering Slovak University of Agriculture 56 94 3 86 38 55,5 6 Faculty of Biotechnology and Food Sciences Slovak University of Agriculture 61 72 26 36 11 41,3 Teachers Applicati- Publicati- PhD Studies Grant and ons for ons and (VV4-VV6) Success HUM AVERAGE students study (SV7) citations (VV7-VV9) (SV1-SV5) (VV1-VV3) 1 Faculty of Arts Comenius University 59 84 85 41 54 64,7 2 Faculty of Arts University of Prešov 52 73 53 32 60 53,8 3 Faculty of the Humanities and Natural Sciences University of Prešov 53 73 76 14 49 53,0 4 Faculty of Arts University of Trnava 61 65 27 35 67 51,0 5 Academy of Fine Arts and Design Academy of Fine Arts and Design 65 95 0 30 61 50,1 6 Faculty of Theatre Arts Academy of Music and Dramatic Arts 67 97 0 48 33 49,0 7 Faculty of Film and Television Academy of Music and Dramatic Arts 71 100 0 58 11 47,9 8 Faculty of Performing Arts Academy of Arts 86 91 0 0 59 47,1 9 Faculty of Theology University of Trnava 71 92 0 61 0 44,7 10 Orthodox Theological Faculty University of Prešov 54 91 0 60 12 43,4 11 Faculty of Music and Dance Academy of Music and Dramatic Arts 73 100 0 35 5 42,6 12 Evangelical Theological Faculty Comenius University 60 93 29 25 5 42,3 13 Roman Catholic Theological Faculty of Cyril and Methodius Comenius University 53 89 2 49 18 42,0 14 Faculty of Arts Constantine the Philosopher University 42 70 2 27 35 35,3 15 Faculty of the Humanities Matej Bel University 46 63 8 25 34 35,2 16 Faculty of Fine Arts and Design Academy of Arts 62 89 0 0 23 34,6 17 Faculty of Dramatic Arts Academy of Arts 68 94 0 0 0 32,4 18 Faculty of Theology Catholic University 58 69 0 20 0 29,5 19 Faculty of Arts Technical University of Košice 47 93 0 0 0 28,0 20 Greek Catholic Theological Faculty University of Prešov 47 88 0 0 5 27,9 21 Faculty of Arts University of St. Cyril and Methodius 51 61 3 0 22 27,4 22 Faculty of Philosophy Catholic University 44 52 4 15 18 26,5 23 Faculty of Philology Matej Bel University 36 62 0 0 4 20,5 Teachers Applicati- Publicati- PhD Studies Grant and ons for ons and (VV4-VV6) Success MED AVERAGE students study (SV7) citations (VV7-VV9) Aggregate assessment of faculties within groups (SV1-SV5) (VV1-VV3) 1 Faculty of Pharmacy Comenius University 89 100 100 47 60 79,3 2 Jessenius Faculty of Medicine Comenius University 87 69 33 83 91 72,3 Table 28: Assessment of faculties within Frascati groups – points scored and average results 3 Faculty of Medicine Pavol Jozef Šafárik University 80 88 44 90 52 70,7 4 Faculty of Medicine Comenius University 97 88 37 53 40 63,0 138
  • 140.
    Teachers Applicati- Publicati- PhD Studies Grant and ons for ons and (VV4-VV6) Success NAT AVERAGE students study (SV7) citations (VV7-VV9) (SV1-SV5) (VV1-VV3) 1 Faculty of Mathematics, Physics and Informatics Comenius University 93 71 92 80 76 82,3 2 Faculty of Natural Sciences Comenius University 76 50 52 92 90 72,0 3 Faculty of Natural Sciences Pavol Jozef Šafárik University 81 50 80 58 71 68,2 4 Faculty of Ecology and Environmental Sciences Technical University in Zvolen 65 80 9 51 30 47,0 5 Faculty of Informatics and Information Technologies Slovak University of Technology 56 78 1 48 45 45,4 6 Faculty of Natural Sciences Constantine the Philosopher University 60 62 9 67 26 44,9 7 Faculty of Natural Sciences Matej Bel University 48 84 9 36 9 37,1 8 Faculty of Natural Sciences University of Žilina 59 100 1 12 6 35,4 9 Faculty of Natural Sciences University of St. Cyril and Methodius 58 59 4 0 8 25,8 Teachers Applicati- Publicati- PhD Studies Grant and ons for ons and (VV4-VV6) Success SOC AVERAGE students study (SV7) citations (VV7-VV9) (SV1-SV5) (VV1-VV3) 1 Faculty of Health Care and Social Work University of Trnava 67 76 100 96 12 70,2 2 Faculty of Physical Education and Sports Comenius University 80 93 3 42 42 51,9 3 Faculty of Management and Informatics University of Žilina 56 66 1 29 100 50,5 4 Faculty of Sports University of Prešov 82 89 0 26 47 48,9 5 Faculty of Economics Technical University of Košice 57 100 9 24 48 47,5 6 Faculty of Economics and Management Slovak University of Agriculture 63 94 1 37 38 46,6 7 Faculty of Social and Economic Sciences Comenius University 79 82 0 0 42 40,6 8 Faculty of International Relations University of Economics 59 81 5 50 7 40,4 9 Faculty of Education Comenius University 56 69 1 26 48 40,1 10 Faculty of Operation and Economics of Transport and Communications University of Žilina 60 78 0 33 28 39,9 11 Faculty of Education University of Prešov 47 79 1 28 41 39,0 12 Faculty of Education University of Trnava 64 71 6 13 33 37,6 13 Faculty of Law Comenius University 60 98 1 17 8 36,8 14 Faculty of National Economy University of Economics 62 66 7 15 35 36,7 15 Faculty of Education Constantine the Philosopher University 51 70 0 25 31 35,7 16 Faculty of Commerce University of Economics 61 57 9 21 28 35,6 17 Faculty of Law University of Trnava 62 56 0 26 28 34,4 18 Faculty of European Studies and Regional Development Slovak University of Agriculture 57 71 3 23 16 34,1 19 Faculty of Economics Matej Bel University 49 65 1 25 25 32,9 20 Faculty of Business Management University of Economics 60 57 5 13 29 32,8 21 Faculty of Management Comenius University 51 67 3 37 6 32,7 22 Faculty of Law Pavol Jozef Šafárik University 66 81 1 2 13 32,5 23 Faculty of Business Economics University of Economics 61 68 1 19 12 32,2 24 Pedagogical Faculty Catholic University 53 72 1 11 22 31,9 25 Faculty of Economic Informatics University of Economics 51 74 7 12 14 31,8 26 Faculty of Education Matej Bel University 58 77 0 14 2 30,2 27 Faculty of Political Sciences and International Relations Matej Bel University 51 78 0 21 0 30,1 28 Faculty of Public Administration Pavol Jozef Šafárik University 55 60 3 0 32 30,0 29 Faculty of Law Matej Bel University 59 77 0 1 6 28,6 30 Faculty of Social Sciences and Health Constantine the Philosopher University 52 71 0 6 8 27,3 31 Faculty of Management University of Prešov 51 83 0 0 0 26,8 139 32 Faculty of Social and Economic Relations Alexander Dubček University in Trenčín 45 70 0 0 15 26,1 33 Faculty of Mass Media Communication University of St. Cyril and Methodius 44 78 0 0 3 25,0 Table 28: Assessment of faculties within Frascati groups – points scored and average results (continued) 34 Faculty of Health Care University of Prešov 39 76 0 0 0 22,9 35 Faculty of Finances Matej Bel University 51 55 2 0 3 22,3 36 Faculty of Central European Studies Constantine the Philosopher University 53 56 0 0 0 21,9
  • 141.
    Teachers Applicati- Publicati- PhD Studies Grant and ons for ons and (VV4-VV6) Success TECH AVERAGE students study (SV7) citations (VV7-VV9) (SV1-SV5) (VV1-VV3) 1 Faculty of Chemical and Food Technology Slovak University of Technology 98 52 100 80 72 80,4 2 Faculty of Electrical Engineering and Information Technology Slovak University of Technology 73 70 22 56 71 58,6 3 Faculty of Environmental and Manufacturing Technology Technical University in Zvolen 71 71 1 45 84 54,5 4 Faculty of Mining, Ecology, Process Control and Geotechnology Technical University of Košice 53 96 5 74 38 53,4 5 Faculty of Metallurgy Technical University of Košice 71 62 17 69 39 51,7 6 Faculty of Mechanical Engineering Technical University of Košice 57 100 1 51 44 50,4 7 Faculty of Electrical Engineering and Informatics Technical University of Košice 67 99 5 45 34 49,9 8 Faculty of Mechanical Engineering University of Žilina 70 53 1 70 56 49,8 9 Faculty of Industrial Technologies Alexander Dubček University in Trenčín 55 71 16 40 60 48,4 10 Faculty of Civil Engineering Slovak University of Technology 67 79 6 48 36 47,2 11 Faculty of Architecture Slovak University of Technology 68 80 0 58 23 45,6 12 Faculty of Mechanical Engineering Slovak University of Technology 70 66 5 49 38 45,5 13 Faculty of Civil Engineering Technical University of Košice 66 76 1 47 32 44,5 14 Faculty of Agricultural Engineering Slovak University of Agriculture 65 76 1 36 28 41,1 15 Faculty of Electrical Engineering University of Žilina 66 63 2 43 22 39,3 16 Faculty Manufacturing Technologies Technical University of Košice 53 69 1 29 39 38,2 17 Faculty of Special Engineering University of Žilina 56 71 0 37 14 35,7 18 Faculty of Civil Engineering University of Žilina 61 50 0 46 16 34,8 19 Faculty of Special Technology Alexander Dubček University in Trenčín 59 66 0 35 7 33,4 20 Faculty of Material Sciences and Technology Slovak University of Technology 55 50 1 37 22 33,1 21 Faculty of Mechatronics Alexander Dubček University in Trenčín 46 60 1 0 35 28,3 140 Table 28: Assessment of faculties within Frascati groups – points scored and average results (continued)
  • 142.
    9. Aggregate assessment of financial indicators Table 29: Assessment of universities by financial criteria – points scored Running costs Proportion of Proportion of Average of per student business grants to financial activity yield to expenditures indicators Financing expenditures for main for main activities activities Slovak University of Technology 44 100 78 74 University of Veterinary Medicine 99 -5 92 62 Academy of Fine Arts and Design 100 40 24 54 Technical University in Zvolen 39 18 100 52 Slovak University of Agriculture 32 38 62 44 Pavol Jozef Šafárik University 55 29 43 42 Comenius University 42 7 50 33 Academy of Arts 80 9 10 33 Technical University of Košice 30 14 54 33 Matej Bel University 16 65 7 29 University of Žilina 33 17 35 29 Academy of Music and Dramatic Arts 65 6 7 26 Alexander Dubček University in Trenčín 22 0 39 21 University of Economics 19 27 9 18 University of Prešov 24 5 19 16 Catholic University 18 16 9 15 Constantine the Philosopher University 19 6 18 14 University of St. Cyril and Methodius 16 10 14 14 University of Trnava 19 4 18 13 141
  • 143.
    10. University level indicators The indicators within individual groups can be transformed into an assessment of universities as a whole in a number of ways. The most natural way is to consider the university as a whole composed of faculties. It is necessary to preserve the principle of "comparing like with like" and therefore the assessment (number of points) obtained by each faculty in the group to which it belongs is taken into consideration. The average of the assessments for all the faculties of each university are calculated in each of the five groups of indicators. The results of this calculation are given in Table 28. The greatest significance is still given to the value of each indicator for each faculty, which best illustrates the situation in each particular faculty and enables a comparison with faculties with a similar orientation. To improve orientation in the table, the universities are listed in alphabetical order (and not in the order that they appear in, for example, in the Higher Education Act). Table 30: Assessment of universities in group criteria based on the average assessment of their faculties (in alphabetical order – points scored) Teachers Applicati- Publicati- PhD Grant and ons for ons and Studies Success students study citations Academy of Arts 71,9 91,2 0,0 0,0 27,1 Academy of Fine Arts and Design 64,7 94,9 0,0 30,0 60,7 Academy of Music and Dramatic Arts 70,3 99,0 0,0 47,2 16,2 Alexander Dubček University in Trenčín 51,2 67,0 4,2 18,8 29,0 Catholic University 51,6 64,6 1,6 15,4 13,4 Comenius University 72,3 80,9 33,7 45,5 44,7 Constantine the Philosopher University 51,5 66,1 2,4 25,0 20,1 Matej Bel University 49,7 70,1 2,6 15,2 10,4 Pavol Jozef Šafárik University 70,7 69,6 32,0 37,5 41,9 Slovak University of Agriculture 62,6 79,6 8,9 46,0 36,3 Slovak University of Technology 69,5 67,9 19,3 53,8 43,7 Technical University in Zvolen 71,1 82,3 13,4 55,5 57,7 Technical University of Košice 58,8 86,9 4,9 42,3 34,3 University of Economics 59,0 67,4 5,5 21,8 20,9 University of Prešov 53,1 81,5 16,1 19,9 26,8 University of St. Cyril and Methodius 51,1 65,8 2,4 0,0 10,9 University of Trnava 64,8 72,1 26,7 46,4 27,9 University of Veterinary Medicine 90,6 100,0 100,0 63,8 64,6 University of Žilina 61,2 68,8 0,8 38,6 34,5 142
  • 144.
    11. Aggregate assessment of universities In the same way as for the final assessment of the faculties, a final evaluation can also be calculated for the university based on the average assessment for individual groups of indicators. After incorporating the indicators F1 to F3 into the average assessment of the universities (through a separate sixth table), the points score for individual universities looks as shown in Table 31. Table 31: Assessment of universities based on the average points scores of their faculties 1 University of Veterinary Medicine 80 2 Slovak University of Technology 55 2= Technical University in Zvolen 55 4 Comenius University 52 5 Academy of Fine Arts and Design 51 6 Pavol Jozef Šafárik University 49 7 Slovak University of Agriculture 46 8 Technical University of Košice 43 8= Academy of Music and Dramatic Arts 43 10 University of Trnava 42 11 University of Žilina 39 12 Academy of Arts 37 13 University of Prešov 35 14 University of Economics 32 14= Alexander Dubček University in Trenčín 32 16 Constantine the Philosopher University 30 16= Matej Bel University 30 18 Catholic University 27 19 University of St. Cyril and Methodius 24 The table shows that it is basically possible to break down Slovak universities into three groups. The University of Veterinary Medicine, which gained the highest number of points, forms a group by itself, the second group consists of universities from second to tenth place (the so-called "above average") with the second place university being 25 points behind the university in first place. The difference between second and tenth place is 13 points. The eleventh placed university is 3 points behind the tenth placed one and leads the third group of universities, where the difference between eleventh and nineteenth place is 15 points. The average value is rounded to 42 points, only ten universities scored this number or higher. With a degree of inaccuracy, it is also possible to divide universities into three similar groups based on their orientation – the artistic (the Academy of Music and the Performing Arts, the Academy of Fine Arts, the Academy of Arts), the mainly technical (the Slovak University of Technology, Žilina University, the Technical 143
  • 145.
    University in Zvolen,the Technical University of Košice) and general/mixed universities (all others apart from the University of Veterinary Medicine, though nearly all those marked as general have at least one faculty oriented towards the natural sciences and some have other faculties from other groups e.g. MED). A comparison of universities in these groups is shown in Table 32 Table 32: Assessment of universities in areas Artistic 1 Academy of Fine Arts and Design 51 2 Academy of Music and Dramatic Arts 43 3 Academy of Arts 37 Technical (mainly) 1 Technical University in Zvolen 55 1= Slovak University of Technology 55 3 Technical University of Košice 43 4 University of Žilina 39 General 1 Comenius University 52 2 Pavol Jozef Šafárik University 49 3 Slovak University of Agriculture 46 4 University of Trnava 42 5 University of Prešov 35 6 University of Economics 32 6= Alexander Dubček University in Trenčín 32 8 Constantine the Philosopher University 30 8= Matej Bel University 30 10 Catholic University 27 11 University of St. Cyril and Methodius 24 It is more accurate to measure the performance of universities in particular areas according to the performance achieved by the faculties that operate in the given area. Fore example, the performance of UK in the area of NAT is determined by the performance of its two faculties that fall into this group (the UK Faculty of Mathematics, Physics and Informatics and the UK Faculty of Natural Sciences). The results are shown in Table 33. For individual universities, only those faculties are shown that belong to the same group. 144
  • 146.
    Table 33: Assessmentof universities based on the average of their faculties Teachers Applicati- Publicati- and ons for ons and PhD Studies Grants AVERAGE AGRO students study citations 1 University of Veterinary Medicine AGRO 89,7 100,0 100,0 62,7 64,6 83,4 2 Technical University in Zvolen AGRO 79,1 88,6 22,1 67,7 58,4 63,2 3 Slovak University of Agriculture AGRO 67,0 79,1 16,3 59,2 45,1 53,4 Teachers Applicati- Publicati- and ons for ons and PhD Studies Grants AVERAGE HUM students study citations 1 Academy of Fine Arts and Design HUM 62,3 94,9 0,0 43,4 60,7 52,3 2 University of Trnava HUM 67,0 78,6 13,5 65,8 33,3 51,6 3 Academy of Music and Dramatic Arts HUM 68,4 99,0 0,0 57,7 16,2 48,2 4 Comenius University HUM 61,0 88,4 38,7 23,7 25,8 47,5 5 University of Prešov HUM 53,3 81,4 32,0 33,1 31,4 46,2 6 Constantine the Philosopher University HUM 43,7 70,4 2,4 42,7 35,2 38,9 7 Academy of Arts HUM 68,5 91,2 0,0 0,0 27,1 37,4 8 Catholic University HUM 52,9 60,7 1,9 30,1 8,9 30,9 9 Matej Bel University HUM 42,7 62,8 4,1 15,4 19,2 28,8 10 University of St. Cyril and Methodius HUM 51,8 61,2 3,4 0,0 21,8 27,7 11 Technical University of Košice HUM 44,9 92,9 0,0 0,0 0,0 27,6 Teachers Applicati- Publicati- and ons for ons and PhD Studies Grants AVERAGE MED students study citations 1 Comenius University MED 75,1 85,5 56,7 74,4 63,7 71,1 2 Pavol Jozef Šafárik University MED 65,5 88,0 43,5 89,9 51,6 67,7 Teachers Applicati- Publicati- and ons for ons and PhD Studies Grants AVERAGE NAT students study citations 1 Comenius University NAT 87,1 60,4 72,0 85,8 82,8 77,6 2 Pavol Jozef Šafárik University NAT 81,4 50,0 80,3 53,3 71,2 67,2 3 Slovak University of Technology NAT 55,7 78,0 1,0 70,0 44,6 49,9 4 Technical University in Zvolen NAT 65,3 80,5 9,0 58,1 29,7 48,5 5 Constantine the Philosopher University NAT 61,3 62,2 9,4 72,3 26,1 46,3 6 Matej Bel University NAT 59,3 84,1 8,8 43,8 8,5 40,9 7 University of Žilina NAT 66,3 100,0 0,9 12,2 6,0 37,1 8 University of St. Cyril and Methodius NAT 72,1 58,5 3,8 0,0 8,1 28,5 Teachers Applicati- Publicati- and ons for ons and PhD Studies Grants AVERAGE SOC students study citations 1 University of Trnava SOC 79,1 67,7 35,4 49,3 24,3 51,2 2 Technical University of Košice SOC 55,1 100,0 9,2 32,8 48,0 49,0 3 Slovak University of Agriculture SOC 69,0 82,4 2,1 34,4 27,2 43,0 4 Comenius University SOC 64,4 81,7 1,6 30,6 29,3 41,5 5 University of Economics SOC 60,2 67,4 5,5 29,1 20,9 36,6 6 University of Prešov SOC 55,9 81,6 0,1 17,6 22,1 35,5 7 Catholic University SOC 61,9 72,3 0,9 14,6 22,3 34,4 8 University of Žilina SOC 54,5 71,8 0,7 36,2 64,0 33,7 9 Matej Bel University SOC 61,5 70,2 0,8 15,7 7,2 31,1 10 Pavol Jozef Šafárik University SOC 57,7 70,2 2,0 0,9 22,5 30,7 11 Constantine the Philosopher University SOC 58,6 66,0 0,1 12,5 13,1 30,0 12 Alexander Dubček University in Trenčín SOC 52,9 70,2 0,0 0,0 14,9 27,6 13 University of St. Cyril and Methodius SOC 48,8 77,7 0,0 0,0 2,9 25,9 145
  • 147.
    Teachers Applicati- Publicati- and ons for ons and PhD Studies Grants AVERAGE TECH students study citations 1 Technical University in Zvolen TECH 69,7 71,4 0,6 51,2 84,4 55,5 2 Slovak University of Technology TECH 71,3 66,2 22,3 56,2 43,6 51,9 3 Technical University of Košice TECH 61,3 83,7 5,0 49,8 37,7 47,5 4 Slovak University of Agriculture TECH 67,8 75,5 0,5 38,2 27,8 42,0 5 University of Žilina TECH 63,0 59,4 0,7 50,4 26,9 40,1 6 Alexander Dubček University in Trenčín TECH 58,6 66,0 5,6 36,4 33,7 40,1 In other words, analysis shows that, for example, Comenius University occupies the fourth place among universities with humanities-oriented faculties for the performance of its humanities-oriented faculties, the same fourth place among thirteen universities in the SOC area, but two first places – in MED, among two universities and NAT among eight universities. 146
  • 148.
    12. Conclusion There can be no doubt that as in the past, universities are in the present the heart and the driving force for the development of the knowledge based society. They are irreplaceable for the prosperity and positive development of a globalizing world. There are however, two requirements for them to carry out their tasks: that their free spirit is preserved and that the education and research that they provide and carry out have a high level of quality. This study may also encourage universities and their faculties to think about their performance and to try to find ways to improve. Many may be surprised by the findings that emerge from the analysis of the results and which show that in Slovakia we do not have a compact area of quality higher education but only so-called islands of positive deviation. We are convinced that when these islands change into larger units and whole "continents” of quality education and research emerge, some Slovak universities may make it into the list of the top 20026 or 50027 universities in the world. 26 The Times Higher Education Supplement (THES), 28 October 2005; www.thes.co.uk/statistics. 27 http://ed.sjtu.edu.cn/en/index.htm. 147