This study evaluates public satisfaction with the 'aplikasi cek bansos' application by utilizing supervised machine learning algorithms, finding that the K-Nearest Neighbor (KNN) method achieved an accuracy of 99.21%. The analysis indicates a prevailing negative sentiment among users, primarily due to issues such as app instability and navigation problems. Recommendations are provided for improving user satisfaction and enhancing the application’s quality based on identified themes from user feedback.
![IAES International Journal of Artificial Intelligence (IJ-AI)
Vol. 13, No. 2, June 2024, pp. 1608~1618
ISSN: 2252-8938, DOI: 10.11591/ijai.v13.i2.pp1608-1618 1608
Journal homepage: http://ijai.iaescore.com
Assessing public satisfaction of public service application using
supervised machine learning
Ilham Zharif Mustaqim1
, Hasna Melani Puspasari1
, Avita Tri Utami1
,
Rahmad Syalevi1
, Yova Ruldeviyani1,2
1
Department of Information Technology, Faculty of Computer Science, University of Indonesia, Jakarta, Indonesia
2
Department of Computer Science, Faculty of Computer Science, University of Indonesia, Depok, Indonesia
Article Info ABSTRACT
Article history:
Received Apr 6, 2023
Revised Feb 3, 2024
Accepted Feb 15, 2024
The COVID-19 pandemic has enormously affected the economic situation
worldwide, including in Indonesia resulting in 30 million Indonesian
tumbling into penury. The Ministry of Social Affairs initiated a program to
distribute social assistance aimed at the poorest households. ‘Aplikasi Cek
Bansos’ is a public service application that aims to validate their status
towards the social assistance program. Understanding the public sentiment
and factors affecting public satisfaction levels is crucial to be performed.
The goal of this study is to perform a comparative study of supervised
machine learning to learn the sentiment of the public and the dominant
variable resulting in public satisfaction. Support vector machine, Naïve
Bayes dan K-nearest neighbor (KNN) are performed to seek the highest
accuracy. This experiment discovered that the KNN algorithm produced
outstanding performance where the accuracy hit 99.21%. Sentiment
prediction indicated negative perception as the majority covering 83.81%.
Trigrams analysis is performed to learn themes affecting satisfaction levels
toward the application. Negative themes are grouped into the following
categories: App instability, hope for improvement, navigation issues, and
low-quality content. Some recommendations are offered for the Ministry of
Social Affairs and developers, to overcome negative feedback and enhance
public satisfaction level towards the application.
Keywords:
Aplikasi Cek Bansos
N-grams
Public satisfaction
Sentiment analysis
Supervised machine learning
Thematic analysis
This is an open access article under the CC BY-SA license.
Corresponding Author:
Ilham Zharif Mustaqim
Department of Information Technology, Faculty of Computer Science, University of Indonesia
St. Kenari 2 No.4, RW.5, Kenari, Senen, Jakarta 10430, Indonesia
Email: zharifilham@mail.com
1. INTRODUCTION
The pandemic era of COVID-19 has resulted in the downfall of the economy to the worst situation
since World War II. In Indonesia, 1.1 million people have affected and dragged into poverty, which resulting
nearly 30 million Indonesians was falling into poverty in 2020. Estimated more than 2.1 million people have
been categorized as unemployed due to the laid-off process impact of the pandemic situation until May 2020.
[1]. As an effort to press the poverty rate, the Indonesian government represented by the Ministry of Social
Affairs launched a social protection program called ‘Family Hope Program’ (PKH) which distributes social
assistance in the form of cash assistance to households [2]. It is well knowns as a conditional cash transfer.
The main target of this program is the poorest households both in urban and rural areas [3]. The government
of Indonesia allocated Rp 28.31 trillion for the PKH program in 2021 targeting 10 million households [4].
To promote e-services, the Ministry of Social Affairs, Republic of Indonesia released an application
called ‘Aplikasi Cek Bansos’ in Google Play Store. The application which was launched in Aug 2021, has](https://image.slidesharecdn.com/4223322-241203045610-c8b0873e/85/Assessing-public-satisfaction-of-public-service-application-using-supervised-machine-learning-1-320.jpg)
![IAES International Journal of Artificial Intelligence (IJ-AI)
Vol. 13, No. 2, June 2024, pp. 1608~1618
ISSN: 2252-8938, DOI: 10.11591/ijai.v13.i2.pp1608-1618 1608
Journal homepage: http://ijai.iaescore.com
Assessing public satisfaction of public service application using
supervised machine learning
Ilham Zharif Mustaqim1
, Hasna Melani Puspasari1
, Avita Tri Utami1
,
Rahmad Syalevi1
, Yova Ruldeviyani1,2
1
Department of Information Technology, Faculty of Computer Science, University of Indonesia, Jakarta, Indonesia
2
Department of Computer Science, Faculty of Computer Science, University of Indonesia, Depok, Indonesia
Article Info ABSTRACT
Article history:
Received Apr 6, 2023
Revised Feb 3, 2024
Accepted Feb 15, 2024
The COVID-19 pandemic has enormously affected the economic situation
worldwide, including in Indonesia resulting in 30 million Indonesian
tumbling into penury. The Ministry of Social Affairs initiated a program to
distribute social assistance aimed at the poorest households. ‘Aplikasi Cek
Bansos’ is a public service application that aims to validate their status
towards the social assistance program. Understanding the public sentiment
and factors affecting public satisfaction levels is crucial to be performed.
The goal of this study is to perform a comparative study of supervised
machine learning to learn the sentiment of the public and the dominant
variable resulting in public satisfaction. Support vector machine, Naïve
Bayes dan K-nearest neighbor (KNN) are performed to seek the highest
accuracy. This experiment discovered that the KNN algorithm produced
outstanding performance where the accuracy hit 99.21%. Sentiment
prediction indicated negative perception as the majority covering 83.81%.
Trigrams analysis is performed to learn themes affecting satisfaction levels
toward the application. Negative themes are grouped into the following
categories: App instability, hope for improvement, navigation issues, and
low-quality content. Some recommendations are offered for the Ministry of
Social Affairs and developers, to overcome negative feedback and enhance
public satisfaction level towards the application.
Keywords:
Aplikasi Cek Bansos
N-grams
Public satisfaction
Sentiment analysis
Supervised machine learning
Thematic analysis
This is an open access article under the CC BY-SA license.
Corresponding Author:
Ilham Zharif Mustaqim
Department of Information Technology, Faculty of Computer Science, University of Indonesia
St. Kenari 2 No.4, RW.5, Kenari, Senen, Jakarta 10430, Indonesia
Email: zharifilham@mail.com
1. INTRODUCTION
The pandemic era of COVID-19 has resulted in the downfall of the economy to the worst situation
since World War II. In Indonesia, 1.1 million people have affected and dragged into poverty, which resulting
nearly 30 million Indonesians was falling into poverty in 2020. Estimated more than 2.1 million people have
been categorized as unemployed due to the laid-off process impact of the pandemic situation until May 2020.
[1]. As an effort to press the poverty rate, the Indonesian government represented by the Ministry of Social
Affairs launched a social protection program called ‘Family Hope Program’ (PKH) which distributes social
assistance in the form of cash assistance to households [2]. It is well knowns as a conditional cash transfer.
The main target of this program is the poorest households both in urban and rural areas [3]. The government
of Indonesia allocated Rp 28.31 trillion for the PKH program in 2021 targeting 10 million households [4].
To promote e-services, the Ministry of Social Affairs, Republic of Indonesia released an application
called ‘Aplikasi Cek Bansos’ in Google Play Store. The application which was launched in Aug 2021, has](https://image.slidesharecdn.com/4223322-241203045610-c8b0873e/75/Assessing-public-satisfaction-of-public-service-application-using-supervised-machine-learning-1-2048.jpg)
![Int J Artif Intell ISSN: 2252-8938
Assessing public satisfaction of public service application using supervised … (Ilham Zharif Mustaqim)
1609
been downloaded by more than 5 million users. Aplikasi Cek Bansos is aimed for the Indonesian people to
check their status toward some social assistance programs, to facilitate the public to act as a whistleblower
and provide objection of the recipient who is deemed unqualified to receive the social assistance.
Furthermore, each household could submit their application or their neighbors who are fully qualified to
receive the social assistance programs. To conclude that this is not a mandatory application for each
recipient, but rather accommodating the public to check their eligibility or raise a request as the recipient.
This effort has followed the legal regulation of the Law No. 25 of 2009 on Public Services, article 23 [5]
stating that a national information system needs to be organized to assist information availability. Referring
to another legal baseline as stated in President Regulation No. 95 of 2018 on E-Government System [6], the
necessity of government performance and accountability improvement through the implementation of e-
services to enhance the quality and reliability of public services. Another article stated that the quality of e-
service needs to be improved systematically and continually to increase the efficiency of the e-government
system and enhance the satisfaction of the users, in this case, all Indonesian people.
Referring to the official website of Electronic Procurement Institution (LPSE), the Ministry of
Social Affairs has completed two tender packages related to the procurement and development of PKH
application in 2018 with contact value worth Rp 8.6 billion [7] and in 2020 worth Rp 4 billion [8]. Both
projects consumed Indonesia’s state budget. Indonesia’s state budget is an annual planned budget of the
government of Indonesia which is collected from various sources, and one of the key sources is from taxes
variable [9]. Hence, the utilization of the state budget needs to be efficient and precisely aimed for the benefit
of all Indonesian. Considering an enormous budget required to develop Aplikasi Cek Bansos, it is eminently
essential to examine public opinion toward the application which is funded by Indonesia’s state budget. The
public services through e-government could be strengthened by sentiment analysis, opinion mining, and text
analytics [10].
Sentiment analysis, also known as opinion mining, is widely utilized to understand the semantic
relationship, and meaning in reviews. In regards to customer reviews, it could be constructed by subjective or
objective reviews [11]. In terms of analyzing products, sentiment analysis is commonly performed to
assemble and categorize reactions for improvement as well as grasp public preferences and satisfaction over
products or services. Previous studies have concluded that sentiment analysis is suitable to understand the
satisfaction level of a product [12]–[15]. Reactions of the product indicate whether it is useful or not. The
outcome of sentiment analysis calculation could illustrate the input and criticism provided by the client [16],
[17]. The government has user-generated content to assess the performance of products and services [18].
Various method has been explored to examine and measure satisfaction as a theoretical construct through
various instruments [11], [19]. Sentiment analysis based on machine learning approaches is an achievable
method that provides information about the application’s effectiveness as the negative views from users
could highlight the quality issues and gaps faced by users [20]. This approach is divided into some categories
based on the characteristics of the dataset. When the classification task has a specific set of classes,
supervised learning is most suitable to be performed. Supervised learning has various algorithms, covering
support vector machine (SVM), Naïve Bayes (NB), and K-nearest neighbor (KNN) [11], [19]. However, the
best classifier methods of supervised learning based on user reviews from the online platform are still
arguable.
Previous studies have explored the approaches and challenges of sentiment analysis based on
various machine learning [16], [19], [21] and its implementation across board research areas: in the tourism
context [11], in the medical field for coronary angiography [22], and geography are related to shallow
landslide susceptibility mapping [23]. The data input for the machine learning process could be derived from
various sources: Twitter data [24]–[31], journaling entries [32], movie dataset [33], [34], reviews on various
applications: Traveling application [35] and Shopping application [36], [37], and user’s review on Google
Play Store [21], [38]–[40] and App Store [20]. Machine learning approaches are performed to categorize the
polarity of sentiment based on a train and test dataset. These approaches are classified depending on the
characteristic of the dataset. It could be divided into supervised, unsupervised, semi-supervised, and
reinforcement machine learning. Some algorithms that are classified as supervised machine learning cover
SVM, NB, and KNN [19]. Some conducted studies concluded that SVM performed superior accuracy
compared to other classifier methods [21], [24], [25], [33]. While other studies summarize that Naïve Bayes
provided better results illustrated by the highest value on the accuracy variable [38], [40]. On the other hand,
various experiments summarized that KNN has the highest accuracy compared to other supervised machine
learning algorithms [16], [41]–[43]. To assess the most suitable method to be performed using user review on
online platforms as data, a comparative study is performed using those three methods covering SVM, NB,
and KNN.
Nowell et al. [44] summarized a pragmatic approach to perform a trustworthy thematic analysis to
systematize and improve the traceability and verification of the analysis. One of the most used methods is N-
gram which is performed respectively with machine learning algorithms [18], [45]. Zhang et al. [45]](https://image.slidesharecdn.com/4223322-241203045610-c8b0873e/85/Assessing-public-satisfaction-of-public-service-application-using-supervised-machine-learning-2-320.jpg)
![ ISSN: 2252-8938
Int J Artif Intell, Vol. 13, No. 2, June 2024: 1608-1618
1610
performed term frequency-inverse document frequency (TF-IDF) and N-gram to classify the ransomware
families as well as employed five machine learning methods to execute ransom classification. Summarizing
the previous works, TF-IDF and N-gram are implemented in this experiment to extract word frequency and
identify the features that influence user experience. Thematic analysis by categorizing the reviews into
various categories conducted by [20], [46] is utilized as a baseline for this research.
Furthermore, the application rating on Google Play Store only earned 2.3 stars rating whereas the
‘1’ rating is dominantly submitted by the users. In total, more than 39 thousand reviews have been posted
[47]. The star rating is strongly impacted by the consolidated sentiment and emotion in the review [48]. The
assumption of star ratings summarizes the customer’s opinion as stated in the content of the review is
debatable. Nevertheless, the limitation of a discrete 5-point scale of star rating is insufficient to grasp the vast
opinion contained in the reviews [49]. The public typically shows their emotions and experiences towards the
product acquired or services received through online opinion in the form of text comments [48]. Hence, it is
essential to perform qualitative methods to understand thoroughly the opinion mentioned by users toward the
application. Thematic analysis is a suitable qualitative method that can be performed to analyze bulk
qualitative data sets. It is used to identify, analyze, organize, describe, and report themes found within a data
set. The main benefit of thematic analysis is a greatly adaptable method that could be adjusted and
implemented in a broad variety of fields, resulting in a robust and thorough outcome, yet high complex
account of data [44]. This leads us to our research questions:
RQ1: How is the public’s sentiment of the Aplikasi Cek Bansos using the best performing
supervised machine learning?
RQ2: What are the dominant variables affecting the public’s satisfaction/dissatisfaction toward
Aplikasi Cek Bansos?
This study aims to perform a comparative analysis of various supervised machine learning
algorithms based on user reviews on Google Play Store, to evaluate the public’s sentiment and opinion
towards the e-government platform: Aplikasi Cek Bansos, and to discover the major satisfaction or
dissatisfaction factors influencing the overall rating. The main novelty of this work is assessing the
performance of supervised machine learning algorithms on user review datasets. In addition, the public
sentiment, and the thematic analysis of Aplikasi Cek Bansos have not been explored before. In the last
section, some recommendations are provided for the organization to enhance the user journey on the public
services application. Hence, this work can contribute as a baseline for the Ministry of Social Affairs,
Republic of Indonesia to improve its e-government products and services which will strengthen public trust
in the government.
2. METHOD
Cutting-edge computational processes and techniques are employed to achieve the main objective of
this paper. The data is collected from the Google Play store, then annotated into positive and negative labels.
It is followed by preprocessing phase and vectorization step to building the model, then it is applied to all
data to obtain the overall sentiment and thematic results.
2.1. Data collection
User’s review of Aplikasi Cek Bansos on Google Play Store is used as raw data. Web scraping
method is used to extract data from websites [19]. The data contains both reviews and ratings from all users
gathered using Google Play Reviews Scraper on Python. The data was crawled on January 3rd
, 2023, at 3:00
PM and it contains 28,584 reviews with ratings.
2.2. Data annotation
The next step is to create a training dataset through a random sampling method following Slovin’s
formula. By using error 5%, 380 random reviews are categorized as training data. Supervised machine
learning technique requires a model data called training data which assigns the polarity of data based on the
context of the sentences. Data annotation can be based on manual labeling [11], [38], or based on the given
rating [20]. Table 1 demonstrated the sample of manual labeling applied for some reviews in this paper.
The polarity of sentences can be based on the rating as the rating provides insight into the overall
polarity of a review whether the user feels very satisfied or even on the opposite side, very dissatisfied. A
numeric rating is sufficiently used to extract sentiment scores as an exchange of human judgment to eliminate
human subjectivity [18]. Reviews with a rating of ‘3’ are excluded as it does not provide the polarity
explicitness of whether it falls under positive or negative sides. Data labeling rules are described in Table 2.
Both manual annotation and rating based are performed in this experiment to reveal the impact of both
approaches.](https://image.slidesharecdn.com/4223322-241203045610-c8b0873e/85/Assessing-public-satisfaction-of-public-service-application-using-supervised-machine-learning-3-320.jpg)
![Int J Artif Intell ISSN: 2252-8938
Assessing public satisfaction of public service application using supervised … (Ilham Zharif Mustaqim)
1611
Table 1. Instance of manual data labelling
Comment Label
Initially, I didn't know I would receive the BLT (cash assistance), but after watching a tutorial, I
succeeded. The process only took 2 days. Thank you, Mr. Jokowi.
Positive
Easy to use and has accurate result Positive
The application is very bad. My account is already registered, but when I try to open it, it hasn't
been activated yet, and it shows an error message saying that I'm not registered.
Negative
I have already updated to the latest version, but the application still cannot be opened. I only
need to verify through this application (I have received two emails from the Ministry of Social
Affairs for verification). Every time I log into the application, there is always an error message:
JSON PARSE ERROR. Please fix it!"
Negative
Table 2. Data labelling rules
Rating Description Sentiment polarity
1 Very dissatisfied Negative
2 Dissatisfied Negative
3 Okay Not used
4 Satisfied Positive
5 Very satisfied Positive
2.3. Data preprocessing
Data preprocessing necessities to be performed before any analysis process to eliminate any type of
noise and all errors in terms of spelling and grammar. The goal of preprocessing includes obtaining better
analysis as well as degrading the dimensionality of input data as many words are inefficacious and need to be
removed as they do not affect the text polarity [19]. Data preprocessing consists of some tasks as illustrated
in Figure 1 and described below,
a. Case folding: This step standardizes all letters into lowercase to provide a simpler classification of the
sentiment and accelerate the comparisons during the indexing process [25], [33], [38].
b. Tokenization: This process divides the script into pieces of elements which are called tokens [19], [38].
c. Stemming: This task enables all words to be converted into a base form to lessen the total words and
improve the computational speed [19], [25].
d. Stopword Removal: The goal is to eliminate the stop word as it does not have any contribution to
analysis and to be focused on words that are used for sentiment analysis [19], [25]. The stop words are
applicable for adverbs, conjunction, prepositions [33], or any word that is considered an obstacle or noise
to fully understand the context [38].
Figure 1. The steps of data pre-processing [51]
2.4. Data vectorization
Next, each review is extracted into unigrams and vectorized by using term frequency-inverse
document frequency (TF-IDF) method. It is aimed to count both frequency and relevance when assigning
weight to terms or words [20]. TF-IDF is implemented as it demonstrated a promising performance for
automated text analysis which covers text classification on sentiment analysis [51]. The process is performed
in RapidMiner tools.
2.5. Sentiment classification
Supervised machine learning models are executed to classify each user reviews into either positive
or negative sentiment polarity. Three promising classifiers are performed covering NB, SVM, and KNN,
which are categorized as supervised machine learning in RapidMiner tools. The evaluation of classification
algorithms, in terms of performance, is commonly assessed through k-fold cross-validation. Some research
proposes to perform k-fold cross-validation repeatedly to result in reliable accuracy estimates. A procedure to
apply k-fold cross-validation follows the guideline: 10-fold cross-validation is executed first and if the testing](https://image.slidesharecdn.com/4223322-241203045610-c8b0873e/85/Assessing-public-satisfaction-of-public-service-application-using-supervised-machine-learning-4-320.jpg)
![ ISSN: 2252-8938
Int J Artif Intell, Vol. 13, No. 2, June 2024: 1608-1618
1612
result of every fold could satisfy the large-sample condition, then it should be executed only once [52]. The
performance of three classifiers is compared using four variables: accuracy, precision, recall, and F1 score.
2.6. Thematic analysis
Thematic analysis is performed to identify the vibrant factors affecting the public’s satisfaction and
dissatisfaction with the application based on both positive and negative reviews [20]. The N-gram method is
used as it has the ability to forecast the occurrence of phenomena. The length of N-grams varies with the
number of feature N-grams [45]. It needs to be acknowledged that bigram refers to n-gram of size 2 and
trigram of size 3 [18]. N-grams (N = 3) are executed in this experiment by using the Natural Language
Toolkit (NLTK) package on Python to gain more insight into the features affecting user experiences of the
application.
3. RESULTS AND DISCUSSION
3.1. Sentiment classifiers performance
A comparative study has been performed to evaluate the best-performing classifier methods under a
supervised learning machine. It can be determined by comparing the accuracy value. Accuracy is used as the
indicator as it is one of the comprehensive evaluation variables of the classifier [45]. As shown in Table 3,
the KNN method with rating based labeled achieved the best overall accuracy of 99.21%, followed by the
KNN algorithm with manual labeling with an accuracy of 94.21%. The second-best performing algorithm is
the SVM method with an accuracy level reached 90.26% by using training data following rating rules. In
contrast, Naïve Bayes approaches performed well with manual annotation of training data with an accuracy
of 87.89%, while rating-based data only produced 77.63% of accuracy rate. In terms of precision, recall, and
F1-score, the KNN algorithm produced a satisfied outcome specifically when utilizing rating based on the
training dataset with 99.55%, 97.22%, and 98.37% respectively.
Table 3. Classifier performance by data annotation
Classifier Data annotation Accuracy (%) Precision (%) Recall (%) F1-score (%)
NB Manual 87.89 65.03 73.62 69.06
Rating 77.63 61.31 66.11 63.61
SVM Manual 83.16 65.96 90.86 76.43
Rating 90.26 79.67 94.33 86.38
KNN Manual 94.21 78.95 90.77 84.45
Rating 99.21 99.55 97.22 98.37
Three classifiers used in this experiment are categorized as machine learning techniques. Sentiment
analysis works based on the modeled data and produces a classified class including positive or negative
classes. Training data is essential as the model learns to perform comparative tasks of specific input data to
respective output data based on test instances utilized for the training process [16]. Hence, the data annotation
approach is highly impactful toward the performance of the classifier method. Referring to Table 3, manual
labeling works better with the NB method while SVM and KNN produced high-grade performance which is
reflected by its accuracy and F1-score.
The KNN algorithm was raised as the best-performing classifier method under supervised machine
learning. This is caused due to its easiness to understand and implementation as well as its powerful method
which results in better accuracy [16]. This finding supports prior experiments that the KNN algorithm
performs better towards data from social media [16], [42], but it is also applicable for data fetched from a
user review on the online platform, in this case, Google Play Store.
3.2. Sentiment prediction
Next, the best-performing machine learning classifier (i.e., KNN) was applied to classify all user
reviews of the application covering 28,584 reviews. Referring to the predicted outcome, 23,955 reviews were
classified as negative, while only 4,629 reviews were categorized as positive. The dominant sentiment is
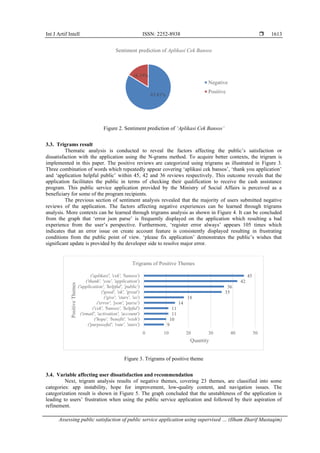
negative, covering 83.81% of overall reviews as shown in Figure 2. As concluded by previous papers that
sentiment polarity represents customer satisfaction [12]–[15]. Hence, it implies that most of the public feels
displeased with this e-government application. Due to the high percentage of dissatisfaction level from the
user’s perspective, it is crucial to understand the factors behind this number.](https://image.slidesharecdn.com/4223322-241203045610-c8b0873e/85/Assessing-public-satisfaction-of-public-service-application-using-supervised-machine-learning-5-320.jpg)
![ ISSN: 2252-8938
Int J Artif Intell, Vol. 13, No. 2, June 2024: 1608-1618
1614
Figure 4. Trigrams of negative theme
Figure 5. Category of negative theme and the corresponding number of negative theme
3.4.1. App instability
The chart illustrates that app instability issue is dominantly complained about by the users, reaching
40% of overall reviews. App instability reflects the poor rate of system quality. System quality, in terms of
mobile application adoption, encompasses some items, covering stability, reliability, response time, and
appropriate and accurate functions [53]. The absence of stability and reliability of the application, in the form
of errors and bugs, is negatively affecting users’ perception of the system, information, and services, as
shown in the comments below,
“Mau daftar aja susah banget keterangan ERROR JSON PARSE, padahal sinyal kuat pakai WiFi dan data,
gini amat pemerintah buat aplikasi.”
When the application has been released to the production environment, it should have been free of
blockers and crashes. A thorough testing activity has to be performed for all scenarios across targeted mobile
platforms, device types, and screen sizes [20]. Hence, the developer's team needs to execute bug fixes, fully
retest the app, and deploy a new version of the app including all fixes of the issues. Furthermore, a user-
friendly error modal needs to be implemented to provide clarity for the user of the error and increase the
user’s perception.
3.4.2. Hope for improvement
The second most mentioned category is hope for improvement. It reflects the user’s frustration
caused by app instability and their wishes that it can be resolved immediately. As shown in the sample
comment below, the user highlighted the issue they faced and their hope for fixes to be provided.
“Agak kecewa sih aplikasi nya bisa dibilang gak stabil, apalagi pas mau login tuh ada aja kendalanya, entah
itu koneksi sinyalnya, ataupun json parse, minimal kasih panduan lah buat mengatasi itu. Mohon cepat
diperbaiki sihh.”
57
78
81
84
88
89
105
119
132
161
0 50 100 150 200
('login', 'user', 'name')
('daftar', 'login', 'aplikasi')
('username', 'password',…
('login', 'username', 'ditemukan')
('niat', 'bikin', 'aplikasi')
('tolong', 'perbaiki', 'aplikasi')
('daftar', 'eror', 'mulu')
('login', 'username', 'password')
('aplikasi', 'cek', 'bansos')
('error', 'json', 'parse')
Trigrams of negative theme
40%
27%
16%
17%
Categorization of Negative Themes
App Instability
Hope for improvement
Low-quality content
Navigation issues](https://image.slidesharecdn.com/4223322-241203045610-c8b0873e/85/Assessing-public-satisfaction-of-public-service-application-using-supervised-machine-learning-7-320.jpg)
![Int J Artif Intell ISSN: 2252-8938
Assessing public satisfaction of public service application using supervised … (Ilham Zharif Mustaqim)
1615
App developers should actively review the negative feedback and respond politely to ease
customers’ rage and dissatisfaction [54]. All valid negative reviews should be consolidated and retrospect
whether they can be resolved in the next fetch version or not. A new version of the app should be in place
regularly to accommodate all the public’s feedback to increase public satisfaction.
3.4.3. Low-quality content
The next category is low-quality content. Users regularly stated their inconvenience over impractical
content and off-topic through application reviews. Those invalid contents resulted in frustration feeling from
the user’s perspective as it was considered unhelpful toward the issue faced on the application, as indicated in
the sample comment below.
“Padahal udah isi data lengkap dan jelas loh. Waktu aplikasi ini di publis ke masyarakat, kayaknya
gampang banget tuh mbaknya jelasin detail aplikasi ini melalui video.”
This application is used by the poorest household in Indonesia. The preceding study found out some
barriers to technology adoption in Indonesia are awareness, information communication technology (ICT)
skills, and lack of relevant content [55] which also aligns with the current finding. Hence, developers should
provide high-quality and accurate content which elaborates guidance on application usage and how to operate
it clearly considering its targeted audience.
3.4.4. Navigation issue
The last category is navigation issues. The ease of use variable is highly affected by navigation
controls [20]. Perceived ease of use indicates the level of simplicity expected from new technology to be used
with minimal effort [53]. Some comments of aplikasi cek bansos reveal the uneasiness of navigating desired
features, unresponsive navigation control, or even being stuck in error conditions without any proper
suggested navigation to overcome the issue, as illustrated in the sample comment below.
“Aplikasi error silakan hubungi admin, cara hubungi admin nya gimana ya?”
There are three fundamental dimensions of the mobile experience, covering attractive interface, easy
to navigate, and interest arousing. Easy navigation indicates a straightforward navigation mechanism that
enables the user to navigate easily across the application [56]. Similarly, in terms of error, the app should
navigate the user to an accurate screen where the issue can be resolved.
An antecedent study found a positive correlation between information system quality towards user
satisfaction and user acceptance. Users’ perception of the system, information, and services is highly crucial
as it influences perceived usefulness. In addition, perceived usefulness is favorably influenced by trust. Trust
is positively affected by the perceived easiness of use as it can result in a positive impression towards e-
government [53]. Hence, it is intensely crucial to increase the information system quality of Aplikasi Cek
Bansos for improving user satisfaction and resulting in an appreciative impression of e-government
implementation in Indonesia.
4. CONCLUSION
A comparative study of supervised machine learning performed in this experiment found that KNN
is the best-performing classifier by using user’s review data which was indicated by its accuracy of 99.21%
and F1-Score of 98.37%. Then, the classifier was used to predict the sentiment of Aplikasi Cek Bansos. The
outcome showed that the foremost sentiment was classified as negative, covering 83.81% of overall reviews.
Afterward, thematic analysis was conducted to uncover variables affecting dissatisfaction with the
application. All negative topics are then classed into categories: App instability, hope for improvement,
navigation issues, and low-quality content. By referring to the preceding research, we recommended some
actions that can be adopted by the corresponding party to tackle the negative feedback and strengthen the
information system quality which leads to public satisfaction improvement.
ACKNOWLEDGEMENTS
The research was funded by the Lembaga Pengelola Dana Pendidikan or Indonesia Endowment
Fund for Education (LPDP) from the Ministry of Finance, Republic of Indonesia.](https://image.slidesharecdn.com/4223322-241203045610-c8b0873e/85/Assessing-public-satisfaction-of-public-service-application-using-supervised-machine-learning-8-320.jpg)
![ ISSN: 2252-8938
Int J Artif Intell, Vol. 13, No. 2, June 2024: 1608-1618
1616
REFERENCES
[1] L. Yan Ing and Y. Vadila, “Implementing Indonesia’s COVID-19 stimulus,” East Asia Forum Quarterly. Accessed: Dec. 27,
2022. [Online]. Available: https://eastasiaforum.org/2020/06/17/implementing-indonesias-covid-19-stimulus/
[2] I. S. Fitrinitia and M. Matsuyuki, “Social protection for climate-disasters: A case study of the program Keluarga Harapan cash
transfer program for smallholder farm household in Indonesia,” Progress in Disaster Science, vol. 17, no. February, p. 100278,
2023, doi: 10.1016/j.pdisas.2023.100278.
[3] H. H. Setiawan, M. Nuryana, B. Susantyo, A. B. Purwanto, M. B. Sulubere, and Delfirman, “Social entrepreneurship for
beneficiaries of the Program Keluarga Harapan (PKH) toward sustainable development,” IOP Conference Series: Earth and
Environmental Science, vol. 739, no. 1, pp. 1–10, 2021, doi: 10.1088/1755-1315/739/1/012053.
[4] Secretariat of the Cabinet of the Republic of Indonesia, “The support from the State Budget (APBN) amounts to Rp. 18.784
trillion (in Indonesia: Dukungan APBN Capai Rp187.84 Triliun, inilah rincian program perlindungan sosial bagi masyarakat).”
Accessed: Dec. 28, 2022. [Online]. Available: https://setkab.go.id/dukungan-apbn-capai-rp18784-triliun-inilah-rincian-program-
perlindungan-sosial-bagi-masyarakat/
[5] President of the Republic of Indonesia, Republic of Indonesia law number 25 of 2009 concerning public services. Indonesia,
2009.
[6] Presiden Republik Indonesia, Peraturan Presiden No. 95 Tahun 2018 tentang Sistem E-Government. Republic of Indonesia, 2018.
[7] Ministry of Social Affairs of the Republic of Indonesia, “LPSE - Application development of SIM PKH.” Accessed: Dec. 29,
2022. [Online]. Available: https://www.lpse.kemenkeu.go.id/eproc4/lelang/23698011/pengumumanlelang
[8] Ministry of Social Affairs of the Republic of Indonesia, “LPSE - Application development of SIM e-PKH.” Accessed: Dec. 29,
2022. [Online]. Available: https://www.lpse.kemenkeu.go.id/eproc4/lelang/30546011/pengumumanlelang
[9] President of Republic of Indonesia, Republic of Indonesia law number 28 of 2022 concerning the state revenue and expenditure
budget for the fiscal year 2023. Indonesia, 2022.
[10] S. Verma, “Sentiment analysis of public services for smart society: Literature review and future research directions,” Government
Information Quarterly, vol. 39, no. 3, p. 101708, 2022, doi: 10.1016/j.giq.2022.101708.
[11] A. R. Alaei, S. Becken, and B. Stantic, “Sentiment analysis in tourism: capitalizing on big data,” Journal of Travel Research,
vol. 58, no. 2, pp. 175–191, Feb. 2019, doi: 10.1177/0047287517747753.
[12] H. A. Bin Madhi and M. M. Alhammah, “What drives Airbnb customers’ satisfaction in Amsterdam? a sentiment analysis,”
International Journal of Advanced Computer Science and Applications, vol. 12, no. 6, pp. 255–263, 2021, doi:
10.14569/IJACSA.2021.0120628.
[13] H. Wisnu, M. Afif, and Y. Ruldevyani, “Sentiment analysis on customer satisfaction of digital payment in Indonesia: A
comparative study using KNN and Naïve Bayes,” Journal of Physics: Conference Series, vol. 1444, no. 1, pp. 1–11, 2020, doi:
10.1088/1742-6596/1444/1/012034.
[14] S. Al-Otaibi et al., “Customer satisfaction measurement using sentiment analysis,” International Journal of Advanced Computer
Science and Applications, vol. 9, no. 2, pp. 106–117, 2018, doi: 10.14569/IJACSA.2018.090216.
[15] B. Andrian, T. Simanungkalit, I. Budi, and A. F. Wicaksono, “Sentiment analysis on customer satisfaction of digital banking in
Indonesia,” International Journal of Advanced Computer Science and Applications, vol. 13, no. 3, pp. 466–473, 2022, doi:
10.14569/IJACSA.2022.0130356.
[16] P. Sudhir and V. D. Suresh, “Comparative study of various approaches, applications and classifiers for sentiment analysis,”
Global Transitions Proceedings, vol. 2, no. 2, pp. 205–211, 2021, doi: 10.1016/j.gltp.2021.08.004.
[17] Q. Yang, B. Zhu, H. Liao, and X. Wu, “Learning consumer preferences from online textual reviews and ratings based on the
aggregation-disaggregation paradigm with attitudinal Choquet integral,” Economic Research-Ekonomska Istraživanja, vol. 0,
no. 0, pp. 1–28, 2022, doi: 10.1080/1331677X.2022.2106282.
[18] A. Dey, M. Jenamani, and J. J. Thakkar, “Senti-N-Gram: An n-gram lexicon for sentiment analysis,” Expert Systems with
Applications, vol. 103, pp. 92–105, 2018, doi: 10.1016/j.eswa.2018.03.004.
[19] M. Birjali, M. Kasri, and A. Beni-Hssane, “A comprehensive survey on sentiment analysis: Approaches, challenges and trends,”
Knowledge-Based Systems, vol. 226, p. 107134, 2021, doi: 10.1016/j.knosys.2021.107134.
[20] O. Oyebode, F. Alqahtani, and R. Orji, “Using machine learning and thematic analysis methods to evaluate mental health apps
based on user reviews,” IEEE Access, vol. 8, pp. 111141–111158, 2020, doi: 10.1109/ACCESS.2020.3002176.
[21] I. Firmansyah, M. H. Asnawi, S. A. Hasanah, R. Novian, and A. A. Pravitasari, “A comparison of support vector machine and
naïve bayes classifier in binary sentiment reviews for PeduliLindungi application,” in 2021 International Conference on Artificial
Intelligence and Big Data Analytics, IEEE, Oct. 2021, pp. 140–145. doi: 10.1109/ICAIBDA53487.2021.9689771.
[22] P. Golpour et al., “Comparison of support vector machine, naïve bayes and logistic regression for assessing the necessity for
coronary angiography,” International Journal of Environmental Research and Public Health, vol. 17, no. 18, pp. 1–9, 2020, doi:
10.3390/ijerph17186449.
[23] V. H. Nhu et al., “Shallow landslide susceptibility mapping: A comparison between logistic model tree, logistic regression, naïve
bayes tree, artificial neural network, and support vector machine algorithms,” International Journal of Environmental Research
and Public Health, vol. 17, no. 8, 2020, doi: 10.3390/ijerph17082749.
[24] R. Kusumawati, A. D’arofah, and P. A. Pramana, “Comparison performance of Naive Bayes classifier and support vector machine
algorithm for Twitter’s classification of Tokopedia services,” Journal of Physics: Conference Series, vol. 1320, no. 1, p. 012016,
Oct. 2019, doi: 10.1088/1742-6596/1320/1/012016.
[25] S. Pradha, M. N. Halgamuge, and N. Tran Quoc Vinh, “Effective text data preprocessing technique for sentiment analysis in
social media data,” Proceedings of 2019 11th International Conference on Knowledge and Systems Engineering, KSE 2019, 2019,
doi: 10.1109/KSE.2019.8919368.
[26] D. Renuka Devi and S. Sasikala, “Ensemble incremental deep multiple layer perceptron model – sentiment analysis application,”
International Journal of Web Information Systems, vol. 17, no. 6, pp. 714–727, 2021, doi: 10.1108/IJWIS-05-2021-0056.
[27] M. Etter, E. Colleoni, L. Illia, K. Meggiorin, and A. D’Eugenio, “Measuring organizational legitimacy in social media: assessing
citizens’ judgments with sentiment analysis,” Business & Society, vol. 57, no. 1, pp. 60–97, Jan. 2018, doi:
10.1177/0007650316683926.
[28] I. K. A. Aryadinata, D. Pangesti, G. B. Anugerah, I. E. Aditya, and Y. Ruldeviyani, “Sentiment analysis of 5G network
implementation in Indonesia using Twitter data,” in 2021 6th International Workshop on Big Data and Information Security
(IWBIS), IEEE, Oct. 2021, pp. 23–28. doi: 10.1109/IWBIS53353.2021.9631863.
[29] H. M. Puspasari and P. Subarkah, “Sentiment analysis for opinions on the Covid-19 vaccination program using a Naive Bayes
classifier,” Jurnal Borneo Administrator, vol. 18, no. 3, pp. 213–230, Nov. 2022, doi: 10.24258/jba.v18i3.992.](https://image.slidesharecdn.com/4223322-241203045610-c8b0873e/85/Assessing-public-satisfaction-of-public-service-application-using-supervised-machine-learning-9-320.jpg)
![Int J Artif Intell ISSN: 2252-8938
Assessing public satisfaction of public service application using supervised … (Ilham Zharif Mustaqim)
1617
[30] A. Mee, E. Homapour, F. Chiclana, and O. Engel, “Sentiment analysis using TF–IDF weighting of UK MPs’ tweets on
Brexit[Formula presented],” Knowledge-Based Systems, vol. 228, p. 107238, 2021, doi: 10.1016/j.knosys.2021.107238.
[31] T. H. J. Hidayat, Y. Ruldeviyani, A. R. Aditama, G. R. Madya, A. W. Nugraha, and M. W. Adisaputra, “Sentiment analysis of
twitter data related to Rinca Island development using Doc2Vec and SVM and logistic regression as classifier,” Procedia
Computer Science, vol. 197, no. 2021, pp. 660–667, 2021, doi: 10.1016/j.procs.2021.12.187.
[32] A. Oduntan, O. Oyebode, A. H. Beltran, J. Fowles, D. Steeves, and R. Orji, “‘I let depression and anxiety drown Me…’:
Identifying factors associated with resilience based on journaling using machine learning and thematic analysis,” IEEE Journal of
Biomedical and Health Informatics, vol. 26, no. 7, pp. 3397–3408, Jul. 2022, doi: 10.1109/JBHI.2022.3149862.
[33] S. Datta and S. Chakrabarti, “Evaluation of deep learning approaches for aspect based sentiment analysis on movie dataset,” in
2022 4th International Conference on Smart Systems and Inventive Technology (ICSSIT), IEEE, Jan. 2022, pp. 925–934. doi:
10.1109/ICSSIT53264.2022.9716297.
[34] N. S. Mohd Nafis and S. Awang, “An enhanced hybrid feature selection technique using term frequency-inverse document
frequency and support vector machine-recursive feature elimination for sentiment classification,” IEEE Access, vol. 9, no. Ml,
pp. 52177–52192, 2021, doi: 10.1109/ACCESS.2021.3069001.
[35] F. Mehraliyev, I. C. C. Chan, and A. P. Kirilenko, “Sentiment analysis in hospitality and tourism: a thematic and methodological
review,” International Journal of Contemporary Hospitality Management, vol. 34, no. 1, pp. 46–77, 2022, doi: 10.1108/IJCHM-
02-2021-0132.
[36] S. Kumar, A. Jain, T. Ichikawa, Y. Kojima, and G. K. Dey, “Development of vanadium based hydrogen storage material: A
review,” Renewable and Sustainable Energy Reviews, vol. 72, no. November 2016, pp. 791–800, 2017, doi:
10.1016/j.rser.2017.01.063.
[37] R. Meifitrah, I. Darmawan, and O. Nurul Pratiwi, “Sentiment analysis of Tokopedia application review to service product
recommender system using neural collaborative filtering for marketplace in Indonesia,” IOP Conference Series: Materials
Science and Engineering, vol. 909, no. 1, pp. 1–10, 2020, doi: 10.1088/1757-899X/909/1/012071.
[38] S. Amrie, S. Kurniawan, J. H. Windiatmaja, and Y. Ruldeviyani, “Analysis of Google Play Store’s sentiment review on
Indonesia’s P2P fintech platform,” 2022 IEEE Delhi Section Conference, DELCON 2022, no. March 2020, pp. 1–5, 2022, doi:
10.1109/DELCON54057.2022.9753108.
[39] A. Mustopa, Hermanto, Anna, E. B. Pratama, A. Hendini, and D. Risdiansyah, “Analysis of user reviews for the PeduliLindungi
application on Google Play using the support vector machine and Naive Bayes algorithm based on particle swarm optimization,”
in 2020 Fifth International Conference on Informatics and Computing (ICIC), IEEE, Nov. 2020, pp. 1–7. doi:
10.1109/ICIC50835.2020.9288655.
[40] A. Fatihin, D. Khairani, Zulkifli, S. U. U. Masruroh, and Y. Durachman, “Public sentiment on user reviews about application in
handling COVID-19 using Naive Bayes method and support vector machine,” in 2022 International Conference on Science and
Technology (ICOSTECH), IEEE, Feb. 2022, pp. 1–5. doi: 10.1109/ICOSTECH54296.2022.9829068.
[41] M. I. Ramadhon, A. Arini, F. Mintarsih, and I. M. M. Matin, “N-gram and K-nearest neighbor algorithm for sentiment analysis on
capital relocation,” 2021 9th International Conference on Cyber and IT Service Management, CITSM 2021, 2021, doi:
10.1109/CITSM52892.2021.9587919.
[42] A. R. Atmadja, W. Uriawan, F. Pritisen, D. S. Maylawati, and A. Arbain, “Comparison of Naive Bayes and K-nearest neighbours
for online transportation using sentiment analysis in social media,” Journal of Physics: Conference Series, vol. 1402, no. 7,
pp. 1–7, 2019, doi: 10.1088/1742-6596/1402/7/077029.
[43] T. P. Sahu and S. Ahuja, “Sentiment analysis of movie reviews: A study on feature selection & classification algorithms,” in
2016 International Conference on Microelectronics, Computing and Communications (MicroCom), IEEE, Jan. 2016, pp. 1–6. doi:
10.1109/MicroCom.2016.7522583.
[44] L. S. Nowell, J. M. Norris, D. E. White, and N. J. Moules, “Thematic analysis: striving to meet the trustworthiness criteria,”
International Journal of Qualitative Methods, vol. 16, no. 1, pp. 1–13, Dec. 2017, doi: 10.1177/1609406917733847.
[45] H. Zhang, X. Xiao, F. Mercaldo, S. Ni, F. Martinelli, and A. K. Sangaiah, “Classification of ransomware families with machine
learning based on N-gram of opcodes,” Future Generation Computer Systems, vol. 90, pp. 211–221, 2019, doi:
10.1016/j.future.2018.07.052.
[46] J. Y. E. Park, J. Li, A. Howren, N. W. Tsao, and M. De Vera, “Mobile phone apps targeting medication adherence: quality
assessment and content analysis of user reviews,” JMIR mHealth and uHealth, vol. 7, no. 1, p. e11919, Jan. 2019, doi:
10.2196/11919.
[47] Kementrian Sosial Republik Indonesia, “Aplikasi cek bansos.” Accessed: Dec. 28, 2022. [Online]. Available:
https://play.google.com/store/apps/details?id=id.go.kemensos.pelaporan&hl=id&gl=US
[48] A. Z. Ahmed and M. R. Díaz, “A methodology for machine-learning content analysis to define the key labels in the titles of online
customer reviews with the rating evaluation,” Sustainability, vol. 14, no. 15, p. 9183, Jul. 2022, doi: 10.3390/su14159183.
[49] S. Dhar and I. Bose, “Walking on air or hopping mad? Understanding the impact of emotions, sentiments and reactions on ratings
in online customer reviews of mobile apps,” Decision Support Systems, vol. 162, no. June 2021, p. 113769, Nov. 2022, doi:
10.1016/j.dss.2022.113769.
[50] E. H. Muktafin, P. Pramono, and K. Kusrini, “Sentiments analysis of customer satisfaction in public services using K-nearest
neighbors algorithm and natural language processing approach,” TELKOMNIKA (Telecommunication Computing Electronics and
Control), vol. 19, no. 1, p. 146, Feb. 2021, doi: 10.12928/telkomnika.v19i1.17417.
[51] R. K. Dey and A. K. Das, “Modified term frequency-inverse document frequency based deep hybrid framework for sentiment
analysis,” Multimedia Tools and Applications, 2023, doi: 10.1007/s11042-023-14653-1.
[52] T. T. Wong and P. Y. Yeh, “Reliable accuracy estimates from k-Fold cross validation,” IEEE Transactions on Knowledge and
Data Engineering, vol. 32, no. 8, pp. 1586–1594, 2020, doi: 10.1109/TKDE.2019.2912815.
[53] N. Hajiheydari and M. Ashkani, “Mobile application user behavior in the developing countries: A survey in Iran,” Information
Systems, vol. 77, pp. 22–33, 2018, doi: 10.1016/j.is.2018.05.004.
[54] K. Srisopha, D. Link, and B. Boehm, “How should developers respond to app reviews? features predicting the success of
developer responses,” ACM International Conference Proceeding Series, pp. 119–128, 2021, doi: 10.1145/3463274.3463311.
[55] K. Ariansyah, “The importance of the internet on improving economic welfare: an empirical evidence from Indonesian rural
household,” in 2018 International Conference on ICT for Rural Development (IC-ICTRuDev), IEEE, Oct. 2018, pp. 118–123. doi:
10.1109/ICICTR.2018.8706868.
[56] K. L. Norman and J. Kirakowski, The Wiley handbook of human computer interaction, Volume 1. Wiley & Sons Ltd, 2018.](https://image.slidesharecdn.com/4223322-241203045610-c8b0873e/85/Assessing-public-satisfaction-of-public-service-application-using-supervised-machine-learning-10-320.jpg)