The document contains charts and graphs showing housing market trends from 2003-2011. It shows that over this period:
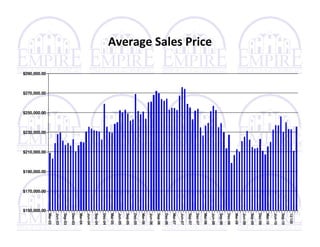
- Average and median home sales prices fluctuated but generally trended upward, with the average price rising 6.7% and median up 2.8% from 2010 to 2011 YTD.
- Home sales, inventory levels, and new listings all increased from 2010 to 2011 YTD, with units sold up 12.4% and inventory up 11.3%.
- Foreclosures as a percentage of total sales declined slightly from 2010 to 2011 YTD, down 5.7%.
10. Feb-11
Dec-10
Oct-10
Aug-10
Jun-10
Inventory in Number of Months
Apr-10
Feb-10
Dec-09
Oct-09
Aug-09
Jun-09
Apr-09
Feb-09
Dec-08
Oct-08
Aug-08
Jun-08
Apr 2008
Feb 2008
Dec 2007
Oc 2007
Aug 2007
Jun 2007
Apr 2007
Mar 2006
Mar 2004
Mar 2002
Mar 2000
9.0
8.0
7.0
6.0
5.0
4.0
3.0
2.0
1.0
0.0
Number of Months
13. Freddie Mac 30 Fixed Rate Mortgage
20.0
18.0
16.0
14.0
Percentage Rate
12.0
10.0
8.0
6.0
4.0
Jan - 1971 Jan – 2011
14. Percent of Sales by Price
Year to Date 2011
$250,000 and Greater
26.4%
$249,000 or Less
73.6%
15. Percent of Sales from
$140,000 - $399,999
Year to Date 2011
$300,000 - $399,999
$140,000 - $159,999
14.2%
17.6%
$250,000 - $299,999
16.4%
$160,000 - $179,999
16.4%
$180,000 - $199,999
$200,000 - $249,999 12.2%
23.2%
16. 2011 YTD vs. 2010 YTD
• Average Price 6.7%
• Median Price 2.8%
• Residential Units Sold 12.4%
• Inventory Levels 11.3%
• Number of Listings 1.9%
• Foreclosures 5.7%
• Interest Rates are at historic lows