The International Journal of Engineering and Science (The IJES)theijes
The International Journal of Engineering & Science is aimed at providing a platform for researchers, engineers, scientists, or educators to publish their original research results, to exchange new ideas, to disseminate information in innovative designs, engineering experiences and technological skills. It is also the Journal's objective to promote engineering and technology education. All papers submitted to the Journal will be blind peer-reviewed. Only original articles will be published.
Remote sensing of the environment and Earth observation sciences are relatively young research domains that are highly interdisciplinary, combining expertise in biology, ecology, geography, physics, and computing science. Combining data from space-based and airborne sensors with traditional field observations provides powerful insights on how different ecosystems function and what drives changes in them at a global scale. With the turn of the 21st century we have seen a major expansion of our Earth observation capabilities with hundreds of new satellite systems in orbit around our planet and a myriad of new environmental sensor systems at the surface keeping an eye on how our planet is changing and how those changes influence our societies.
This presentation reviews the basics of remote sensing of vegetation biophysics for ecology and environmental monitoring and explores in greater depth how we can use these new technologies to better understand how more sensitive ecosystems respond to global change forces and can act as canaries in the coal mine for the early detection of climate change risks. I will also discuss how our research capabilities in this field are changing with the start-up of commercial aerospace agencies, the ever-decreasing size and cost of consumer electronics, and the emergence of affordable unmanned aerial vehicles, or ‘drones’.
Innovations in Soil Health Monitoring: Combining Systematic Field Assessments with Spectroscopy and Earth Observation
By Leigh Ann Winowiecki, WLE/CIFOR-ICRAF
Innovations in soil health monitoring for nature and people
From Research to Resilience
WLE webinar series
October 28, 2021
Growth, gas exchanges and accumulation of inorganic matter of Populus nigra L...Innspub Net
Tunisia has made considerable efforts to solve major environmental problems. Reforestation of vast marginal
spaces with appropriate species, such as poplar, is one of the economic and environmental challenges (I-488). The fast-growingof this rupicolous species has a high specific versatility in its use. However, its need for water will limit their use in reforestation in areas where water resources are scarce. To cope with this situation, the use of unconventional water resources, including wastewater treatment, is a promising way to increase domestic
production of wood. Thus, the treated wastewater is valued as a source of unquestionable water, but also as a
source of nutrients. These plants were raised under non-binding for four months and divided into two lots
irrigated daily to field capacity with (i) potable water (control : T) and (ii) with treated waste water (TWW).
Biomass production, gas exchange and some mineral ions were measured during the experiment, in summer. Our results indicate that irrigation with treated wastewater has submitted a substantially marked effect resulting in an increase of gas exchange. Furthermore, after 60 days, the accumulation of certain metal ions (Cd, Pb and Ni) has resulted in a major malfunction on gas exchange.
Development of an Integrated Urban Heat Island Simulation ToolSryahwa Publications
Urban heat island (UHI) effect is quite common in megacities due to the built-up area and reduced greenery coverage of land surface, which highly affect urban livability. An integrated urban heat island simulation tool is developed by accounting for major heat sources and heat sinks in selected area of interest, and their interactions with the surrounding environment.
The influence of Vegetation and Built Environments on Midday Summer Thermal C...Zo Cayetano
The current study assesses the ability of vegetation to improve thermal comfort during desert summers. Microclimate data and fisheye photos were collected at nine sites throughout a single section of Arizona State University campus (Tempe, Arizona) from September 18 to September 29, 2015, when thermal discomfort is at its peak intensity. Among the sites, vegetation varied from desert grasses to nearly full overhead canopy. Other components of urban form, such as proximity to buildings, were controlled among sites but often varied as well. Using the air temperature, humidity and wind speed observations, the RayMan model calculated Physiologically Equivalent Temperature (PET). The model was evaluated and validated using Mean Radiant Temperature data derived from observations of globe temperature. A t-test confirmed that the PET levels of the sunexposed sites were significantly higher than those of shaded sites by 7.7°C regardless of the type of shade. Furthermore, the variation in vegetation did not influence humidity among the sites, and thus did not impact thermal comfort between the same. Sky View Factor was calculated as the percentage of visible sky in each site’s fisheye photo. Midday PET levels only loosely correlated with Sky View Factor, indicating a stronger dependency on momentary than diurnal shading.
Growing Season Extension & its Impact on Terrestrial Carbon; Gardening Guidebook www.scribd.com/doc/239851313, For more information, Please see Organic Edible Schoolyards & Gardening with Children www.scribd.com/doc/239851214 - Double Food Production from your School Garden with Organic Tech www.scribd.com/doc/239851079 - Free School Gardening Art Posters www.scribd.com/doc/239851159 - Increase Food Production with Companion Planting in your School Garden www.scribd.com/doc/239851159 - Healthy Foods Dramatically Improves Student Academic Success www.scribd.com/doc/239851348 - City Chickens for your Organic School Garden www.scribd.com/doc/239850440 - Huerto Ecológico, Tecnologías Sostenibles, Agricultura Organica www.scribd.com/doc/239850233 - Simple Square Foot Gardening for Schools, Teacher Guide www.scribd.com/doc/23985111 ~
Impact of Future Climate Change on water availability in Kupang CityWillem Sidharno
Observed climate change could affect water availability in the future. Changes also
occurred Kupang city in recent decades, an increase in the magnitude of the damage caused
by drought due to climate change. In an attempt to explore the effects of drought can be
aggravated by climate change. in this paper, the author will be analyze impact of changes in
the water balance in Kupang city. To achieve that, the author will use the procedure consists
of two procedures: Temperature and precipitation are modeled under two typical emission
A1FI and B1 scenarios evaluated in this study for future projections in Kupang, discharge
simulations using rainfall Mock generated daily rainfall and water balance monthly Data
analysis WEAP (water Evaluation and Planning System) based simulation Mock. Due to the
significant uncertainty involved in forecasting future water consumption and water yield, the
author will use the three scenarios assumed water consumption and water three outcome
scenarios. Three scenarios of water consumption, ie, "Low", "Medium" and "High" in
accordance with the expected number of water consumption. Disposal obtained from mock
simulations during the simulation period. Finally, the water balance analysis conducted by
WEAP based on a combination of the three scenarios of water consumption. With this
procedure, it is possible to explore different scenarios of water consumption and water
results and the results of this study can be used to establish the proper planning to minimize
the impact of drought on water availability to support water requirement due to climate
change in Kupang city.
Above ground biomass and carbon stock estimation of Arroceros Forest Park "Th...Innspub Net
In an area where urbanization is rapidly growing, carbon is slowly sequestered which clogs the ozone layer. With forest biomass, carbon is easily sequestered and stored by trees. This research focuses on the potential carbon storage of the Arroceros Forest Park, one of the last lungs of the metropolis located in the heart of the National Capital Region, Manila, Philippines. Trees with ≥10 cm diameter at breast height (DBH) were inventoried, from two (2) hectare area of site. These trees were used in the estimation of the biomass and carbon stock. The Power-Fit Equation from Banaticla (insert year), = 0.342 (DBH (exp (0.73))) was used in the study. Results showed that Swietenia macrophylla dominated the park. Species with highest contribution of biomass and carbon is the Swietenia macrophylla with value of 149.55t/ha. The carbon formed from this was 45%, and estimated carbon stock present is 30.59Ct/ha. Total aboveground biomass and carbon stock in the forest park is estimated at 640.21t/ha, and 130.95Ct/ha, respectively. Provided the carbon stock estimate, this could give more importance to Arroceros Forest Park in carbon sequestration. Site must be protected and enhanced to promote the important role of green spaces in Metro Manila.
Using landsat 8 data to explorethe correlation between urban heat island and ...eSAT Journals
Abstract On a local scale, climate change can potentially exacerbate the urban heat island (UHI) effect characterized by an abrupt thermal gradient between urbanized and nearby non-urbanized areas. While it is well-known that the presence of impervious surfaces and less vegetation influence urban microclimate, relatively little attention has been given to the spatial patterns of urban heat islands and how these patterns are affected by land use. In this study, we derive land surface temperature (LST) from Landsat 8 data over four time frames and analyze the relationship between urban thermal environments and urban land use. Landsat 8 Thermal Infrared Sensor (TIRS) and Operational Land Imager (OLI) band data are converted to top-of-atmosphere spectral radiance using radiance rescaling factors. At-satellite brightness temperature was retrieved and the land surface emissivity was calculated. In addition, Normalized Difference Vegetation Index and Normalized Difference Built-up Index were computed and their correlations with LST for each land use were examined. The results indicate that the highest maximum land surface temperature was observed in high density residential and commercial areas near city’s downtown. Coastal areas and areas near water bodies are found to have lower land surface temperatures. The results from this study can inform planning and zoning practices aimed at reducing the urban heat island effect and creating a cooler and more comfortable thermal environment for city residents. Keywords: Urban Heat Island, Land Surface Temperature, NDVI, NDBI, Land Use, Kruskal-Wallis Nonparametric Test.
Synthetic Fiber Construction in lab .pptxPavel ( NSTU)
Synthetic fiber production is a fascinating and complex field that blends chemistry, engineering, and environmental science. By understanding these aspects, students can gain a comprehensive view of synthetic fiber production, its impact on society and the environment, and the potential for future innovations. Synthetic fibers play a crucial role in modern society, impacting various aspects of daily life, industry, and the environment. ynthetic fibers are integral to modern life, offering a range of benefits from cost-effectiveness and versatility to innovative applications and performance characteristics. While they pose environmental challenges, ongoing research and development aim to create more sustainable and eco-friendly alternatives. Understanding the importance of synthetic fibers helps in appreciating their role in the economy, industry, and daily life, while also emphasizing the need for sustainable practices and innovation.
Instructions for Submissions thorugh G- Classroom.pptxJheel Barad
This presentation provides a briefing on how to upload submissions and documents in Google Classroom. It was prepared as part of an orientation for new Sainik School in-service teacher trainees. As a training officer, my goal is to ensure that you are comfortable and proficient with this essential tool for managing assignments and fostering student engagement.
2024.06.01 Introducing a competency framework for languag learning materials ...Sandy Millin
http://sandymillin.wordpress.com/iateflwebinar2024
Published classroom materials form the basis of syllabuses, drive teacher professional development, and have a potentially huge influence on learners, teachers and education systems. All teachers also create their own materials, whether a few sentences on a blackboard, a highly-structured fully-realised online course, or anything in between. Despite this, the knowledge and skills needed to create effective language learning materials are rarely part of teacher training, and are mostly learnt by trial and error.
Knowledge and skills frameworks, generally called competency frameworks, for ELT teachers, trainers and managers have existed for a few years now. However, until I created one for my MA dissertation, there wasn’t one drawing together what we need to know and do to be able to effectively produce language learning materials.
This webinar will introduce you to my framework, highlighting the key competencies I identified from my research. It will also show how anybody involved in language teaching (any language, not just English!), teacher training, managing schools or developing language learning materials can benefit from using the framework.
Acetabularia Information For Class 9 .docxvaibhavrinwa19
Acetabularia acetabulum is a single-celled green alga that in its vegetative state is morphologically differentiated into a basal rhizoid and an axially elongated stalk, which bears whorls of branching hairs. The single diploid nucleus resides in the rhizoid.
Introduction to AI for Nonprofits with Tapp NetworkTechSoup
Dive into the world of AI! Experts Jon Hill and Tareq Monaur will guide you through AI's role in enhancing nonprofit websites and basic marketing strategies, making it easy to understand and apply.
A Strategic Approach: GenAI in EducationPeter Windle
Artificial Intelligence (AI) technologies such as Generative AI, Image Generators and Large Language Models have had a dramatic impact on teaching, learning and assessment over the past 18 months. The most immediate threat AI posed was to Academic Integrity with Higher Education Institutes (HEIs) focusing their efforts on combating the use of GenAI in assessment. Guidelines were developed for staff and students, policies put in place too. Innovative educators have forged paths in the use of Generative AI for teaching, learning and assessments leading to pockets of transformation springing up across HEIs, often with little or no top-down guidance, support or direction.
This Gasta posits a strategic approach to integrating AI into HEIs to prepare staff, students and the curriculum for an evolving world and workplace. We will highlight the advantages of working with these technologies beyond the realm of teaching, learning and assessment by considering prompt engineering skills, industry impact, curriculum changes, and the need for staff upskilling. In contrast, not engaging strategically with Generative AI poses risks, including falling behind peers, missed opportunities and failing to ensure our graduates remain employable. The rapid evolution of AI technologies necessitates a proactive and strategic approach if we are to remain relevant.
Francesca Gottschalk - How can education support child empowerment.pptxEduSkills OECD
Francesca Gottschalk from the OECD’s Centre for Educational Research and Innovation presents at the Ask an Expert Webinar: How can education support child empowerment?
Operation “Blue Star” is the only event in the history of Independent India where the state went into war with its own people. Even after about 40 years it is not clear if it was culmination of states anger over people of the region, a political game of power or start of dictatorial chapter in the democratic setup.
The people of Punjab felt alienated from main stream due to denial of their just demands during a long democratic struggle since independence. As it happen all over the word, it led to militant struggle with great loss of lives of military, police and civilian personnel. Killing of Indira Gandhi and massacre of innocent Sikhs in Delhi and other India cities was also associated with this movement.
Unit 8 - Information and Communication Technology (Paper I).pdfThiyagu K
This slides describes the basic concepts of ICT, basics of Email, Emerging Technology and Digital Initiatives in Education. This presentations aligns with the UGC Paper I syllabus.
Unit 8 - Information and Communication Technology (Paper I).pdf
Artigo36
1. Rev. SBAU, Piracicaba, v.3, n.2, jun. 2008, p. 1-19
1
SIMULATION OF THE INFLUENCE OF VEGETATION ON MICROCLIMATE AND
THERMAL COMFORT IN THE CITY OF SÃO PAULO
Jörg Spangenberg1, Paula Shinzato2, Erik Johansson3 and Denise Duarte4
(recebido em 29.11.2007 e aceito para publicação em 18.04.2008)
ABSTRACT
The microclimates of a park, a square and a street canyon were measured on a summer day
in the city centre of São Paulo, Brazil. The field monitoring showed that the park was up to
2°C cooler than the square and the canyon. The effect of adding shading trees to the street
canyon was simulated for the same day using the numerical model ENVI-met. The
simulations showed that incorporating street trees in the urban canyon had a limited cooling
effect on the air temperature (up to 1.1°C), but led to a significant cooling of the street
surface (up to 12°C) as well as a great reduction of the mean radiant temperature at
pedestrian height (up to 24°C). Although the trees lowered the wind speed up to 45% of the
maximum values, the thermal comfort was improved considerably as the physiologically
equivalent temperature (PET) was reduced by up to 12°C.
Keywords: urban vegetation, urban microclimate, numerical simulation, pedestrian thermal
comfort.
1 Arquiteto, doutorando da Bauhaus University, Weimar, Germany, e do Laboratório de Conforto Ambiental e
Eficiência Energética (LABAUT), FAUUSP, São Paulo-SP, joerg_spangenberg@yahoo.com.br
2 Arquiteta, mestranda, bolsista FAPESP, LABAUT, FAUUSP, São Paulo-SP, paulashinzato@yahoo.com
3 Engenheiro Civil, Dr., Housing Development & Management, Lund University, Sweden e pós-doutorando
LABAUT, FAUUSP, São Paulo-SP, erik.johansson@hdm.lth.se
4 Profa. Dra., LABAUT, FAUUSP, São Paulo-SP, dhduarte@terra.com.br
2. Rev. SBAU, Piracicaba, v.3, n.2, jun. 2008, p. 1-19
2
SIMULAÇÃO DA INFLUÊNCIA DA VEGETAÇÃO NO MICROCLIMA URBANO E
CONFORTO TÉRMICO NA CIDADE DE SÃO PAULO
RESUMO
Durante o verão, foram realizadas medições das condições microclimáticas existentes em
um parque, uma praça aberta e um canyon urbano na cidade de São Paulo. Os resultados
do monitoramento de campo indicaram que o parque apresenta temperaturas do ar até 2°C
mais baixas do que na praça e no canyon. O efeito de novas árvores no canyon urbano foi
simulado por meio do modelo ENVI-met na mesma data da medição. Os resultados das
simulações mostram o efeito do resfriamento da temperatura do ar em até 1.1°C e, por outro
lado, uma diminuição da temperatura superficial do pavimento (até 12°C), bem como uma
considerável redução na temperatura radiante média no nível do pedestre (até 24°C).
Apesar da diminuição da velocidade do vento em até 45% nos valores máximos, o conforto
térmico teve uma melhora considerável, uma vez que a temperatura fisiológica equivalente
(PET) foi reduzida em até 12°C.
Palavras-chave: vegetação urbana, microclima urbano, simulação numérica, conforto
térmico dos pedestres.
3. Rev. SBAU, Piracicaba, v.3, n.2, jun. 2008, p. 1-19
3
INTRODUCTION
In the tropics, the outdoor thermal comfort conditions during daytime are often far
above acceptable comfort standards due to intense solar radiation and high solar elevations
(Ali-Toudert and Mayer, 2007; Johansson, 2006). While the urban heat island is less of a
problem in temperate climates, it is unwanted in low and mid latitude cities as it contributes to
increase the cooling load and results in increased energy use (Taha, 1997).
Vegetation is an important design element in improving urban microclimate and
outdoor thermal comfort in urban spaces in hot climates (Spangenberg, 2004). Due to
urbanization, however, vegetation is scarce in many tropical cities. There has often been a
tendency to replace natural vegetation and permeable soils with impervious surfaces such as
asphalt and concrete, which leads to more sensible than latent heat flux (Emmanuel, 2005).
In urban streets, vegetation is often considered a problem for several reasons. For example,
trees are costly to maintain, their canopies often interfere with overhead telephone and
electric lines and their roots may destroy pavements and underground sewers.
The use of vegetation in hot climates
The main benefits of vegetation in hot climates are reduced solar radiation and lower
air temperature due to shading and evapotranspiration. Lower air temperatures are essential
both to improve thermal comfort conditions of pedestrians and to limit energy use for cooling.
According to Akbari et al. (2001) peak energy demand in the USA rises 2–4% for every 1°C
increase in maximum air temperature.
Among other factors, the effect of vegetation on the microclimate depends on the size
of the vegetated area. While the cooling effect on the air temperature is limited for a single
tree or a small group of street trees (Oke, 1989), larger areas such as parks can have a
significant cooling effect (Yu and Hien, 2006). The evapotranspiration of vegetated areas is
highly dependant on soil humidity; for dry soils, which are common in urban areas due to
sealing of the ground, evapotranspiration cooling will be limited (Oke, 1989).
There are also negative effects of vegetation in warm climates. One drawback with
trees is that they block the wind; a deciduous tree may reduce wind speeds by 30-40% (Ali-
Toudert and Mayer, 2007). Trees with large canopies will also reduce nocturnal cooling as
they block some of the net outgoing long-wave radiation.
Several recent studies have shown that vegetation is beneficial in lowering air
temperatures, in providing shade and in improving thermal comfort. Field measurements by
Shashua-Bar and Hoffman (2004) showed that some tree-aligned streets and boulevards in
the Tel-Aviv area, Israel, had 1–2.5°C lower air temperatures than non-vegetated streets at
4. Rev. SBAU, Piracicaba, v.3, n.2, jun. 2008, p. 1-19
the hottest part of the day (15:00 h). Applying the simulation software ENVI-met (Bruse,
2006) to the climate of Thessaloniki, Greece, Chatzidimitriou et al. (2005) found small
temperature decrease for tree-aligned streets (less than 1°C), but up to 20°C lower surface
temperatures and more than 40°C lower mean radiant temperatures. The cooling effect was
found to increase with rising number of trees. In the hot dry climate of Ghardaia, Algeria, Ali-
Toudert and Mayer (2007) found that shading trees could improve the thermal comfort in
streets considerably. In another simulation study of different greening scenarios using ENVI-met
in Rio de Janeiro, Brazil, Spangenberg (2004) found that an increased amount of urban
green (tree cover of 30% of the ground and 100% green roofs) could nearly re-create the
comfortable conditions of a natural forest.
4
Urban vegetation in São Paulo, Brazil
This paper shows preliminary results from an ongoing study of the benefits of
vegetation in the city of São Paulo, Brazil. The research includes field measurements during
the hot humid summer to compare the microclimates of a park, a square and an urban
canyon as well as numerical simulations of the effect of vegetation on microclimate using
ENVI-met (Bruse, 2006). There are several recent studies simulating the effect of vegetation
in warm climates with ENVI-met. These studies have, however, been either focussing on air
temperature in warm and dry climates (Ali-Toudert and Mayer, 2005; Ali-Toudert and Mayer,
2007; Chatzidimitriou et al., 2005) or only treated effects on the air temperature and not
thermal comfort itself (Jusuf et al., 2006; Spangenberg, 2004; Yu and Hien, 2006).
The objective of this research is to study the effect of shading trees with different leaf
densities on the microclimate and outdoor thermal comfort in public spaces. From the output
data provided by ENVI-met it is possible to estimate thermal comfort by calculating the
Physiologically Equivalent Temperature (PET).
MATERIALS AND METHODS
Area of Study
The city of São Paulo
The city of São Paulo is located at 23°32’S, 46°37’W, 60km from the sea. The altitude
varies between 720m and 850m. The city’s climate is characterised by hot, humid summers
with air temperatures varying between mean minima of 22°C and mean maxima of 30°C and
mild winters with temperatures between mean minima of 10°C and mean maxima of 22°C.
5. Rev. SBAU, Piracicaba, v.3, n.2, jun. 2008, p. 1-19
São Paulo is a sprawling South American megacity, which’s metropolitan area
houses almost 19 million inhabitants, distributed in an area of 8051km2. Based on reports
from the Municipal Environmental Agency (SVMA, 2004), São Paulo’s economy represents
31% of the national Gross Domestic Product (GDP). However, this economic development
has led to a significant degradation of the urban environment, a common situation in many
large cities in developing countries.
Today, São Paulo is characterised by a heterogeneous urban structure, which has
been caused by the rapid growth of the city during the last century. One of the effects of this
growth is the social conflict and contrast of high-rise office towers close to poor informal
settlements (favelas). According to the architect Oscar Niemeyer, “The first lesson São Paulo
offers is that no city should grow so arbitrarily” and “the second lesson of São Paulo is that its
people, and the people of cities in poor countries elsewhere, should have the right to a
habitat that is more graceful” (Romero, 2000).
The distribution of vegetated areas is non-uniform in the city. Only the wealthiest
boroughs are characterised by large amount of vegetation and tree-aligned streets, while the
downtown areas of Brás and Santa Cecília are almost devoid of vegetation (SVMA,
2004).The Environmental Atlas of São Paulo (SVMA, 2004) includes a map showing surface
temperatures in the city of São Paulo. The highest temperatures were found in the central
area without green areas and the lowest in urban parks. Similar temperature patterns were
found by Duarte and Souza (2005).
To improve the situation, the City Hall is investing in tree planting programs and
5
several linear parks, intending to increase the vegetated areas.
On-site Measurements
The central area of São Paulo is formed by the Old Town (Sé), the New Town
(República) and another 10 boroughs (Meyer et al., 2004). In the downtown area, there are
seven urban parks.
For decades, downtown has suffered a continuous degradation process and has
gradually been abandoned by its residents. The metropolitan area of São Paulo experiences
simultaneously massive urban sprawl in its peripheries and population decrease in its central
parts (the population of the central borough of República diminished by 28% between 1980
and 1999). Today, some downtown districts have a population density of less than 70
inhab/ha (IBGE, 2000) in spite of a high built density.
To change this negative trend, downtown has been the focus of revitalization efforts
with several urban projects organized by the local government. The recent initiatives show
the special interest to promote a public discussion for possible transformations of the existing
urban structure. One of them is the project Nova Luz (New Luz), which intends to implement
6. Rev. SBAU, Piracicaba, v.3, n.2, jun. 2008, p. 1-19
new commercial and residential buildings on the one hand and preserve the existing
architectural patrimony on the other hand. However, vegetation does not play a major role in
this renewal process.
This study focuses on the area of Luz (Figs. 1 and 2), which is situated in the city
6
centre.
FIGURE 1. a) Street life in the Luz area (photos of square, left, and street canyon, right).
b) The measurement equipment used in the urban canyon. Source: LABAUT
Since 2004, LABAUT has been studying the central area of the city as part of a
partnership with University of Cambridge and University of East London (LABAUT, 2006).
The project Sustainable Urban Spaces has explored new environmental approaches for the
revitalization of abandoned parts in central areas.
Methodology
On-site Measurements
Climate monitoring was carried out on 19th of December 2006 in the area of Luz (Figs.
1 and 2). This day can be considered a typical hot summer day: clear sky conditions in the
morning, partly overcast sky in the afternoon and rain in the evening (see Fig. 4). The main
goal of these measurements was to create an initial database for air temperature, relative
humidity, solar radiation, surface temperature, wind direction and wind speed for the summer
period.
Three main types of urban spaces were defined for the measurements: a park, an
open air square and an urban canyon. These three areas were chosen considering the main
characteristics of the site and its surroundings (Fig. 2). The particular interest was to
compare the effect of vegetation in the park with the other two situations. The sky view
factor, that is, the amount of the sky seen from a point on the ground, of the three sites varies
considerably (Fig. 3).
7. Rev. SBAU, Piracicaba, v.3, n.2, jun. 2008, p. 1-19
7
FIGURE 2. Location of the three measurement points in Luz borough.
Point 1 = park, point 2 = canyon and point 3 = square. Source: Google Earth
(1) (2) (3)
FIGURE 3. Hemispheric pictures of the sky view taken with a Nikon 4500 equipped with a
180° fish eye lens for park (1), canyon (2) and open square (3). Source: LABAUT
The canyon is located in a dense area with 5-10 storeys high commercial buildings.
The street has an intense flux of vehicles and pedestrians attracted by the local commerce of
electro-electronics devices (Fig. 1a). In addition to this critical situation, the thermal comfort is
8. Rev. SBAU, Piracicaba, v.3, n.2, jun. 2008, p. 1-19
poor. The average block size in Luz is 60m by 100m. The street canyon has an average
width of 12m and the building height is on average 26m (corresponding to eight-storey
buildings) which gives a height to width ratio (H/W) of 0.5. There are very few trees in the
street due to narrow sidewalks and problems with aerial electric cables and telephone lines.
The open square, which has white stone paving (Portuguese pavement), is more exposed to
direct solar radiation than the other sites due to lack of vegetation and shading.
Three meteorological stations (Huger WM 918 and 968, as well as ELE MM900) were
used to measure air temperature, humidity and wind speed simultaneously at 1.10m height
at the three locations (Fig. 1b). All measurements were recorded on data loggers every ten
minutes between 7:00 and 19:00 local daylight saving/ summer time.
On the square, additionally global solar radiation was measured with a pyranometer.
Surface temperatures of various construction materials and natural surfaces were measured
on the square using an infrared thermometer TFA 31.1108. During the intervals of the
measurements interviews with pedestrians regarding their thermal comfort sensation and
their opinion on benefits and problems with vegetation in the city were carried out.
8
Thermal Comfort Surveys
To support a study aiming at developing a local comfort index for São Paulo, surveys
on the subjectively perceived outdoor thermal comfort were executed in the three
aforementioned locations. Since this study is not concluded yet, the Physiologically
Equivalent Temperature (PET, Höppe, 1999) was adopted in this paper to evaluate and
compare the results. PET, which is designed for outdoor conditions and is based on a
steady-state heat balance equation of the human body, takes all environmental parameters
that affect thermal comfort – air temperature, mean radiant temperature, humidity and wind
speed – into account. Personal factors such as clothing insulation and the level of activity
are, however, not included. PET has recently been calibrated against subjective comfort
votes in the climate of São Paulo by Monteiro and Alucci (2006) who interviewed
approximately 2.000 people adapted to local conditions.
Microclimate simulations
The micro scale model ENVI-met (Bruse, 2006) was chosen for this study due to its
advanced approach on plant-atmosphere interactions in cities. The numerical model
simulates aerodynamics, thermodynamics and the radiation balance in complex urban
structures with resolutions (grid-sizes) between 0.5m and 10.0m according to position of the
sun, urban geometry, vegetation, soils and various construction materials by solving
thermodynamic and plant physiological equations.
9. Rev. SBAU, Piracicaba, v.3, n.2, jun. 2008, p. 1-19
The building section of the model has shown some limitations, since the same
properties (such as albedo and U-value) are applied equally to all walls and roofs
respectively. Further, the heat storage term for the buildings, which calculates the time lag, is
not included in the energy balance of the building surfaces. Due to this fact, the thermal
mass of vertical constructions, which causes delayed heat dissipation, is not taken into
account for buildings, as it is for ground paving and soils.
The input data for the simulations are shown in Table 1 and the input area file is
shown in Fig. 4a. The solar radiation, which is calculated depending on latitude, was slightly
over-estimated by ENVI-met for São Paulo conditions and was therefore decreased to 90%.
The only additional climate data (not derived from local measurements) was that for specific
humidity at 2500m, which was obtained from local airport soundings at Campo de Marte (ca.
3.3km North of the site), available from the homepage of University of Wyoming (UWYO,
2007).
As recommended (Bruse, 2006), 48 hours simulations were used to pass the initial
transient time in order to obtain results that are more reliable. In the preliminary simulations,
both the average air temperature and the diurnal amplitude were underestimated. Therefore,
some of the input data had to be adjusted to achieve better correlation with the measured
results. The temperature course of the model has shown significant sensibility to wind speed.
The diurnal amplitude tends to increase with decreased wind speed. The measured wind
speed varied strongly in direction and speed throughout the day. The average mean wind
speed measured was 1.6m/s, but 0.8m/s was adopted in order to adjust the temperature
curve. The initial temperature was increased by 1°C in order to approximate to measured
peak values, resulting in a limited correlation between measured and simulated temperature
curve in the morning (7:00 – 9:00 h) and in the evening (17:00 – 20:00 h).
9
10. Rev. SBAU, Piracicaba, v.3, n.2, jun. 2008, p. 1-19
Temperature (°C) Measured - no vegetation
Simulated - no vegetation
07:00 09:00 11:00 13:00 15:00 17:00 19:00
10
TABLE 1. Input configuration data applied in the ENVI-met simulations.
Atmosphere
Start of simulation (h) 7:00
Wind speed at 10 m above ground level [m/s] 0.8
Wind direction 170
Initial temperature of the atmosphere [in degrees Kelvin] 297
Specific humidity at 2500 m [g Water/kg air] 9.0
Solar adjustment factor 0.9
Relative humidity at 2m [%] 70
Soils
Relative humidity in all layers [%] 25
Buildings
Albedo of walls 0.4
Albedo of roofs 0.3
After the calibration process, similar daily temperature and humidity curves were
achieved. The comparison between measured and simulated air temperature is shown in
Fig. 4b. The calculated coefficient of determination, R², between measured and simulated air
temperature, based on 79 values, was found to be 0.7487.
35
33
31
29
27
25
Local Time
Clear Partially
Overcast
Overcast
FIGURE 4. a) Input area domain for simulations with trees (including nesting area). b)
Comparison between measured and simulated air temperature for the existing street canyon.
The changing sky conditions shown in the figure refer only to the measured data and cannot
be simulated with ENVI-met yet.
11. Rev. SBAU, Piracicaba, v.3, n.2, jun. 2008, p. 1-19
To a large extent the urban geometry of a city is characterized by a repetitive element
called the urban canyon (Emmanuel, 2005). Consequently, an urban canyon was chosen for
a parametric study and the simplified model is shown in Fig. 4a. In addition to the actual
situation, two different greening scenarios were simulated, one with less dense street trees
(T1) and another with a much denser tree canopy (T2). The leaf area indices (LAI)1 for T1
and T2 were 1 m²/m² and 5 m²/m² respectively. Both tree types were 10m high with canopies
covering the entire street. Both parametric tree models had ellipsoid leaf area distributions
with maximum Leaf Area Densities (LAD)2 located in the middle of the crowns. The
attenuation of solar radiation at midday was 39,3% for T1 and 91.9% for T2. The aim was to
evaluate how the attenuation of solar radiation of the two tree canopy types influenced air
temperature, surface temperature, humidity, wind speed and thermal comfort.
10
8
6
10
8
6
1 The Leaf Area Index (LAI) is defined as the total one-sided leaf surface area (m²) per unit ground area (m²)
2 The Leaf Area Density (LAD) is defined as the total one-sided leaf area (m²) per unit layer volume (m³) in each
horizontal layer of the tree crown. Height [m]
11
T1 T2
4
2
0.0 0.5 1.0
4
2
0
0.0 0.5 1.0
FIGURE 5. LAD (Leaf Area Density) (m²/m³) in 10 layers of the two tree models T1 and T2.
T1 has 20% of the Leaf Area Density (LAD) of T2.
RESULTS AND DISCUSSION
Measurement Results
The results shown at Local Time (in this case equal to daylight saving time) of the
measurements gave important information about the microclimatic differences among the
three urban sites (Fig. 6a). The ambient air temperature profiles show that the cooling effect
of the park is on average 2°C compared to the open square with peaks up to 6°C. Compared
to the canyon, the temperature of the park is about 2.5°C lower around noon. The relative
humidity was about 10% higher in the park than in the other two sites (Fig. 6b). The absolute
12. Rev. SBAU, Piracicaba, v.3, n.2, jun. 2008, p. 1-19
humidity (g/m³) is about 1g/m³ higher in the park. The lower temperature and higher humidity
in the park is due to shading and evapotranspiration.
100
90
80
70
60
50
40
30
20
10
0
RH Park RH Canyon
RH Square Abs. hum. Park
Abs. hum. Canyon Abs. hum. Square
7:00 9:00 11:00 13:00 15:00 17:00 19:00
Local Time
Relative Humidity (%)
20
18
16
14
12
10
8
6
4
2
0
Absolute Humidity (g/m3)
38
36
34
32
30
28
26
24
22
20
Temp Park
Temp Canyon
Temp Square
7:00 9:00 11:00 13:00 15:00 17:00 19:00
Local Time
Temperature (°C)
FIGURE 6. a) Results of air temperature distribution for the park, the open square and the
canyon. b) Results of relative and absolute humidity distribution for the park, the open square
and the canyon.
12
Simulation Results
The results are shown for a point in the crossing between the east-west and north-south
oriented street canyons. All results are shown at Local Time, which in our case is equal
to daylight saving time (summer time), that is LST+1 h.
Air temperatures
In Fig. 7a the simulated air temperature is shown for the three cases no trees, trees
having a high-density canopy (LAI=5) and trees having a low-density canopy (LAI=1). The
canyons covered with less dense (T1) and dense tree canopies (T2) have, on average, 0.5°C
and 1.1°C lower air temperatures than the case without tree, respectively.
The fact that street trees have only a limited cooling effect on the air temperature
agree fairly well with both field measurements (Shashua-Bar and Hoffman, 2004) and
simulation studies (Ali-Toudert and Mayer, 2005; Ali-Toudert and Mayer, 2007;
Chatzidimitriou et al., 2005). The effect found in this study is, however, less than that
reported by Ali-Toudert and Mayer (2005; 2007), who found cooling effects of up to 1.5°C for
a hot-dry city. The reason may be that the air was dryer in their study and hence the cooling
effect of evapotranspiration higher.
13. Rev. SBAU, Piracicaba, v.3, n.2, jun. 2008, p. 1-19
34
32
30
28
26
24
Simulated - no vegetation
High-density canopy (LAI=5)
Low -density canopy (LAI=1)
07:00 09:00 11:00 13:00 15:00 17:00 19:00
Local Time
Temperature (°C)
50
45
40
35
30
25
20
No vegetation
High-density tree canopy
Low -density tree canopy
07:00 09:00 11:00 13:00 15:00 17:00 19:00
Local Time
Temperature (°C)
FIGURE 7. a) Simulated air temperature for the street canyon without trees, with trees
having a high-density canopy and with trees having a low-density canopy. b) Simulated
street surface temperature for treeless street, street with high-density tree canopies and
street with low-density tree canopies.
13
Surface temperatures
Fig. 7b shows the surface temperature of the asphalted street for the three cases (no
trees, low-density canopy and high-density canopy). During the hours when the street
receives solar radiation (from 12:00 to 15:00), Fig. 7b shows that the trees have a huge
impact on the surface temperature of the ground. The less dense tree (T1) lowers the
temperature by up to 5°C and the high-density tree (T2) by up to 12°C.
The results agree well with Chatzidimitriou et al. (2005), although they report even
higher reduction in surface temperatures. The reason may be that they studied a shallower
canyon (H/W = 0.5) and thus the temperature of their treeless case was higher than in this
study where the canyon is relatively deep (H/W = 2.2).
Mean Radiant Temperature (MRT)
The mean radiant temperature (MRT) is the parameter mostly affected by shading
trees. Fig. 8a shows how the MRT varies at pedestrian height for the three cases (no trees,
high-density canopy and low-density canopy). During the hours when the street receives
solar radiation (from 12:00 to 15:00), Fig. 8a shows that the less dense (T1) and dense (T2)
tree canopies lower the MRT by up to 11°C and 24°C respectively. The high-density canopy
is considerably more efficient than the low-density canopy.
The reduction in MRT through shading includes both less received direct, diffuse and
reflected short-wave radiation from the sun and lower surface temperatures and thereby
lower thermal (long-wave) radiation from urban surfaces.
14. Rev. SBAU, Piracicaba, v.3, n.2, jun. 2008, p. 1-19
The reductions in MRT found in this study are less than found by Chatzidimitriou et al.
(Chatzidimitriou et al., 2005). A probable reason is that they studied a shallower canyon as
discussed above.
Neutral
(PET 17 - 26°C)
14
Humidity
The relative humidity rises only slightly due to the incorporation of trees in the street
canyon (less than 5%). The high-density canopy causes a few per cent higher RH than the
low-density canopy. The absolute humidity is, however, similar for all cases and very stable,
varying from about 12 to 14 g/m³ during the day. The insignificant effect on tree evaporation
on humidity found here agrees well with other studies (Ali-Toudert and Mayer, 2005; Ali-
Toudert and Mayer, 2007).
Wind speed
The wind speed simulated by ENVI-met is clearly affected by the trees. Although the
studied trees have no leaves between ground level and 3 m height, the wind speed at
pedestrian height (1.5 m) is reduced from about 0.86 m/s (no trees) to about 0.80 m/s (high-density
canopy) and to 0.47 m/s (low-density canopy), respectively. Thus, canopies with low
LADs reduce wind speed considerably less than trees with high LADs.
70
60
50
40
30
20
No vegetation
High-density canopy (LAI=5)
Low -density canopy (LAI=1)
07:00 09:00 11:00 13:00 15:00 17:00 19:00
Local Time
MRT (°C)
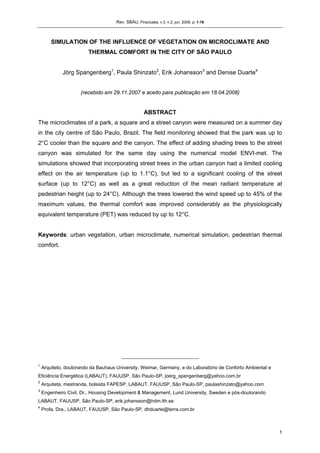
FIGURE 8. a) Simulated MRT for treeless street, street with high-density tree canopies and
street with low-density tree canopies. b) Simulated PET for treeless street, street with high-density
tree canopies and street with low-density tree canopies.
Physiologically Equivalent Temperature (PET)
The thermal comfort, expressed as the physiologically equivalent temperature (PET),
was calculated based on simulated values of air temperature, MRT, relative humidity and
wind speed (however, the simulated wind speed was increased again to agree with the
measurements).
15. Rev. SBAU, Piracicaba, v.3, n.2, jun. 2008, p. 1-19
PET varies significantly between a treeless street canyon and a street covered with
tree canopies. Figure 8b shows how PET varies at pedestrian height for the three cases (no
trees, high-density canopy and low-density canopy). Similarly to the MRT, PET reaches
highly uncomfortable values between 12:00 and 15:00. This peak is considerably lowered by
the less dense trees (T1) and virtually erased by the dense shading trees (T2). Denser trees
are thus more efficient although they lower the wind speed more than the less dense trees.
The reductions in PET found in this study (up to 12°C) are less than those presented
by Ali-Toudert and Mayer (Ali-Toudert and Mayer, 2005; Ali-Toudert and Mayer, 2007) who
found reductions above 20°C. The reason may be that they had a larger proportion of direct
solar radiation and thus the trees provided more efficient shade.
15
CONCLUSIONS
The measurements indicated that the public Luz Park has a cooling effect with around
2°C lower temperatures than its surroundings. The surface temperature measurements also
showed that natural surfaces are considerably cooler than commonly used construction
materials such as concrete and asphalt.
The results from the simulations presented in this study clearly show that vegetation
in the form of trees has a great potential of improving the microclimate and mitigate heat
stress in a hot humid climate.
The leaf area index (LAI) and leaf area density (LAD) of the canopy proved to be
important metrics, which have a significant influence on the microclimate. The denser the
tree canopy (higher LAI and LAD), the lower the air and surface temperatures and the better
the thermal comfort for hot-humid climate.
In general, trees provide, under their canopies (locally restricted), significant
improvements on thermal comfort principally during midday and in the early afternoon as
they provide overhead shading by attenuating the solar radiation. The crucial benefit of
shade, resulting in considerably lower mean radiant temperatures, has more influence on the
thermal comfort expressed in PET than the decrease of the wind speed. Moreover, trees
increase the quality of the public space, also due to other benefits, not included in this study
yet, like absorption of rainwater and CO2 and other air pollutants uptake.
Isolated trees and even rows of trees have a rather small impact on the decrease of
air temperatures, and thus, apparently a limited potential for mitigating air temperatures of
the urban heat island. Consequently the possibility to improve energy efficiency of buildings
by decreasing heat loads is limited. However, the lower surface temperatures of roofs and
façades caused by the vegetation will contribute to lower cooling loads (Akbari et al., 2001).
16. Rev. SBAU, Piracicaba, v.3, n.2, jun. 2008, p. 1-19
Only the implementation of city-wide changes (from groups of trees to large-scale
green space interventions), encouraged by modified building codes and citizens’ initiatives,
could promote a greener (well distributed vegetation in) São Paulo and mitigation of the
urban heat island. For this purpose, even in the 21st century, vegetation remains an
irreplaceable urban element. Hence, it is possible, nowadays, due to technological advance
to access, to analyse and better understand the impacts of vegetation with the aid of tools
like ENVI-met.
16
Planned Future Work
Future studies include research on different species of local urban street trees, on the
importance of tree height, type of tree canopies, leaf area index (LAI) and leaf area density
(LAD). Another aim is to adapt the standard ENVI-met plant database to a local plant
database. Moreover, the climatically strategically positioning and grouping of trees will be
studied.
In future work, other types of urban areas such as squares will be studied as well as
different types of parks. In addition, the results of the questionnaire surveys on subjective
perception of the thermal environment will be part of the thermal comfort studies.
Since the boundary conditions of the ENVI-met model can hardly be defined correctly
based on field measurements, investigations on corrections and nesting with the meso-scale
model RAMS (Freitas et al., 2007) has been initialized. Forcing the ENVI-met model may
become necessary in future steps of the work process.
To calibrate the model for the conditions of the measurements we are trying to
overcome the missing impact of heat storage by allocating materials with increased thermal
mass around the buildings on the sidewalks according to a method proposed by Johansson
(2006).
ACKNOWLEDGEMENTS
This research was supported by Holcim Foundation for Sustainable Construction (J.
Spangenberg), Fundação de Amparo à Pesquisa do Estado de São Paulo – FAPESP (P.
Shinzato) and Swedish International Development Cooperation Agency – Sida (E.
Johansson). The authors are grateful to Labaut staff, University of São Paulo, for their
assistance in the field measurements and to IAG – Institute of Astronomy, Geophysics and
Atmospheric Sciences, University of São Paulo for assistance with the simulations.
17. Rev. SBAU, Piracicaba, v.3, n.2, jun. 2008, p. 1-19
17
REFERENCES
AKBARI, H.; POMERANTZ, M.; TAHA, H. Cool surfaces and shade trees to reduce
energy use and improve air quality in urban areas. Solar Energy, Tampa, vol. 70, n. 3, p.
295-310, 2001.
ALI-TOUDERT, F.; MAYER, H. Thermal comfort in urban streets with trees under hot
summer conditions. In: PLEA 2005 – Passive and Low Energy Architecture, 2005, Beirut.
Proceedings PLEA 2005 – Passive and Low Energy Architecture, Beirut: PLEA International,
2005, p. 699-704.
ALI-TOUDERT, F.; MAYER, H. Effects of asymmetry, galleries, overhanging façades
and vegetation on thermal comfort in urban street canyons. Solar Energy, Tampa, vol.
81, p. 742-754, 2007.
BRUSE, M. ENVI-met v. 3.0. Available at: <http://www.envi-met.com>. Accessed 1 July
2007.
CHATZIDIMITRIOU, A.; CHRISSOMALLIDOU, N.; YANNAS, S. Microclimate
modifications of an urban street in northern Greece. In: PLEA 2005 – Passive and Low
Energy Architecture, 2005, Beirut. Proceedings PLEA 2005 – Passive and Low Energy
Architecture, Beirut: PLEA International, 2005, p. 689-694.
DUARTE, D.; SOUZA, T. Urban Occupation Patterns and Microclimates in São Paulo –
Brazil. In: SB 2005. Sustainable Building, 2005, Tokyo. The 2005 World Sustainable Building
Conference, 2005.
EMMANUEL, M. R. An Urban Approach to Climate-Sensitive Design – Strategies for the
Tropics. New York, Spon Press, 2005.
FREITAS, E. D.; ROZOFF, C. M.; COTTON W. R.; SILVA DIAS, P. L. Interactions of an
urban heat island and sea-breeze circulations during winter over the metropolitan area
of São Paulo, Brazil. Boundary-Layer Meteorology, Dordrecht, vol. 122, p. 43–65, 2007.
HÖPPE, P. The physiological equivalent temperature – a universal index for the
biometeorological assessment of the thermal environment. International Journal
of Biometeorology , Dordrecht, vol. 43, p. 71-75, 1999.
18. Rev. SBAU, Piracicaba, v.3, n.2, jun. 2008, p. 1-19
18
IBGE. Censos Demográficos, Instituto Brasileiro de Geografia e Estatística (IBGE), 2000.
JOHANSSON, E. Urban design and outdoor thermal comfort in warm climates –
studies in Fez and Colombo, 2006. Thesis (PhD in architecture), Housing Development &
Management, Lund University, Lund, Sweden, 2006.
JUSUF, S. K.; HIEN, W. K.; LA WIN, A. A.; THU, H. K.; NEGARA, T. S.; XUCHAO, W.
Study on effect of greenery in campus area. In: PLEA 2006 – Passive and Low Energy
Architecture, 2006, Geneva. Proceedings PLEA 2006 – Passive and Low Energy
Architecture, Geneva: PLEA International, 2006, vol. I, p. 483-488.
LABAUT. Sustainable Urban Spaces. Intermediate report: context studies and the strategy
for environmental/ sustainable urban design. Colaboração Internacional Brasil-UK.
Laboratory of Comfort and Energy Studies – LABAUT, FAUUSP. São Paulo, 2006. (To be
published)
MEYER, R. P. M.; GROSTEIN, M. D.; BIDERMAN, C. São Paulo Metrópole. Sao Paulo:
EDUSP, 2004.
MONTEIRO, L. M. AND ALUCCI, M. P. Calibration of outdoor thermal comfort models.
In: PLEA 2006 – Passive and Low Energy Architecture, 2006, Geneva. Proceedings PLEA
2006 – Passive and Low Energy Architecture, Geneva: PLEA International, 2006, vol. I, p.
515-522.
OKE, T. R. The micrometeorology of the urban forest. Phil. Trans. Royal Society London,
London, vol. B324, p. 335-349, 1989.
ROMERO, S. Destination: São Paulo. Metropolis Magazine, October 2000. Available at:
<http://www.metropolismag.com/html/content_1000/sao.htm>. Accessed 1 July 2007.
SHASHUA-BAR, L.; HOFFMAN, M. E. Quantitative evaluation of passive cooling of the
UCL microclimate in hot regions in summer, case study: urban streets and courtyards
with trees. Building and Environment, Oxford, vol. 39, p. 1087-1099, 2004.
19. Rev. SBAU, Piracicaba, v.3, n.2, jun. 2008, p. 1-19
SPANGENBERG, J. Improvement of Urban Climate in Tropical Metropolis – A case
study in Maracanã/ Rio de Janeiro, Thesis (Master in architecture), University of Applied
Sciences, Cologne, Germany, 2004. Available at: < http://www.basis-id.de/science >.
Acessed 3 March 2008.
SPANGENBERG, J.; SHINZATO, P.; JOHANSSON, E.; DUARTE, D. (2007). The Impact of
Urban Vegetation on Microclimate in Hot Humid São Paulo, In: PLEA 2007 – Passive
andLow Energy Architecture. 2007, Singapure. Proceedings PLEA 2007 – Passive and Low
Energy Architecture, Singapure: PLEA International, 2007.
SÃO PAULO (cidade). Secretaria do Verde e do Meio Ambiente – SVMA. Atlas ambiental
de São Paulo, Prefeitura da Cidade de São Paulo, 2004.
TAHA, H. Urban climates and heat islands: albedo, evapotranspiration, and
anthropogenic heat. Energy and Buildings, Oxford, vol. 25, p. 99-103, 1997.
UWYO. Soundings. Available at: <http://weather.uwyo.edu/upperair/sounding.html>.
Accessed 1 July 2007.
YU, C; HIEN, W. N. Thermal benefits of city parks. Energy and Buildings, Oxford, vol. 38,
p. 105-120, 2006.
19