A Harvard study reveals that only one in three organizations, including critical water utilities, are prepared for a widespread swine flu outbreak, which could lead to significant absenteeism. With projections of 30% to 50% of the population potentially contracting the virus, experts emphasize the need for utilities to integrate pandemic planning into their existing emergency response plans. To mitigate risks, utilities should involve staff in planning, track attendance closely, and ensure the availability of essential supplies and backup strategies.

![3
November | December 2009
The process of creating teams may not
be as intuitive as it may seem at first. I’ve
learned some tough lessons from some
very unpleasant experiences that I’ve had
the misfortune of creating. I’ve learned
that several steps that make teams suc-
cessful also can lead them to failure if not
handled properly. They include
defining the objective;■■
setting realistic expectations;■■
identifying the teams’ and members’■■
roles, responsibilities, and decision-
making authority;
identifying the right composition of■■
the team;
communicating what’s going on to oth-■■
ers throughout the organization; and
choosing the right place to start the■■
work.
Framing the Objective
Before you can select team members,
you must know specifically what you
want the team to do. Most teams fail to
get anything done because their mem-
bers are not aligned with the purpose at
hand and don’t understand what they
are — and are not — supposed to do.
Linda and Ron Turner have stated that a
“fuzzy purpose statement leads to fuzzy
results” and that “mission creep occurs
when a team charter is too vague.” [See
Linda Turner and Ron Turner, “Creating
a Team Charter,” How to Grow Effective
Teams and Run Meetings That Aren’t a
Waste of Time (The Ends of the Earth
Learning Group 1998).]
Teams often are formed in haste
under a heightened sense of urgency
and without clearly defining their objec-
tive. The desire to get something done
quickly leads to teams being formed
prematurely. In the absence of clear
direction, they create their own purpose.
The manager who created the team
Creating High-Performing Teams continued from p. 1
More Things Utilities Should Know About Swine Flu
Does working for a water or wastewater utility put you at risk
in a swine flu outbreak? Only if your co-workers are showing
symptoms, experts said.
People don’t catch the flu from drinking water, said Michael
Zanker of the U.S. Office of Homeland Security. “THE H1N1
virus is a respiratory virus,” he noted. “It is typically transmitted
by coughing and sneezing.”
Similarly, while H1N1, like other viruses, may find its way
into wastewater, it requires no special handling procedures
beyond those already in place. “Contact with wastewater is
always to be avoided,” Zanker said. “Workers who follow stan-
dard safety procedures are [at] no greater risk if this virus is
added to the mix.”
Want to learn more? Additional information about the H1N1
flu pandemic and how your utility can prepare for it is available
at several Web sites:
Flu.gov
www.flu.gov
This is the U.S. federal government’s clearinghouse for
flu-related information.
Pandemic Influenza Preparedness, Response,
and Recovery Guide for Critical Infrastructure
and Key Resources
http://www.avianflu.gov/professional/pdf/
cikrpandemicinfluenzaguide.pdf
This is a publication from the U.S. Department of Homeland
Security’s Office of Infrastructure Protection.
Pandemic Flu Planning for the Water Sector
http://cfpub.epa.gov/safewater/watersecurity/pandemicflu.cfm
This is a U.S. Environmental Protection Agency Web page
offering free tools and guidance materials to help utilities
develop plans to prepare for and respond to pandemic influ-
enza outbreaks.
National Rural Water Association
www.nrwa.org
This is the National Rural Water Association (Duncan, Okla.)
Web site, where smaller utilities can find a pandemic influenza
checklist specifically for smaller systems and utilities.
tial functions in the planning process.
“They know better than anyone what
must be done,” Kempe said.
Once planning is complete, utilities
should develop internal and external
communications strategies and work
with community pandemic planners to
minimize an outbreak’s impact.
Internally, this includes everything
from promoting good handwashing
practices to sending employees home
at the first sign of flu symptoms. It
also means making sure that employ-
ees are educated on the H1N1 virus
and its transmission, particularly as it
relates to water and wastewater (see
sidebar, below).
What if your utility isn’t as prepared
as it should be?
“It is never too late to plan,” said
Robert Davis, director of external affairs
for the U.S. Department of Homeland
Security’s Office of Health Affairs. “There
are numerous pandemic flu documents
and readiness materials available online
to help. Utilities that have not yet done
so should start today.”
— Mary Bufe, UE](https://image.slidesharecdn.com/articlecreatinghighperformingteams-160425180309/85/Article-creating-high-performing-teams-3-320.jpg)


![11
November | December 2009
549 195-W solar panels on the roof of
its 2800-m3
/d (750,000-gal/d) Makena
Wastewater Reclamation Plant and two
pump stations.
The reclamation plant serves
Dowling’s 730-ha (1800-ac) Makena
Resort in Maui, which includes the
beachfront Maui Prince Hotel and two
18-hole golf courses.
In Hawaii, energy is a limited resource
with high costs, explained Jennifer
Stites, green development manager at
Dowling. “In Maui, we pay 30 cents a
kilowatt hour,” she said. “Over 90% of
our energy we receive is through burn-
ing diesel. Boats have to bring it in, and
needless to say, this is not the best
thing to do environmentally.”
The solar panels, installed in May,
have proven to be a more ecofriendly
alternative to diesel by supplying
150,000 kWh annually, or roughly 75%
of the energy needed to operate the
reclamation plant. The facility is also on
a net metering system, so only enough
energy needed to sustain the plant
is produced. The net metering also
serves as a no-cost way of banking
excess electricity production for future
retail credit.
“For us, net metering was the most
cost-effective,” Stites said.
Dowling spent $1 million on its solar
project but received rebates in the form
of federal tax (30% of total cost) and
state tax credits (35% of total cost) to
help fund the project. Stites said the
return on investment for the solar power
project with tax credits will be approxi-
mately 7 years.
The first phase is complete. The sec-
ond phase will entail the installation of
498 additional panels, thereby increas-
ing the total system size from 107 kW to
204 kW. This phase will be done in 2 to
3 years “after we build up the rest of the
resort,” Stites said. Also, the hope is to
one day make the entire resort a zero-en-
ergy community through a roof-mounted
photovoltaic solar farm, she said.
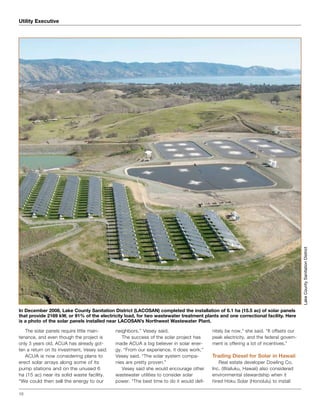
The Biggest in the West
Like Dowling, Lake County (Calif.)
Sanitation District also has entered
the solar energy arena in a big way. In
December 2008, it completed installa-
tion of 6.1 ha (15.5 ac) of solar panels
that provide 2169 kW, or 91% of the
electricity load, for two wastewater
treatment facilities — the Northwest
Wastewater Plant and the Southeast
Wastewater Plant — and one correc-
tional facility. The project has been cited
as the biggest local public agency instal-
lation in the western United States, said
Mark Dellinger, special districts adminis-
trator for Lake County.
Dellinger said the solar panel instal-
lation is an extension of the county’s
belief in energy efficiency and sustain-
ability that began with its participation in
the Southeast Geysers Effluent Pipeline
Project, which pumps treated waste-
water 50 km (30 mi) through pipelines
to recharge geysers. The project also
serves as a source for geothermal ener-
gy for the region.
Thanks to both the geysers and solar
power projects, “our entire county has
a net surplus of renewable energy,”
Dellinger said.
Lake County’s solar energy project
was 4 years in the making, though the
sanitation district did not first consider
solar energy when it was seeking a
viable, cost-effective renewable energy
source. The district had hoped to install
a microturbine along the geyser recharge
pipeline, but a feasibility study showed
that it would take too long to get a return
on investment, Dellinger said.
The county also considered wind
energy but discounted it because there
was not good wind potential at any of
the prospective locations, and the dis-
trict administrators did not like the visual
impact of wind turbines, Dellinger said.
Lake County finally decided to use solar
power after visiting several solar power
installations in California.
Along the way, the Lake County
Correctional Facility joined the project
because it had similar energy needs.
“Of all the agencies in Lake County, we
have the highest electricity bills because
of the amount of water we pump daily,”
Dellinger said. “When we told the [board
of supervisors] about our project idea,
they suggested including the jails,
because they have high electricity bills
too.” However, the jails did not have
enough land for solar arrays. “But luckily
they were next door to one of our facili-
ties, so they could just use the energy
from the arrays near one of our plants,”
Dellinger explained.
Dellinger said the sanitation district
went through a competitive selection
process and decided to give the con-
tract to SunPower Corp. (San Jose,
Calif.), which agreed to own, operate,
and maintain the solar arrays but sell
the electricity to the sanitation district
and the correctional facility. “We felt
that because neither our agency nor
the sheriff’s office had large capital,
we should go with a purchasing agree-
ment,” he explained.
The installation took 6 months to
complete and only had a few small con-
struction complications, such as under-
ground utilities that had to be relocated
and high clay content in some of the soil
that required special handling and exca-
vation, Dellinger said. In the end, 9430
panels were installed.
“These solar panels … track the sun
on a daily basis, which I heard increases
their output of energy between 20% to
30% more than a fixed array,” Dellinger
said. “You can hear and see them slowly
moving when you go out there.”
Dellinger estimates that the two
WWTPs are saving annually between
$20,000 and $30,000, because they
are buying electricity from SunPower
instead of the local utility company. He
also said that though SunPower receives
the renewable energy credits and tax
breaks, “there will be times when there
is [an electricity] surplus, and it can go
back to the utility power grid. Through a
net metering agreement, the sanitation
district receives credit for it through a
‘true-up process’ that is accessed at the
end of the year.”
Dellinger said the sanitation district is
evaluating the possibility of adding more
solar capacity to its Middletown waste-
water facility in conjunction with plant
upgrades. “Though we may have to fund
that through another purchasing agree-
ment,” he said.
– LaShell Stratton–Childers, UE](https://image.slidesharecdn.com/articlecreatinghighperformingteams-160425180309/85/Article-creating-high-performing-teams-11-320.jpg)


![EMERGENCY_RESPONSE_AND_PREPAREDNESS[1].pptx](https://cdn.slidesharecdn.com/ss_thumbnails/emergencyresponseandpreparedness1-230615191706-0540bd5e-thumbnail.jpg?width=640&height=640&fit=bounds)

![Pandemic Handbook Desktop 2009[1]](https://cdn.slidesharecdn.com/ss_thumbnails/pandemichandbookdesktop20091-12544398005102-phpapp01-thumbnail.jpg?width=640&height=640&fit=bounds)