
Recommended
More Related Content
More from Michael (Mike) Harwood, PE, PMP
More from Michael (Mike) Harwood, PE, PMP (20)
Recently uploaded
Recently uploaded (20)
Art6 slide3
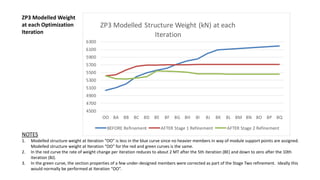
- 1. ZP3 Modelled Weight at each Optimization Iteration NOTES 1. Modelled structure weight at Iteration “OO” is less in the blue curve since no heavier members in way of module support points are assigned. Modelled structure weight at Iteration “OO” for the red and green curves is the same. 2. In the red curve the rate of weight change per iteration reduces to about 2 MT after the 5th iteration (8E) and down to zero after the 10th iteration (8J). 3. In the green curve, the section properties of a few under-designed members were corrected as part of the Stage Two refinement. Ideally this would normally be performed at Iteration “OO”. 4500 4700 4900 5100 5300 5500 5700 5900 6100 6300 OO 8A 8B 8C 8D 8E 8F 8G 8H 8I 8J 8K 8L 8M 8N 8O 8P 8Q ZP3 Modelled Structure Weight (kN) at each Iteration BEFORE Refinement AFTER Stage 1 Refinement AFTER Stage 2 Refinement