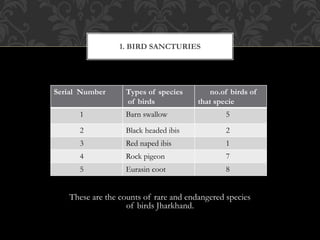
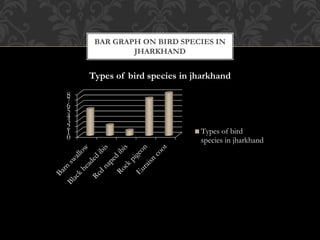
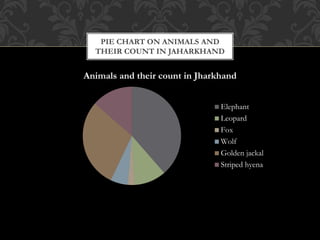
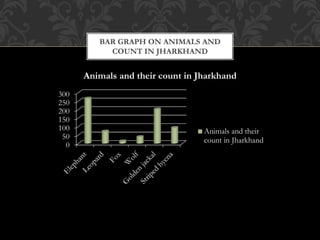
G. Ramu, a 10th grade student from Paramita Heritage School, did an art integrated project on Jharkhand for their math class. The project provided information on the unique culture and wildlife of Jharkhand, including various species of animals and birds found there. Data was collected on populations of different bird and animal species in Jharkhand and represented in tables, pie charts, and bar graphs. Through this project, G. Ramu learned how to create presentations with different data visualization elements like charts and graphs.


![Art integration project science[1].pptx](https://image.slidesharecdn.com/artintegrationprojectscience1-231026174944-1c18c54f/85/Art-integration-project-science-1-pptx-16-320.jpg)
![Art integration project science[1].pptx](https://image.slidesharecdn.com/artintegrationprojectscience1-231026174944-1c18c54f/85/Art-integration-project-science-1-pptx-17-320.jpg)


