Download to read offline
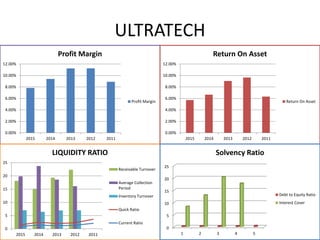

This document shows various financial metrics for Ultratech over the years 2011-2015. The profit margin and return on asset have fluctuated over the years between 0-12%. The liquidity ratios including receivable turnover, average collection period, inventory turnover, quick ratio and current ratio are shown for the years 2011-2015 with most values between 0-25. The solvency ratios of debt to equity ratio and interest cover are shown but no values are provided.