Download as PDF, PPTX

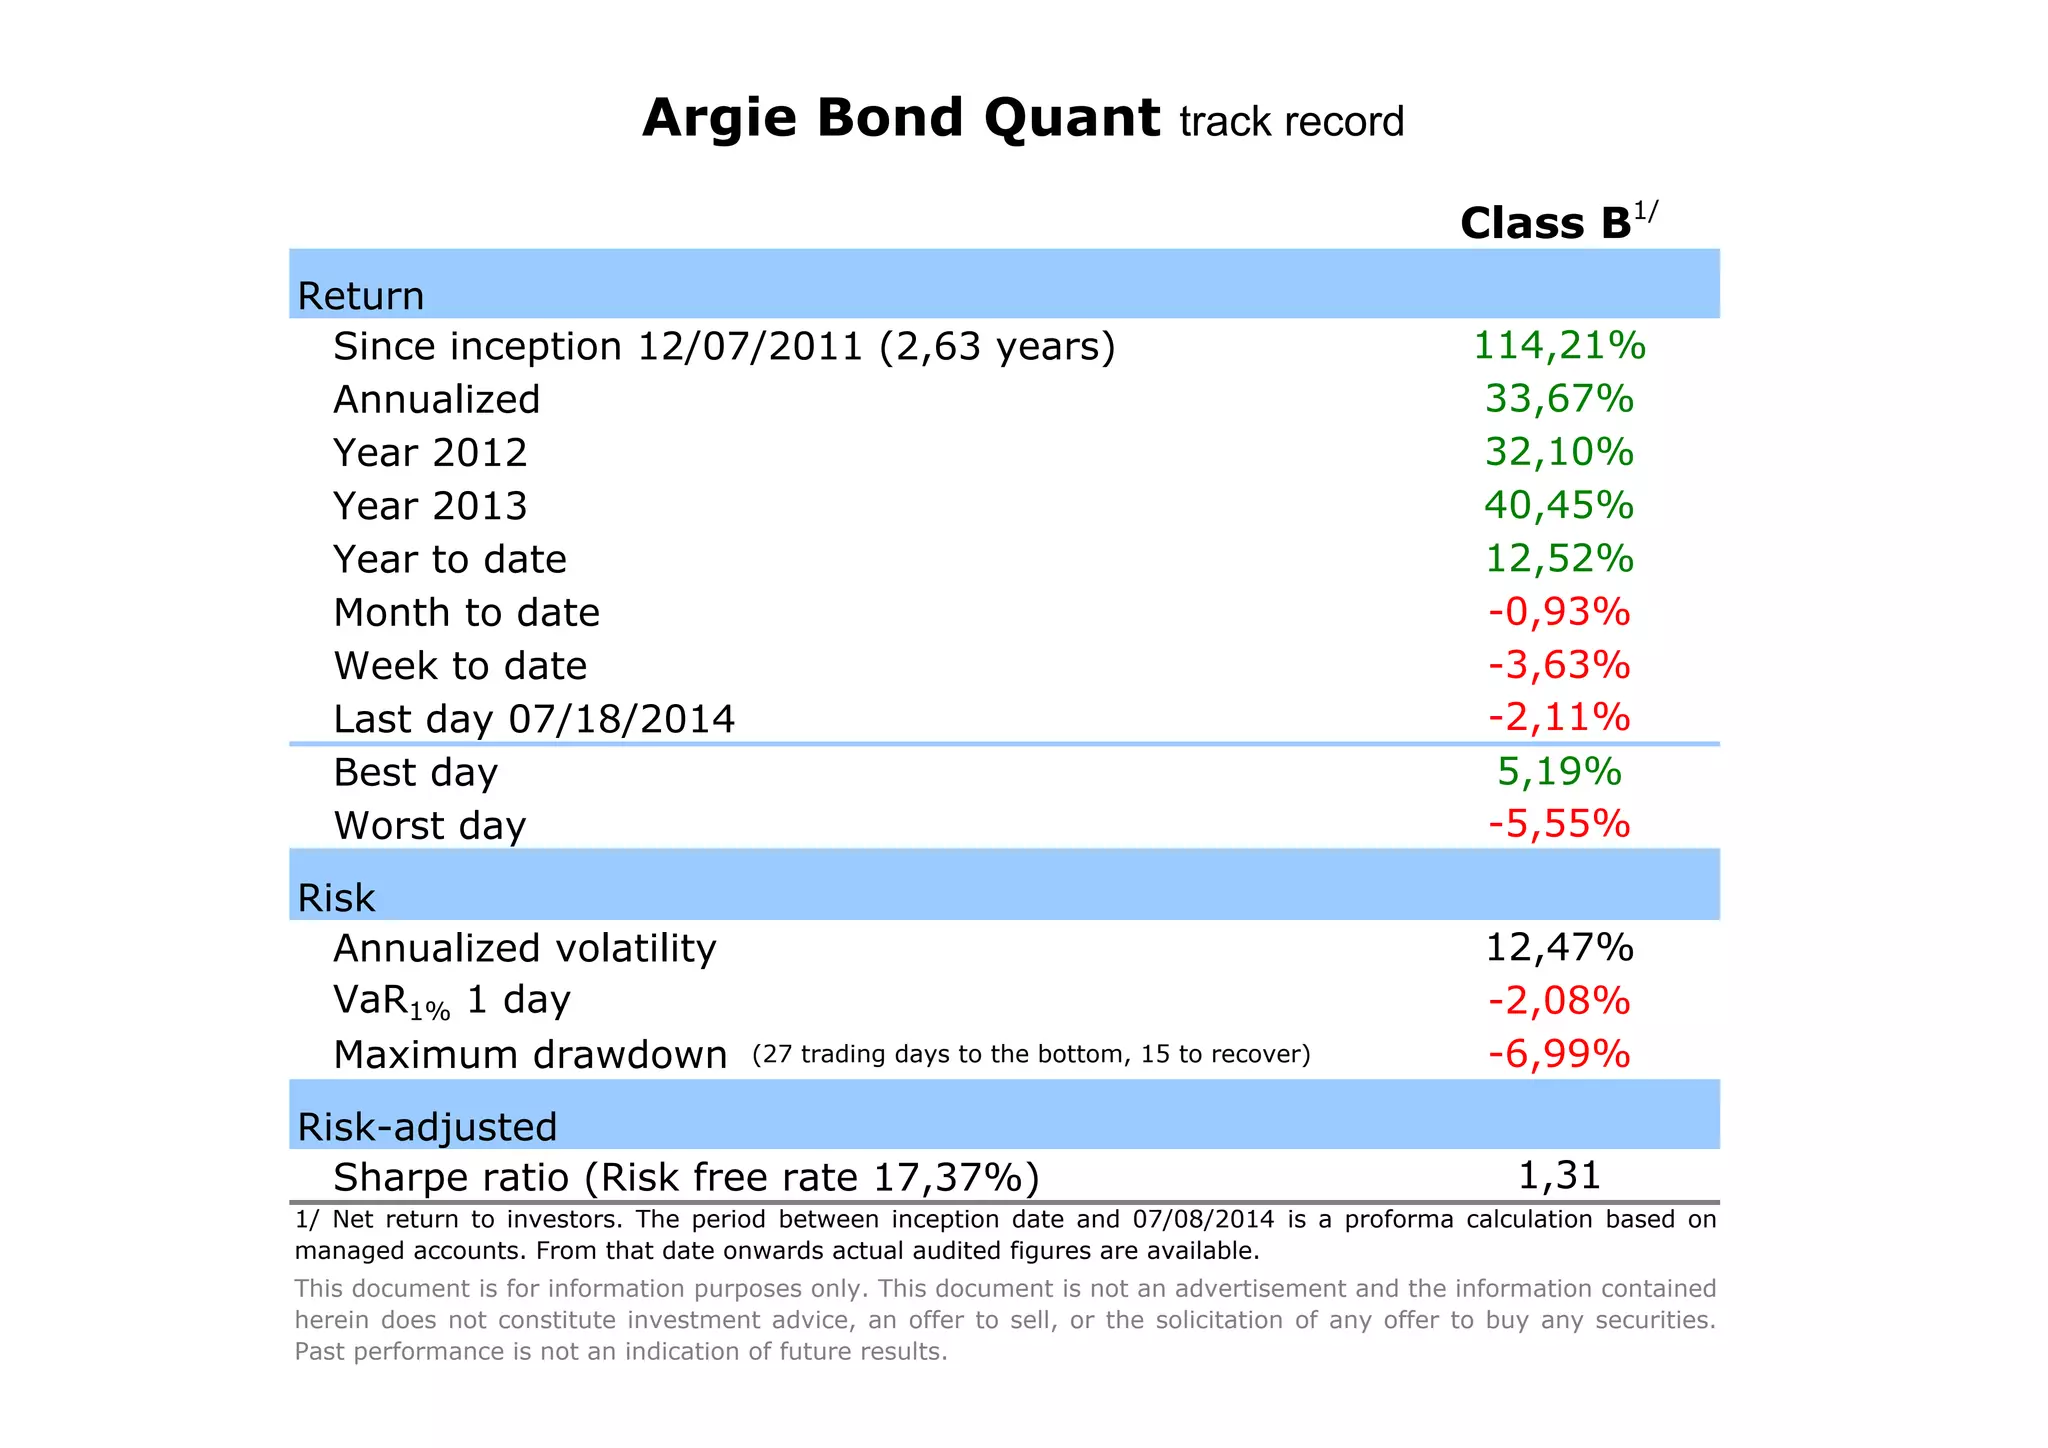
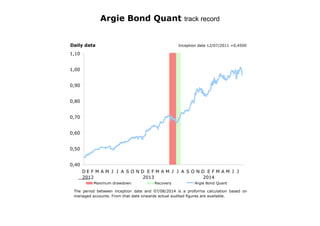
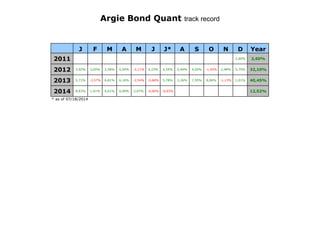

The document provides a performance overview of the Argie Bond Quant investment strategy since its inception on December 7, 2011, highlighting annualized returns, risk metrics, and maximum drawdowns. It includes both proforma calculations for the period prior to July 8, 2014, and actual audited figures thereafter. It emphasizes that the information is for informational purposes only and does not constitute investment advice.


