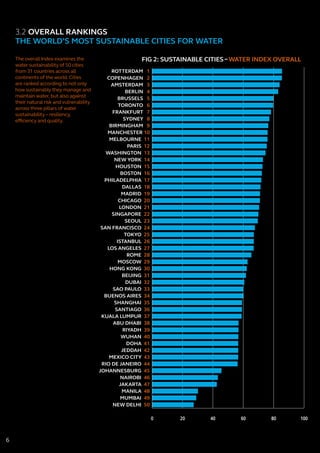
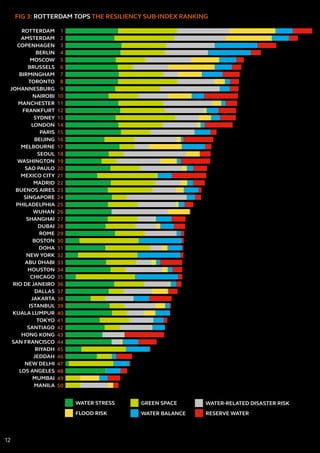
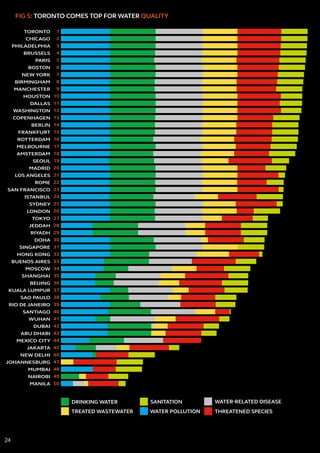
2. CONTENTS
1. FOREWORDS
2. EXECUTIVE SUMMARY
3. CITIES WATER INDEX
3.1 WHAT DO WE MEAN BY
WATER SUSTAINABILITY?
3.2 OVERALL RANKINGS
3.3 RESILIENCY SUB-INDEX
3.4 EFFICIENCY SUB-INDEX
3.5 QUALITY SUB-INDEX
4. HOW CITIES CAN
SUSTAINABLY HARNESS
THEIR WATER ASSETS FOR
LONG TERM SUCCESS
4.1 WATER CHALLENGES
FACING CITIES
4.2 HOW TO CREATE A
SUSTAINABLE WATER
FUTURE FOR CITIES
4.3 CONCLUDING REMARKS
– WHAT NEXT FOR
WATER CITIES?
5. APPENDIX
5.1 METHODOLOGY
5.2 FURTHER READING
CITIES: WATER HUBS
Great cities are defined and illuminated by the water that surrounds
them or flows through them. Be it the harbors of New York, the
river estuaries of London, the Amsterdam canals, the waterfronts of
Doha or the beaches of Sydney, water is what gives a city its unique
magnetism and attraction factor.
Cities are rarely spontaneous creations. They are often strategic
settlements grounded by access to water and linked by transportation,
trade and commerce. The historical positioning of cities proximate to
fresh and navigable waters enabled settlements to flourish, grow and
prosper. Now more than ever, cities, their waterscapes and water sources
face challenges: water demand is rising, aquifers are being depleted and
the threat of extreme weather is increasingly real.
The right balance is a tough one to strike; cities can be overburdened
with too much water or stressed without enough. Urbanization causes
further demand for drinking water as well as sanitation and the need
for additional water sources, while increasing impermeable areas that
can contribute to flooding. Cities are responsible for protecting their
citizens from pollutants, disease and destructive storm surges. Many are
struggling and many more are vulnerable.
Cities which carefully and creatively use their water assets for strategic
urban advantage will ultimately be more livable, safe and competitive.
Cities that are truly distinguished by a thriving relationship with their
waterscape can make a huge contribution to the quality of life of their
residents, attract tourism and investment. Hungarian physiologist and
Nobel Prize winner Albert Szent-Gyorgyi famously said ‘water, the hub
of life’. So, too, cities are renowned for being hubs of knowledge, art
and commerce that can further enrich and inspire as they leverage their
position as water hubs.
The World Economic Forum named water crises as one of the top three
highest global risks to economies, environments and people, in terms
of impact in 2016. Water demand issues and climate change risks are
happening right here and right now. The cities that best understand this
and act first will be the ones that not only help save the planet from an
impending water crisis, but will also be the first to attract investment and
improve their competitive position.
This report seeks to expand on our annual Sustainable Cities Index to
focus solely on water and identify which city is harnessing its water
assets to its greatest long term advantage. It is our hope that city leaders
find this ranking to be a valuable tool in helping them to think of water
as an opportunity and as a resource for economic development while
also meeting the critical needs and safety of their residents and the
environment.
John Batten
Global Director of Water and Cities
1. FOREWORDS
2
3. GUEST FOREWORD
SUSTAINABLE
DEVELOPMENT FOR
WATER WISE CITIES
Cities are continuously changing dynamic systems that bring
together many strands of societies and economies. They are hubs of
productivity, ideas, creativity, socio-economic development and, at
their best, desired places for people to live and thrive. Today half of
humanity lives in cities and this is set to grow to 80% in the decades
to come. Most of the urbanization is happening rapidly in developing
and emerging economies resulting in major pressures on fresh water
supplies, used water collection and treatment, air and water quality
and public health.
The global community has recognized this and captured it in the United
Nation’s Sustainable Development Goal 11 focusing on making cities
inclusive, safe, resilient and sustainable. Agreed upon by governments
around the world, this Sustainable Development Goal aims to, amongst
other things, reduce the impact of (water related) disasters, reduce the
environmental impact of cities and increase the universal access to green
and public spaces. To achieve these objectives we have to put water at the
center stage of urban development.
Water’s role in sustainable development is further emphasized in
Sustainable Development Goal 6: Ensuring safe access to water and
sanitation for all. The focus here is on achieving universal and equitable
access to safe and affordable drinking water as well as adequate and
equitable sanitation and hygiene for all. This simultaneously aims to
improve water quality by reducing pollution and halving current levels of
untreated wastewater, while substantially increasing recycling and safe
water reuse. In addition, governments have set the target to protect and
restore water-related ecosystems including wetlands, rivers, lakes and
aquifers.
These global goals form an ambitious agenda for city leaders to deliver
progress on - without it the sustainable socio-economic development of
cities is unlikely to happen. No two cities are alike or will follow the same
development path. Exchange of experiences, know-how and expertise
between cities plays a crucial role in learning and adapting to changing
conditions.
The Sustainable Cities Water Index is an offering to foster such
cooperation. Working with and making comparison between peer-
cities creates the awareness, insight and foresight needed to build the
sustainable and water wise cities of the future. It is by using such metrics
that cities can show citizens and investors how their water resiliency,
water efficiency and water quality makes them attractive and world class.
Dr. Ger Bergkamp
Executive Director, IWA – International Water Association
3
4. 2. EXECUTIVE SUMMARY
• For centuries water has helped shape many of the world’s greatest
cities, be it as a source of drinking water, an access to trade routes or as
a means of protection against attack.
• Water remains a critical strategic issue today as city leaders seek to
balance the priorities of giving citizens and commerce access to clean
water, disposing of wastewater, while also protecting them from the
dangers of having too much through floods and extreme weather.
• The Arcadis Sustainable Cities Water Index assesses 50 global cities
by the stewardship of their water across issues impacting their water
resiliency, efficiency and quality to show which cities are best positioned
to harness water for their long term success.
• The report finds that European cities lead the way on the overall
sustainability of their water systems and management, holding seven
of the top ten places, with Rotterdam, Copenhagen and Amsterdam
taking the top three rankings. However the low placings of cities like
London (21st) and Rome (28th) show that additional investment is
needed elsewhere in Europe.
• In North America, Toronto (6th), Washington DC (13th) and New York
(14th) perform well overall. Los Angeles ranks second for efficiency,
while Chicago and Philadelphia rank second and third for quality.
Overall, American cities show their vulnerability to natural disasters
and extreme weather with seven U.S. cities in the bottom half for
resiliency.
• Asian cities trail their western counterparts by some distance overall,
with Singapore (22nd), Seoul (23rd), Tokyo (26th) and Hong Kong (30th)
the highest ranked in the middle order of the Index. Poor sanitation and
insufficient treatment of wastewater see many other Asia cities near
the bottom such as New Delhi (50th) and Mumbai (49th). Manila (48th)
ranks lowest for resiliency and quality.
• Dubai (32nd) is the highest ranked Middle Eastern city, but other cities
rank lower due to the many water management challenges in the hot,
desert climate.
• The Australian cities of Sydney (8th) and Melbourne (11th) score well
thanks to efficient water systems and investment in desalination that
creates better water conditions.
• Latin American cities feature in the bottom half of the Index too.
Buenos Aires (33rd) is the highest placed, but Rio de Janeiro (44th)
places near the bottom. New investment is needed to boost water
quality, particularly in wastewater treatment and sanitation.
• The African cities of Johannesburg (45th) and Nairobi (46th) perform
well when it comes to resiliency due to geographic advantage but are
held back by inefficiency and poorer water quality.
• Overall, cities need to make greater investment to improve their
resiliency to extreme weather events and unforeseen water shortages.
In order to achieve long term viability, city leaders need to pay close
attention to each area of water sustainability for it to be as much part
of shaping their city’s future as it was of its past.
4
5. 3. CITIES WATER INDEX
3.1 WHAT DO WE MEAN BY WATER
SUSTAINABILITY?
The way in which cities manage their water has a lot to do with their
ability to attract and retain businesses and residents, to encourage
economic growth, and to compete on the global stage. Top cities
understand and address their water in a sustainable manner. This
means efficiently providing safe, reliable, and easily accessible water to
residents and businesses; reliable access to sanitation, and protecting
waterways from pollution. It also means being resilient and adaptable
to extreme weather events and climate change that may contribute to
issues such as flooding and scarcity.
Each of the 50 cities included in this Index have distinctive water
relationships that helped shape their urban character and define their
commercial identity and competitiveness. In order to analyze their
management of water and whether it is sustainable, this report breaks
down water sustainability into three core elements:
RESILIENCY EFFICIENCY QUALITY
Water resources,
water related disaster
risks, vulnerabilities
Leakage, metering
water reuse, continuity
coverage, charges
Health, sanitation,
pollution,
environmental effects
THE RESILIENCY
SUB-INDEX
INCLUDES:
• water stress
• green space
• water-related
disaster risk
• flood risk
• water balance
• water reserves.
THE EFFICIENCY
SUB-INDEX
INCLUDES:
• leakage
• water charges
• service continuity
• wastewater reuse
• metered water
• drinking water
• sanitation.
THE QUALITY
SUB-INDEX
INCLUDES:
• drinking water
• sanitation
• treated wastewater
• water-related disease
• water pollution
• threatened freshwater
species.
This Index was prepared in partnership with the Centre for Economics
and Business Research (CEBR) and gauges the sustainability of city
waterscapes overall, as well as focusing on each sub-index measure as
well. The Index is not intended to be a “report card” on how well
municipal water utilities do their jobs nor is it a verdict of a city’s
achievement. It as a tool to help inform future improvement and
long term water sustainability.
5
FIG 1.THREE ELEMENTS TO A SUSTAINABLE WATER FUTURE
6. 3.2 OVERALL RANKINGS
THE WORLD’S MOST SUSTAINABLE CITIES FOR WATER
The overall Index examines the
water sustainability of 50 cities
from 31 countries across all
continents of the world. Cities
are ranked according to not only
how sustainably they manage and
maintain water, but also against
their natural risk and vulnerability
across three pillars of water
sustainability – resiliency,
efficiency and quality.
FIG 2: SUSTAINABLE CITIES –WATER INDEX OVERALL
0 20 40 60 80 100
NEW DELHI 50
MUMBAI 49
MANILA 48
JAKARTA 47
NAIROBI 46
JOHANNESBURG 45
RIO DE JANEIRO 44
MEXICO CITY 43
JEDDAH 42
DOHA 41
WUHAN 40
RIYADH 39
ABU DHABI 38
KUALA LUMPUR 37
SANTIAGO 36
SHANGHAI 35
BUENOS AIRES 34
SAO PAULO 33
DUBAI 32
BEIJING 31
HONG KONG 30
MOSCOW 29
ROME 28
LOS ANGELES 27
ISTANBUL 26
TOKYO 25
SAN FRANCISCO 24
SEOUL 23
SINGAPORE 22
LONDON 21
CHICAGO 20
MADRID 19
DALLAS 18
PHILADELPHIA 17
BOSTON 16
HOUSTON 15
NEW YORK 14
WASHINGTON 13
PARIS 12
MELBOURNE 11
MANCHESTER 10
BIRMINGHAM 9
SYDNEY 8
FRANKFURT 7
TORONTO 6
BRUSSELS 5
BERLIN 4
AMSTERDAM 3
COPENHAGEN 2
ROTTERDAM 1
6
7. EUROPEAN CITIES LEAD
THE WAY
European cities dominate the
overall rankings, taking seven of
the top ten places. Many of these
cities have mature water systems
that have been built up over a
long period of time, many times in
response to challenges they have
faced with water. The Dutch cities
of Rotterdam and Amsterdam, for
example, place at first and third
respectively, having overcome
challenges such as flooding in the
last century.
In general, European cities
have high water quality through
well-established drinking water
supply, sanitation and wastewater
treatment systems. It is in the area
of efficiency that some European
cities are challenged. London,
at 21st, is behind fellow UK
cities Birmingham (9th) and
Manchester (11th).
Berlin (4th) is amongst the most
consistent overall performing cities
across all categories. The German
capital is also one of the most
resilient cities in the world due,
in part, to its low susceptibility
to natural disasters.
NORTH AMERICA–THE
EAST COAST PERFORMS
HIGHER THAN THE WEST
No U.S. city makes it into the
Index’s overall top ten, with the
East Coast hubs of Washington
DC (13th) and New York (14th)
performing significantly
better than their West Coast
counterparts. Cities in California
are hampered mainly by their
vulnerabilities to resiliency, such as
a higher susceptibility to drought
and natural disasters.
ASIA-PACIFIC –A MIXED
PICTURE
It is a rather mixed picture for
Asian cities when it comes to water
sustainability. Four emerging
economy cities - Jakarta (47th),
Manila (48th), Mumbai (49th) and
New Delhi (50th) finish out the
overall ranking, others in Asia
fair better.
Tokyo (26th overall) has one of the
best efficiency scores in the world
despite lack of wastewater reuse,
reserve water and greenspace.
Furthermore, Singapore (22nd)
does well with the elements
over which it has control such
as leakage, treatment and
metering, despite its geographic
vulnerability regarding flood
risk and water reserves.
The Australian cities of Sydney
(8th) and Melbourne (11th)
score well thanks to investment
in efficient water systems and
desalination creating better future
water conditions.
LATIN AMERICA-
UNDERPERFORMING
Latin American cities underperform
when it comes to their overall
water sustainability with each
location featuring relatively low
in the Index due to geographic
vulnerabilities to flooding
and drought as well as lack
of investment.
Efficiency is a particular issue
for Buenos Aires (33rd). The
Argentinian capital has the lowest
instance of water metering in
the Index despite its issues with
leakage due to aging water
infrastructure. Mexico City (43rd)
performs better than most Latin
American cities for efficiency due,
in part, to its water charges.
MIDDLE EAST–
GEOGRAPHICALLY
CHALLENGED
Due to its arid climate Middle East
Cities face unique challenges, even
the regional powerhouses of Dubai
(32nd) and Doha (42nd) featuring in
the lower end of the overall Index.
7
8. CITY PROFILE: ROTTERDAM
Overall ranking: 1 Resiliency: 1 Efficiency: 15 Quality: 16
As the highest ranking city in this Index, Rotterdam has the best
balance among the three indices. It is in many ways a leading global
city in urban resiliency and sustainability.
The city has been innovative and proactive in its approach to water
resiliency; implementing a Chief Resilience Officer and works on
implementation of the Rotterdam Adaptation Strategy. Driving
global best practices on resiliency, the city shares its knowledge
with other cities in the Connecting Delta Cities program of the C40,
as well as in the Rotterdam Center for Resilient Delta Cities, and is
visited by numerous water-oriented delegations all year round.
Some of the features that Rotterdam is particularly proud of
include its floating water pavilion, multifunctional flood protection,
the water plaza and water storages under the central station and
Museum Park Garage.
Additionally, with heavy investment in its reservoir catchment
system, Rotterdam is among the highest in the world in water
reserves. Lead by Evides, a world-leading water utility committed
to sustainable water practices, Rotterdam is working on large-scale
water reuse for industrial wastewater, which could further improve
future sub-rankings and ensure greater sustainability as reuse is
statistically an indicator for Rotterdam that is slightly below other
indicators.
CITY PROFILE: BOSTON
Overall ranking: 16 Resiliency: 30 Efficiency: 19 Quality: 6
Boston, for a long period of its history, experienced water quality
issues in Boston Harbor as it grew due to the discharge of raw
sewage and its status as a major port. In recent decades the water
quality has significantly improved, and Boston Harbor, as well as the
Charles River and other water bodies, have been transformed.
Since the creation of the Massachusetts Water Resources Authority
in 1985, the city has invested billions on wastewater treatment
through creation of facilities such as a new Deer Island Treatment
Plant, increasing the reliability and volume of wastewater
treatment, while at the same time reducing combined sewer
overflows.
Rates of water treatment, waterborne diseases, and coverage
for drinking water and sanitation are in line with other developed
cities, due to investment in the high quality reservoirs and water
treatment. Resiliency ranked low relative to the other two
indicators, particularly with respect to green space and flood risk.
However, Climate Ready Boston aims to reduce vulnerability to
climate change impacts.
8
9. CITY PROFILE: SYDNEY
Overall ranking: 8 Resiliency: 13 Efficiency: 4 Quality: 25
Located on Australia’s East Coast, Sydney surrounds the world’s
largest natural harbor and has a number of tributaries and
waterways associated with it. The world famous Sydney Harbor
Bridge and iconic Sydney Opera House are both clearly identified
side by side to their water surroundings.
Sydney is committed to diversifying its water portfolio through
efforts such as desalination and asset management. Billions of
dollars in investment in desalination works to secure the supply
against climate change. Sydney has a Chief Resiliency Officer as
it is susceptible to natural disasters and is committed to ensuring
a sustainable water supply. The city experiences moderate water
stress, however their water reserves are higher compared to most of
the Indexed cities, as is their green space.
CITY PROFILE: SINGAPORE
Overall ranking: 22 Resiliency: 24 Efficiency: 13 Quality: 31
Singapore, the top ranking Asian city in this Index, has made vast
improvement over the past several decades to become a regional
water hub.
Where Singapore has control – that is, treatment, universal
coverage, metering, wastewater reuse, and leakage, it receives high
marks. However, it does not have control over its physical location,
which leaves it vulnerable to flood risk and naturally dependent
on foreign freshwater sources. However even on these fronts
Singapore has invested, as exampled by projects such as the Marina
Bay and the evaluation of diversified storage options such as sub-
terrain caverns upon recognition of their limited storage options.
Under the leadership of PUB, the nation’s utility, the island nation
has gone from one extremely vulnerable to an innovator in many
areas. PUB has also overcome many negative public perceptions of
potable water reuse, allowing them to provide high quality water
to consumers via reuse. Pre-treatment, the source water is highly
polluted, as urban runoff is exposed to many manmade sources
of phosphorus and sediment leading to urban runoff challenges
alongside others such as water stress and reserve water.
Singapore is a water-stressed country-city. Water dominates its
security policies with Singapore adopting a ‘close the water loop’
strategy: maximize yield ‘collect every drop’, reuse endlessly and
drink seawater.
9
11. A water resilient city is well prepared to
overcome the challenges associated with both
too little as well as too much water. It protects
its citizens against disasters such as flooding
and drought, while ensuring that water-related
services continue undisrupted. Even in the face
of crises, a water resilient city should be adapted
to recover quickly.
As a result of climate change, soil subsidence,
coastal erosion and urbanization, extreme
weather events and water scarcity are becoming
more commonplace in many cities, particularly
those located in coastal or riverine areas.
Furthermore, the Index highlights a significant
gap between the top performers and the
rest of the world. Floods, sea level rise and
coastal erosion risks are just some of the
growing concerns to many of these lower
performing cities.
3.3 WATER
RESILIENCY
SUB INDEX
11
12. FIG 3: ROTTERDAM TOPS THE RESILIENCY SUB-INDEX RANKING
MANILA
MUMBAI
LOS ANGELES
NEW DELHI
JEDDAH
RIYADH
SAN FRANCISCO
HONG KONG
SANTIAGO
TOKYO
KUALA LUMPUR
ISTANBUL
JAKARTA
DALLAS
RIO DE JANEIRO
CHICAGO
HOUSTON
ABU DHABI
NEW YORK
DOHA
BOSTON
ROME
DUBAI
SHANGHAI
WUHAN
PHILADELPHIA
SINGAPORE
BUENOS AIRES
MADRID
MEXICO CITY
SAO PAULO
WASHINGTON
SEOUL
MELBOURNE
BEIJING
PARIS
LONDON
SYDNEY
FRANKFURT
MANCHESTER
NAIROBI
JOHANNESBURG
TORONTO
BIRMINGHAM
BRUSSELS
MOSCOW
BERLIN
COPENHAGEN
AMSTERDAM
ROTTERDAM 1
2
3
4
5
6
7
8
9
10
11
12
13
14
15
16
17
18
19
20
21
22
23
24
25
26
27
28
29
30
31
32
33
34
35
36
37
38
39
40
41
42
43
44
45
46
47
48
49
50
WATER STRESS GREEN SPACE WATER-RELATED DISASTER RISK
FLOOD RISK WATER BALANCE RESERVE WATER
12
13. Rotterdam and Amsterdam,
although both below sea level, are
the top two performers on the
water resiliency sub-index. These
locations are well known for their
excellent water management and
robust flood protection practices.
The Netherlands maintains a
continuous investment program
in dikes, dunes and flood barriers,
thus being considered the safest
delta on Earth.
The presence of parks and green
space – creating stormwater
storage capacity and helping to
battle the urban heat island effect
– helps make cities more resilient.
Therefore, the lack of green space
impacts many major Middle
Eastern and Asian cities such as
Tokyo, Shanghai, Dubai and Doha.
Los Angeles’ low ratings for
reserve water, as it draws 85%
of its drinking water supplies
from sources hundreds of miles
away in northern California and
the Colorado River, and water
stress, contribute to its lower
ranking in resiliency as the region
is susceptible to drought and
is geographically vulnerable to
natural disasters. In a broader
sense, some U.S. cities’ lack
of green space impacts their
resiliency. U.S. cities also score
lower than most European cities
on flood risks given their lower
protection standards.
Unsustainable levels of extraction
from scarce groundwater sources
lead to severe water stress,
explaining the presence of desert
cities like Jeddah and Riyadh at
the lower end of the resiliency
rankings. The vulnerability of some
of the Pacific Rim cities such as
Manila, Jakarta, and Hong Kong
to major storms and floods is
reflected in the ranking.
CITY PROFILE: DALLAS
OVERALL RANKING: 18 RESILIENCY: 37 EFFICIENCY: 18 QUALITY: 11
Dallas is unique in that it is susceptible to not only floods along the Trinity River
basin, but also drought. Both these issues provide serious consequences for the
city’s infrastructure, residents and businesses. The city has invested heavily in the
construction of reservoirs due to high demand brought on by increased urbanization.
Dallas outranks its regional counterparts for reservoirs in the city’s vicinity and
promoting improved conservation by adopting an irrigation ordinance which included
time-of-day watering restrictions. The city’s water reuse ranks below the Californian
cities in the Index which has impacted its resiliency rating.
13
14. CITY PROFILE: NEW YORK
Overall ranking: 14 Resiliency: 32 Efficiency: 14 Quality: 7
New York City demonstrates strengths with respect to low levels of
water pollution, non-revenue water, drinking water and sanitation.
Extensive pretreatment and source control programs, reductions
in combined sewer overflows, as well as reduction of nitrogen
discharges to Western Long Island Sound and portions of Jamaica
Bay via the Nitrogen Control Program have led improving water
quality over the years. The primary source of drinking water is the
Catskill/Delaware water supply, which is of such high quality that
New York City is one of only five large cities in the U.S. with a surface
water supply not requiring filtration. However, like many other U.S.
cities, the City’s per capita water consumption rates are higher than
other comparable large metropolises outside of the U.S. and it does
not reuse significant amounts of treated wastewater.
14
15. CASE STUDY: PREPARING NEW YORK
FOR A RESILIENT FUTURE
Further, the city was recognized to be vulnerable to flooding and
other climate change impacts, particularly in the aftermath of
Superstorm Sandy. Sandy was the second costliest hurricane in
United States history. Manhattan’s economy endured devastating
effects during and after the storm; The New York Stock Exchange
closed for a week, neighborhoods and businesses were ruined and
transportation systems, such as parts of the subway, flooded. The
shocking effects brought to the forefront New York’s vulnerability
to coastal flooding on its unprotected coastline and its need for
resilience. It is estimated that if no action is taken, New York will
incur at least $500 million in damages over the next 50 years
accompanied by ripple effects across the global economy.
In response to the storm, the U.S. Department of Housing and
Urban Development (HUD) launched a competition, Rebuild by
Design, to bring together the best and brightest ideas to protect the
Northeast United States from the next big storm. Along with the
Bjarke Ingels Group (BIG), Arcadis and partners were the selected to
design resilient infrastructure in New York City.
The winning solution, ‘The Big U’ aka the Dryline, envisioned a
protective system around Manhattan to protect the millions who
live, work and visit there.
The East Side Coastal Resiliency project is the first step to
realizing the vision of the Big U and a resilient New York City.
Arcadis and partners developed feasibility and conceptual design
reports to provide flood protection and social infrastructure for
200,000 residents and 21,000 business in the area. A range of
multifunctional resiliency solutions integrated with neighborhood
and community amenities improve community access and expand
enjoyment of parks and recreational spaces.
The results are groundbreaking and highly acclaimed: the Big U will
increase resilience and protection for residents of the Big Apple and
present significant cost savings for the city.
15
17. HOW EFFECTIVE ARE THE WORLD’S CITIES AT
MANAGING THEIR WATER SUPPLIES?
Clean, usable water is an extremely valuable
resource that is essential to the health of a city’s
citizens and economy. Efficient and controlled
management of this resource is, therefore, vital
for service continuity in both the production
and distribution of water, minimizing cost of
service, and preserving this resource for future
generations. An often-faced dilemma is how
to balance charging customers for the true
value of water while maintaining affordability.
Higher rates encourage water conservation
and reuse, and can positively impact efficiency
by encouraging investment in infrastructure
improvements; but it can also be cost prohibitive.
Low instances of leakage, as well as
accountability in terms of water usage in the
form of metering, are key to ensuring a city’s
water systems run efficiently. In many developed
economy cities, much of the infrastructure is
well past its useful life and the cities have seen
the effectiveness of their systems suffer, with an
increase in pipe leakage and service interruptions
due to infrastructure failure. In many emerging
economy cities, metering is relatively rare, and
instances of non-revenue water and service
interruptions relatively high.
3.4 WATER
EFFICIENCY
SUB INDEX
17
18. NEW DELHI
MUMBAI
DOHA
NAIROBI
JAKARTA
RIYADH
JEDDAH
BUENOS AIRES
MOSCOW
MANILA
JOHANNESBURG
ABU DHABI
RIO DE JANEIRO
ROME
SAO PAULO
SEOUL
LONDON
MEXICO CITY
BEIJING
WUHAN
SHANGHAI
PHILADELPHIA
BIRMINGHAM
CHICAGO
MANCHESTER
HONG KONG
KUALA LUMPUR
SANTIAGO
ISTANBUL
MADRID
PARIS
BOSTON
DALLAS
DUBAI
WASHINGTON
ROTTERDAM
NEW YORK
SINGAPORE
AMSTERDAM
HOUSTON
TORONTO
BRUSSELS
FRANKFURT
SAN FRANCISCO
TOKYO
MELBOURNE
SYDNEY
BERLIN
LOS ANGELES
COPENHAGEN 1
2
3
4
5
6
7
8
9
10
11
12
13
14
15
16
17
18
19
20
21
22
23
24
25
26
27
28
29
30
31
32
33
34
35
36
37
38
39
40
41
42
43
44
45
46
47
48
49
50
NON-REVENUE WATER WATER CHARGES METERED WATER
REUSED WASTEWATER SANITATION SERVICE CONTINUITY
DRINKING WATER
FIG 4: COPENHAGEN RANKS FIRST FOR EFFICIENCY,WITH LA IN SECOND
18
19. In the efficiency sub-Index
Copenhagen tops the list. The
Danish capital has one of the
lowest rates of leakage in the
world, fairly high charges per unit
of water and a high incidence of
water metering. Amsterdam and
Rotterdam, cities that top the
resiliency rankings, rank 12th and
15th respectively in efficiency.
Reuse of wastewater is the weak
spot in these cities.
On efficiency, the UK cities rate
relatively low. All three cities sit
behind some developing economy
cities due to low levels of reused
wastewater and lack of water
meters. While underperforming
in other areas, Tokyo has one of
the highest efficiency scores of
the cities studied due, in part,
to its comparatively modern
infrastructure which keeps leakage
rates low.
Los Angeles and San Francisco
boast high levels of water reuse.
This is a growing trend across
states that are experiencing water
scarcity. To date reuse has primarily
been for agricultural and industrial
purposes, however, potable reuse
applications are increasing and
gaining interest.
In the Middle East, desert cities
such as Abu Dhabi, Jeddah and
Riyadh also possess high scores
in terms of reuse, while they do
score lower on other aspects of
efficiency.
Sydney performs strongly when it
comes to ensuring its systems and
infrastructure deliver effectively
for its citizens and businesses. An
increase in wastewater reuse would
see Australia’s most populous city
perform even higher with respect
to efficiency.
CITY PROFILE: SAN FRANCISCO
Overall ranking: 24 Resiliency: 44 Efficiency: 7 Quality: 23
San Francisco ranks second highest in efficiency in the U.S. and
seventh in the overall sub-Index, propelled there by high scores for
wastewater reuse, non-revenue water and maximum scores for
coverage. Lack of green space and its natural flood risk from both
the Pacific Ocean and San Francisco Bay curtail flood resiliency.
The city is close to completing a $5 billion investment into their
water supply system making it more reliable and resilient. Recently
San Francisco developed a climate action plan which includes
measures to protect and enhance some of the most vulnerable
critical infrastructure and urban development in the city. Also in
progress is a $6.9 billion investment in sewer system improvements.
These all could help lead to an improved ranking in the future.
19
20. CITY PROFILE: JEDDAH
Overall ranking: 41 Resiliency: 46 Efficiency: 44 Quality: 28
Jeddah tops the Index in wastewater reuse in conjunction
with Riyadh and Los Angeles. However it faces a naturally
vulnerable environment due to its geographic location in the
hot, arid conditions of Saudi Arabia. The city’s lack of sufficient
infrastructure, added to this vulnerability, can lead to major urban
flooding as evidenced December 2015 when stormwater runoff
caused flooding.
Alongside some other cities in arid environments, it has a high score
for water stress, but its water balance is also challenged. Over the
course of a year, it has a deficit of around 150mm of water, also
the highest in the Index. Due to their lack of a freshwater drinking
source, Jeddah has invested heavily in desalination and more
recently building greater water security through storage.
Water supply has, in the past, been heavily subsidized in Saudi
Arabia, which did not encourage the conservation of such a precious
resource. However recently the Ministry of Water has significantly
increased the water tariff. This policy is expected to result in a
significant reduction in water use in the Kingdom.
20
21. CASE STUDY: A SECURE FUTURE FOR
DOHA’S WATER
Between now and 2030, the number of people living in Qatar is
expected to increase by almost a quarter to 2.3 million. It has also
become a tourist destination and will host the 2022 FIFA World Cup.
Rapid demographic and economic changes heighten the need for
improved efficiency and capacity of their public services such as
power and water, with desalination plants being the country’s main
source of drinking water. Recognizing the challenge of meeting the
growing demand for water with increased efficiency, the country
recognized the need for a national strategic plan to safeguard
its future.
With just under two days worth of water in the system at any
given time, any disaster – be it natural or manmade – would have
the potential to create serious problems in Doha. KAHRAMAA,
the Qatar General Electricity and Water Corporation, is therefore
increasing water storage and security, as well as their efficiency
through an ambitious mega reservoir project. Five interconnected
sites, each containing four-to-five reservoirs, are currently under
construction and are on course to be delivered by 2018. Additionally,
an expansion to nine reservoirs at each site is planned to be
delivered by 2036, improving efficiency and storage in Qatar’s water
system even further.
Each reservoir site will be connected directly to the existing water
transmission system. This allows the bulk storage to be held in
close proximity to where demand will be, while also making sure
the water in circulation continues to comply with World Health
Organization standards. Qatar’s mega reservoirs will be the largest
of their kind in the world. With seven full days of water security,
Doha’s people and businesses will have an efficient, secure and
flexible supply for its future.
21
23. 3.5 WATER
QUALITY
SUB INDEX
TO WHAT EXTENT DO THE WORLD’S CITIES PROVIDE
A CLEAN AND HEALTHY WATER SUPPLY?
In the Index, water quality is arguably the area
where performance is highest, with many cities
having recognized their critical role in improving
quality of life, and thus have made significant
investment. However, it remains a challenge for
a number of developing cities such as growing
cities in Africa and Asia. According to a recent UN
report, ten percent of the world’s population still
does not have access to safe drinking water.
Cities in the developed world have historically
improved their prosperity and economies only
after adequately addressing water quality and
sanitation, making them more competitive. Cities
in developing nations will need to improve water
quality to become prosperous, sustainable urban
centers. Unsafe water and lack of sanitation is
a major contributor to illness and disease, and
lack of accessible and reliable source of potable
water can minimize productivity and deter
business investment. Polluted waterways restrict
recreational activities, make clean up costly and
deter livability.
23
24. DRINKING WATER SANITATION WATER-RELATED DISEASE
TREATED WASTEWATER WATER POLLUTION THREATENED SPECIES
MANILA
NAIROBI
MUMBAI
JOHANNESBURG
NEW DELHI
JAKARTA
MEXICO CITY
ABU DHABI
DUBAI
WUHAN
SANTIAGO
RIO DE JANEIRO
SAO PAULO
KUALA LUMPUR
BEIJING
SHANGHAI
MOSCOW
BUENOS AIRES
HONG KONG
SINGAPORE
DOHA
RIYADH
JEDDAH
TOKYO
LONDON
SYDNEY
ISTANBUL
SAN FRANCISCO
ROME
LOS ANGELES
MADRID
SEOUL
AMSTERDAM
MELBOURNE
ROTTERDAM
FRANKFURT
BERLIN
COPENHAGEN
WASHINGTON
DALLAS
HOUSTON
MANCHESTER
BIRMINGHAM
NEW YORK
BOSTON
PARIS
BRUSSELS
PHILADELPHIA
CHICAGO
TORONTO 1
2
3
4
5
6
7
8
9
10
11
12
13
14
15
16
17
18
19
20
21
22
23
24
25
26
27
28
29
30
31
32
33
34
35
36
37
38
39
40
41
42
43
44
45
46
47
48
49
50
FIG 5: TORONTO COMES TOP FOR WATER QUALITY
24
25. Generally, developed nation cities
achieve very close to a maximum
score for water quality. When it
comes to the categories of drinking
water coverage, water treatment,
sanitation and low incidences of
water-related diseases, locations
in the developed world perform
well enough to sustain a growing
economy. That said, scores drop
off quickly towards the bottom
of the Index, below a certain
developmental threshold. The
main statistical differentiator
between the cities in developed
economies is the level of
threatened species and, to a lesser
extent, water source pollution.
Inadequate access to sanitation
and treatment of wastewater are
the primary issues for many of the
cities located toward the latter of
the quality rankings.
Toronto scores highest on the
water quality Index, largely as a
result of it having the lowest levels
of water pollution at its source.
Hong Kong performs well when it
comes to access to drinking water
and incidence of water related
disease. However, a relatively
higher level of threatened species
when compared to other cities due
in part to the upstream pollution of
the Pearl River Delta.
Although drinking water and
sanitation are good in Dubai,
levels of threatened species and
instances of water-related disease
in the UAE overall see it perform
behind the rest of the world.
Due to their low access to safe
drinking water, poor levels of
sanitation and low levels of
wastewater treatment, the Index
finds Manila and Nairobi rounding
out the quality ranking.
The Brazilian cities of São Paulo
and Rio de Janeiro rank relatively
low on water quality, especially
due to a low score on treated
wastewater.
CITY PROFILE: CHICAGO
Overall: 20 Resiliency: 35 Efficiency: 27 Quality: 2
For quality, Chicago is one of the highest ranked cities because the
historic decision to reverse the flow of the Chicago River to protect
the quality of Lake Michigan. The city’s TARP, or tunnel and reservoir
program, invests and manages the city’s critical infrastructure to
handle combined sewer overflows. Thus, very little sewer effluent
or pollution flows into its water bodies, creating sustainable water
quality for the city. Chicago is close to having almost no pollution in
their freshwater sources.
The city’s efficiency vulnerability is being addressed through one of
the most ambitious infrastructure replacement programs on their
water and sewer lines, replacing 100 miles per year.
To further increase efficiency and reduce consumption, the Chicago
Department of Water Management has a volunteer metering
program, heavily incentivizing consumers with rate guarantees to
increase awareness and reduce leakage. Chicago has also developed
an incentive program that encourages developers to incorporate
green roofs on new buildings, known as the Green Permit Program.
Additional benefits of the Green Roof program for the city include
mitigation of climate change through reduced need for heating and
cooling in buildings with green roofs and an enhancement of the
image of the city.
25
26. CASE STUDY: TRANSFORMING THE
RIO TIETÊ – INVESTING TO IMPROVE
WATER QUALITY
For centuries Rio Tietê in São Paulo facilitated trade, exploration
and leisure activities. These activities were ultimately banned due to
pollution in the river, mostly as a result of industrial waste.
The majority of the decline of the health and quality of the
river occurred between 1940 and 1970 during a period of rapid
urbanization and industrialization. Most of the waste from
industries and sewage was conveyed into the Rio Tietê at a rate of
approximately 134 tons per day. Population growth in São Paulo
also led to illegal occupation of land and a subsequent increase in
the amount of untreated sewage finding its way into the river.
NGOs and the media joined a nationally-led social campaign to
clean up the river in the early 1990s. A petition attracted 1.2 million
signatures, prompting the launch of Projeto Rio Tietê by the São
Paulo State Government to clean up the river. Set into four stages
over 25 years, the total investment is a projected $5 billion USD.
Once complete, the infrastructure will be able to safely treat the
sewage generated by 19 million residents and significantly improve
the health and quality of the river.
Since the first stage of the project, Arcadis has been the consultant
and technical advisor to the company behind the project, Sabesp
(São Paulo State Sanitation Company). Now in the third stage,
as head of the consortium, Arcadis is helping Sabesp deliver the
infrastructure to improve the quality of the water by connecting an
additional 200,000 households to the sewer system and increasing
the volume of sewage treated from 66% to 84%.
Projeto Rio Tietê has successfully endured through a backdrop
of hyperinflation, financial crises and changes in the political
landscape. Sabesp is now planning the fourth stage of the project
which aims to increase sewage collection of 19 million inhabitants
to 100% by 2024. Projeto Rio Tietê is a vital step for improving the
quality of life in for every resident in the city and sets the stage for a
sustainable future.
CITY PROFILE: SÃO PAULO
Overall ranking: 34 Resiliency: 20 Efficiency: 36 Quality:38
São Paulo is one of the best performing cities in Latin America and
tops resiliency in the region. This mega city is vulnerable to flooding
and drought which poses substantial challenges to the city to
manage the extremes. Irregular urban settlements and insufficient
housing programs contribute to the low quality of the city’s water
bodies and the flood intensity.
São Paulo has invested in three key actions to provide regular
water supply: a water loss reduction program, social education
initiatives on rational water use and additional water supplies.
These actions are now helping to progress the city’s supply and
quality. Even so, continued investment in more treatment plants
and water reuse should be added as the largest potential points to
increase São Paulo´s position in the worldwide ranking around water
sustainability.
26
27. 4. HOW CITIES CAN
SUSTAINABLY HARNESS
THEIR WATER ASSETS
FOR LONG TERM
SUCCESS
4.1 WHAT ARE THE WATER CHALLENGES
FACING CITIES TODAY?
All cities are facing water challenges they are not fully equipped to
address. From urbanization to climate change and aging infrastructure
to water security, cities must identify and prioritize short and long term
initiatives to sustain or garner a competitive advantage through water.
The key challenges faced are explored below.
RAPID URBANIZATION
All citizens want the same thing; a livelihood, a place to live, protection
from disaster and, of course, drinking water and sanitation. Population
growth can overwhelm water infrastructure. This, in turn, can result
in increased demand, service interruptions, insufficient treatment,
infrastructure failure, and high costs associated with the repair,
replacement and expansion of infrastructure.
African cities like Johannesburg and Nairobi are dealing with considerable
challenges related to rapid urbanization and its impact on almost every
aspect of water sustainability. Growing Asian cities like Shanghai, with
just 2 million inhabitants in 1920 and 23 million inhabitants today,
are struggling with the impacts of growing population on the water
ecosystem and its threatened species.
WATER SCARCITY
Water scarcity relates to the lack of safe and/or easily accessible water
supplies impacting a city’s competitiveness. Water scarcity is further
aggravated by climate change often triggering persistent drought. Water
is a driving factor for businesses, while scarcity of this resource limits a
city’s ability to grow.
Limited access to clean and safe water resources can lead to food
shortages, economic slowdown and even political conflicts that can
further exacerbate the economic and competitive position of the
affected city. Water scarcity is a growing problem in cities with vulnerable
climates, limited natural water resources and growing demand. All these
elements are featured in the rapidly expanding desert city of Doha,
resulting in limited water resources. The upcoming 2022 FIFA World Cup
is likely to add to Doha’s challenges with mass tourism likely to increase
water demand. The California water crisis has also been widely reported,
which has led to cities, like Los Angeles, having to double efforts on
water conservation, water reuse, and diversification of water supplies.
However, increasing water scarcity threatens to lead to higher water
rates, increased incidences of wildfires and land subsidence, an impact on
flora and fauna, and adverse impacts on agriculture and other businesses
critical to a city’s economic health.
27
28. WATER EXCESS
At the other end of the spectrum, cities can struggle with too much
water. Suffering during heavy rainfall, many cities lack enough green
space to buffer heavy rains, and coastal areas are hindered by sea-level
rise and storm surge. A city like Rotterdam has learned to deal with these
water excess challenges through the strategic Dutch Delta Plan.
On the other hand, the city of Jakarta with rapid urbanization and record
soil subsidence, is facing daily water challenges. Without substantial short
term countermeasures, the lives of millions of people will be impacted by
semi-permanent flooding in the Northern part of the city.
AGING AND INADEQUATE INFRASTRUCTURE
Aging and inadequate water and wastewater infrastructure contributes
to both scarcity and flooding, as well as inefficiency. The economic crisis
and historically insufficient funding for water infrastructure has forced
many utilities to delay improvements which have led to a deteriorated
and unreliable system. The problems associated with these issues can
significantly reduce a city’s competitiveness.
Cities such as London, Berlin and New York suffer from the impacts of
aging infrastructure. The American Society for Civil Engineers regularly
issues a report card on the status of infrastructure in the United States.
In recent years, this report card gave the country’s water and wastewater
infrastructure a “D” grade, meaning it is in poor condition due to the
infrastructure being near or past its capacity and life expectancy.
Significant capital investments will be required to fix, replace, and expand
pipes, levees, waterways and other critical water infrastructure, as well as
upgrade or expand treatment.
CLIMATE CHANGE
Changing weather patterns threaten to leave some areas in persistent
drought while others experience cloud bursts, mega storms and rising sea
levels that lead to flooding. In recent years, superstorms like Hurricane
Katrina in New Orleans and Typhoon Haiyan in the Philippines produced
unprecedented storm surges that devastated flood protection systems
and the communities they were designed to protect. On the other hand,
cities like Los Angeles and São Paulo recently faced unparalleled water
shortages.
In response, Los Angeles imposed severe measures to stiffen the rules on
water conservation and to curb excessive water use, up to and including
shutting off supplies and even considering the use of the public weapon
of “drought shaming”. São Paulo was confronted with the worst drought
in 80 years, which resulted in the city's two main reservoirs, the Cantareira
reservoir and the Alto Tietê reservoir being almost empty. São Paulo was
brought back from the brink of a water crisis when El Niño brought in
heavy rainfall in February 2016 that restored reservoir levels
SECURITY AND BUSINESS CONTINUITY
The infrastructure associated with drinking water and wastewater
services is critical to the functioning of both cities and nations; and
thus can be a targeted by bad actors – whether cyber hackers or other
malicious adversaries. Key resilient elements are protecting critical assets
and making sure that a system can be quickly restored to service after
disruptive events. Nations and cities across the globe vary broadly in how
they address water and wastewater systems as a critical infrastructure
that needs to be protected, and to what extent cities and utilities plan for
failure and recovery. However, with the increased automation of every
aspect of life - including of critical infrastructure, and with cybersecurity
taking center stage as a global threat, the focus on infrastructure security
and preparedness at the utility level is on the rise.
28
29. CITY PROFILE: WUHAN
Overall ranking: 40 Resiliency: 26 Efficiency: 31 Quality: 41
Wuhan, with more than 12 million residents and the most populous
city in Central China, is working hard to deal with water stress,
as well as with water balance and reserve water. Flooding from
the main Yangtze and Han rivers has been strongly diminished
by building high levees and by the constructing the Three Gorges
Dam. But the location of the city in a large plain still makes the city
vulnerable to flooding due to intense rainfall.
Extensive building activities have put a stress on the retention
capacity of the city, as in the last decades many lakes and green
areas have been urbanized thus the urban drainage system became
overwhelmed. Presently the municipality is working hard on
improvements. Wuhan was one of the main cities to be selected
as a pilot for the so called “Sponge City” Program, which was
established in response to the alarming statistic that the number
of Chinese cities affected by flooding has more than doubled since
2008 due to rapid urbanization. Arcadis was recently selected by
the city of Wuhan to be the lead consultant of the Sponge City
Program.
The name Sponge City refers to the innovative solution to create
more green public spaces to absorb stormwater, making the city
more permeable and resilient to climate change. Ultimately, the city
has a goal to manage 60 percent of the rainwater and serving as an
example to other Chinese cities.
29
30. CITY PROFILE: LOS ANGELES
Overall ranking: 27 Resiliency: 48 Efficiency: 2 Quality: 21
Los Angeles comes in second in the efficiency Index, with
only Copenhagen topping it. It joins Jeddah and Riyadh as top
performers in wastewater reuse. However, various features of the
city’s natural environment create sustainability challenges. It has
suffered incidents of all five major natural water-related disasters,
as well as its fair share of floods. Chronically high water stress
and distant water supplies (over 85% imported from over 100
miles away) strain its ability to provide a consistent supply against
drought. The propensity for seismic scenarios could prevent the city
from receiving enough water for prolonged periods of time.
LA is responding to their challenges in the short and long term,
starting with the gubernatorial-mandated 25% water use reduction
and earthquake preparedness initiatives as well as the adoption of
the One Water LA plan which will set the bar for a more sustainable
and resilient way to manage the City’s future water needs through
a collaborative approach yielding sustainable, long term water
supplies for Los Angeles in addition to greater resiliency to drought
conditions and climate change.
Los Angeles receives the top score for water reuse based on
the large capacity of facilities in its vicinity. It has also been very
successful in reducing non-revenue water, and boasts one of the
most successful conservation programs.
CITY PROFILE: ABU DHABI
Overall ranking: 38 Resiliency: 33 Efficiency: 39 Quality: 43
Abu Dhabi, ranking second among its regional peers, is in a
geographically vulnerable water situation with high water stress.
Like its neighbors, it obtains the majority of its water through
desalination due to the lack of natural freshwater sources. This lack
of naturally sustainable water resources is reflected in the reserve
water, water balance and water stress indicators.
Abu Dhabi works towards sustainability through the use of treated
sewerage effluent for landscaping. The rapid urbanization brought
to the forefront the need for efficiency and to make progress
against its natural risk Abu Dhabi is investing heavily in its capital
program. In terms of non-revenue water, Abu Dhabi comes in
second in region. ADSSC has a vision to achieve excellence in the
provision of high quality, cost effective, safe and environmentally
compliant sewerage systems in the Emirate of Abu Dhabi.
*Some data points for Abu Dhabi and Dubai are only available for the UAE on a country-level basis versus
city specific data. Therefore, the wider country data is applied to Abu Dhabi in a broader interpretation,
potentially having adverse effects on Abu Dhabi and Dubai’s overall rankings, particularly in the water
quality sub-Index’s indicator of water-related disease.
30
31. CITY PROFILE: LONDON
Overall ranking: 21 Resiliency: 14 Efficiency: 34 Quality: 26
London’s ranking for efficiency is relatively anomalous in terms
of its overall ranking. Rates of water metering are very low by
international standards. British utility companies are increasingly
moving towards metered supply, but this remains unpopular with
the public. London leakage rates are also fairly high as a result of
underinvestment despite ongoing efforts to replace the city’s aging
Victorian sewers.
Despite ongoing improvements, pollution levels in the city’s source
water are still among the highest in the Index. The Thames River is
negatively impacted by upstream pesticide use in farming as well
as combined sewer overflow. Investment in projects such as the Lee
Tunnel and Thames Tideway Tunnel will significantly improve water
pollution in the city.
London is in a dynamic resiliency situation as rapid urbanization in
the flood plains and an aging storm surge barrier system increasing
the vulnerability to future flooding.
CITY PROFILE: MANILA
Overall ranking: 48 Resiliency: 50 Efficiency: 41 Quality: 50
Manila outperforms some of its Asian peers in efficiency as its
metering, wastewater reuse and water charges are higher than its
regional peers, but it has room for improvement on the resiliency
and quality indices.
The greater metropolitan area is characterized by extensive
informal settlements which developed without proper urban
planning. Flooding after rainstorms occurs regularly and levels
of drinking water and sanitation provision are low. The Philippine
capital has a sanitation coverage rate of just 12%, one of the lowest
in the Index.
The other large challenge that Manila faces is an adverse
geographic location with one of the most challenging climates on
earth, as The Philippines is the most-exposed large country in the
world to tropical cyclones (typhoons). Manila is prone to frequent
flooding and four different types of water-related natural disasters.
Metro Manila is now with support of the World Bank planning for a
flood protection program. The city’s score on water balance is also
very low, due to a sizeable precipitation deficit in certain months and
a huge surplus during the rainy season.
31
32. 4.2 HOW TO CREATE A SUSTAINABLE
WATER FUTURE FOR CITIES
There is not one single winning strategy for each city’s urban
waterscapes. As the Index demonstrates, natural and manmade
circumstances and challenges differ from city to city. In this section,
we recommend approaches for dealing with urban water challenges
based on our global experience, strategic viewpoint and water heritage.
We believe these can be building blocks for developing winning water
strategies and valuable food for thought for those responsible for their
city’s water planning and development.
SUSTAINABLE STRATEGIES AND BEST PRACTICES
This Index clearly shows that many of the world’s cities still have steps to
take to become sustainable or have the capacity to endure natural and
manmade water challenges. Alternatively, they may not have policies
and practices in place that allow them to efficiently manage their water
resources to optimize water quality and quantities.
Even higher ranked cities are not ready for the challenges brought by
changing circumstances, including climate change, extreme weather, and
other disruptive events. It is important to understand that sustainability is
not only a matter of water but, rather, it is also about the social, economic
and governmental challenges that interconnect with each other. The
pathway to ensuring a city is truly sustainable must take all these aspects
into account.
Clearly, becoming more sustainable could easily be bogged down in the
endless details and contingencies and bureaucracy. However, there are
many things that can be done. Let us take a look at some strategies and
best practices that can make our urban world fit for the future by making
it a better and safer place to live, visit and conduct business.
32
33. PLANNING
RESILIENCY AS A
PATHWAY TOWARDS
SUSTAINABILITY
Major cities worldwide have now
placed resiliency planning on the
agenda, an initial step to becoming
more sustainable. To give urban
resiliency top-level visibility, The
Rockefeller Foundation pioneered
a 100 Resilient Cities Initiative. It is
expected that 100 ‘Chief Resiliency
Officers’ will advance policy,
planning and funding. These plans
and new inter-urban dialogues
have, in some places, already put
forward a new, broader definition
of resiliency and demonstrated
how these cities can prepare to
recover from the uncertainties of
the future.
This dialogue is having a profound
effect on how cities look at water
management, and beyond. In her
book, The Resilience Dividend,
Judith Rodin president of the
Rockefeller Foundation, explores
the new era of resiliency planning.
She defines it as “the capacity
of any entity – an individual, a
community, an organization, or
a natural system – to prepare for
disruptions, to recover from shocks
and stresses, and to adapt and
grow from a disruptive experience.”
By this way of thinking, the
scope of resiliency is not just
about structures and protection
but also is about preparing to
recover. Resiliency extends to the
‘soft’ infrastructure of society,
including employment, income
distribution, social cohesion and a
range of factors not usually built
into water management. It also
includes the planning and design
for alternative ways of funding.
For example, it is expected that
cities that have good economic
and social resilience can also
recover faster from a catastrophe
or unplanned emergency such
as a flood. A resilient city also
has robust vital infrastructure
and services, such as hospitals,
electricity, telecommunications
and transportation. When these
recover quickly, it is for the good of
the city, its citizens, businesses and
environment.
URBAN ADAPTIVE
PLANNING
The way we deal with natural
disasters is usually reactive. For
example, it used to be typical
to design the best protection to
safeguard a city after a devastating
storm with the aim of preventing
a similar future disaster. Time
and experience has proven this
approach to be only moderately
successful. More recently, however,
proactive planning and design
processes are employing statistics
and modelling to design for
hypothetical scenarios, potentially
saving lives and making cities safer
before the disaster.
However, with the abundance
of challenges our urban world
is now facing, it is difficult – and
maybe impossible – to exactly
plan and design for the mid and
long term future. It is precisely for
this reason that modern planning
practices have to be adaptive
and risk-based, as well as flexible
enough to account for unexpected
circumstances or developments.
A good example of an adaptive
planning practice is in San
Francisco, where they have
responded to their natural
vulnerability risk through a
comprehensive assessment of
Mission Creek and Mission Bay,
two of the lowest lying parts of
the city. Formerly an industrial
area with primarily port facilities
and rail yards, the Mission Bay
area is now being redeveloped
for residential and commercial
use. The first step is assessing
the vulnerability of important
infrastructure using sea level rise
‘inundation maps’ and working
with different city departments to
ascertain potential weak points
and respond accordingly.
OPTIONEERING: MAKING
INVESTMENT AN
APPEALING CHOICE
Cities are often the economic
strongholds of their region.
However, funding for investments
in water sustainability is often
difficult to find. Especially because
the benefits of such investments
are not immediately obvious and
are not always the most eye-
catching or politically interesting.
This is why city administrations
tend to postpone these
investments.
Most cities have many short
term problems and plans that
require investments, such as social
housing, traffic congestion, more
exposed critical infrastructure or
leisure. An interesting way forward
is combining some of these more
immediate needs with longer-term
water sustainability and climate
change adaptation initiatives. This
approach opens up additional
opportunities to attract private
funding, for instance green funds
and climate bonds that generate
return on investment. This is known
as optioneering.
THE ASSET LIFECYCLE
33
34. CREATING
MULTI-PURPOSE URBAN
SOLUTIONS
Water infrastructure projects often
require large investments and
space, and in urban areas funding
and space is limited. This makes
innovative solutions that provide
multiple functions increasingly
attractive. This approach requires
water engineers and planners to
be well connected to the other
needs and ambitions of the
urban communities, and who
can translate these in alternative,
innovative designs.
For a city to be effective at
managing resiliency and quality,
it must also ably manage
stormwater. Many cities are turning
to green infrastructure projects
to manage stormwater issues as
an alternative to the traditional
methods of piped drainage
systems that were designed to
capture and convey stormwater
to waterbodies as quickly as
possible, and may or may not have
involved methods to address water
quality. Green infrastructure is an
approach to water management
that more closely mimics the
natural water environment, and
incorporates both natural and
engineered systems to effectively
capture, attenuate, store and
treat stormwater. At the same
time green infrastructure can
provide valuable green space and
recreation for the residents of a
city, reduce the urban heat island
effect, and enhance biodiversity
and ecological resilience.
The South Los Angeles Wetlands
Park was designed to capture and
treatment urban runoff, while also
providing rare green space to an
underserved community of Los
Angeles. The project transformed
a previously abandoned railyard,
which was a brownfield site, into a
park with trails, boardwalks, picnic
areas and other features.
Harnessing the power of low-
impact green infrastructure in
cities not only swiftly reduces
flood damage and restores areas
to a more natural state should the
worst happen, it also makes for a
more balanced local eco-system.
The likes of parkland, bio swales
and green roofs cannot completely
replace traditional ‘grey’ storm
drainage systems, which in many
cases will remain the backbone of
urban stormwater management.
Rather, a balance can be struck
between the two that produces
an integrated, resilient system and
allows cities to grow.
MANAGING AND
OPERATION
OPTIMIZING URBAN
WATER USE
Clean, safe and usable water is
a limited and valuable resource.
This is precisely why it is crucial to
make sure water usage in cities is
efficiently managed and wastage
is kept to a minimum. Yet, in many
cities water is not always treated
appropriately and in fact may even
be wasted. It is all too often taken
for granted under the assumption
that it is abundantly available, as
well as inexpensive and simple to
manage. However, efficiency is an
area that many cities struggle with
and one in which many developed
cities underperform.
To accomplish this, cities must
have a good enough knowledge
of their assets and behavior of its
system and the types and levels
of usage (current and projected).
They also must be aware of the
vulnerabilities of the system,
as well as the risks which could
potentially cause distress in the
system (on a short or long term
basis) and that could hinder the
cities operations, the well-being of
its citizens, or even limit the city’s
competitive edge. Water sources
along with treatment, delivery,
and collection capacities and
challenges; as well as compliance
and quality requirements (both
current and future) are all
necessary aspects that cities must
consider when developing their
“as-is” and “future” optimization
blueprints in their pathway
towards sustainability.
URBAN ASSET
PRESERVATION AND
MANAGEMENT
Aging urban water infrastructure
poses a serious challenge, weighing
heavily on systems like an unpaid
debt. For several decades,
and throughout the economic
downturn, city authorities and
utilities in most countries around
the world held back on maintaining
or upgrading water and wastewater
infrastructure. Deferred
maintenance and spending have
resulted in a major funding gap.
In the U.S. in particular, the sheer
enormity of the funding gap is
daunting, approximately $600
million USD according to the U.S.
Environmental Protection Agency.
At the same time, population
growth and urbanization require
large investments in new water and
wastewater infrastructure, not just
in the U.S. but all around the world.
Large cities and public and private
utilities assume that everything
will be 'business as usual' forever.
However, in the world of urban
competition, the future will
favor the creative, the innovative
and the bold. The opportunity
risk of foregoing improvements
based on social, economic, and
environmental consequences as
well as the probability of failure can
guide asset management decisions.
The asset management standard,
ISO 55000, is being used by utilities
and cities that are looking to adapt
and improve how they manage
their assets.
Risk-based asset management
approaches are more and more
being used to prioritize capital and
operating investments. This means
allocating funds to address risks to
those assets that have the highest
potential of failure but also those
where the consequences of failure
have the biggest impact on the
urban economy, environment
and communities.
Until recently, such programs
were performed by individual
departments within an
organization and have not been
integrated into any organization-
wide strategy, but with the ISO
55000 many large cities and
utilities are revising their approach.
The Tarrant Regional Water
District, outside of Dallas has
the overall goal of achieving
100% reliability and optimized
management of energy used
to transmit raw water. As such,
they have embarked on a project
34
35. that comprises the development
of a formal asset management
program that complies with ISO
55000 and the development of
a real-time energy consumption
optimization decision support tool.
MANAGE STORMWATER
When it rains, the water that runs
off our roofs can be collected
for future reuse with minimum
hassle. Rainwater harvesting is
increasingly practiced in larger
urban facilities including sports
arenas and recreational complexes.
In many cities it is worthwhile to
collect this water, instead of letting
it drain into the subsoil or directly in
collection systems. This approach
is gaining popularity in many water
scarce areas.
Singapore, for example, is currently
committing to infrastructure that
is designed to capture every drop
of rain that falls. Los Angeles is
capturing stormwater and using
it to recharge drinking water
aquifers, and the city of Melbourne
is piloting a project to capture
rainwater from roofs and store it in
tanks to be used for toilet flushing
and lawn watering.
SEPARATE GREYWATER
Residentially and commercially
generated wastewater that has
not been contaminated by sewage,
known as greywater, may be used
for cleaning or bathing. Greywater
does not require the same level
of treatment as most other
water sources. It is for this reason
that buildings should explore
opportunities to separate their
plumbing systems that carry this
water. While potentially proving
costly in the first instance, due to
requiring additional infrastructure,
it does create a more easily
reusable water source over the
longer term.
REDEFINING
DESALINATION
Taking saltwater from the
ocean and turning it into usable
freshwater is commonplace in
many arid coastal locations. It
is, in fact, the fastest growing
alternative water supply source
in the world and can be a valuable
weapon for cities looking to
diversify their water supply and
reduce water shortages. However,
the costs of treating it, transporting
it and disposing of the leftover
brine can be high energy.
Generally, desalination has higher
equipment costs and energy
demand than wastewater reuse,
plus disposing of the separated
brine can pose an environmental
challenge. The question for
city leaders considering this
option is whether the rewards
of desalination warrant its
implementation, and whether
other alternatives such as
conservation and water reuse
can cost effectively reduce the
quantity of desalinated water
required. Cities should be actively
looking at their water portfolio
management to see if they have
sufficiently diversified their options.
Desalination can be a reliable
source of drinking water that
enables continuity and access
for a city’s inhabitants.
WATER REUSE
Effectively reusing and
transporting water in a cost-
effective and safe way can
contribute considerably to water
availability and can be crucial to
meeting a city’s long term demand.
The water we drink often starts
out as natural water that has been
used before. For example, in cities
downstream on a river are often
drawing water for drinking water
that includes effluent discharged
from upstream wastewater
treatment plants. This water source
is then treated to bring it up to
drinking water standards.
Increasingly cities are treating
their own wastewater to levels
such that it can be reused for
agricultural, industrial, source
water replenishment, and
increasingly potable water uses.
The level of treatment required is
dependent on the end use and the
end uses will vary depending on
the particular conditions and needs
of the city.
The Saudi Arabian cities such as
Jeddah and Riyadh are investing
in water reuse as a component of
their strategy to manage water
scarcity. Treated Sewage Effluent
(TSE) is increasingly being made
available to industrial users and for
irrigation to reduce the demand for
potable water. The award winning
Aquapolo project in São Paolo
produces high quality industrial
water from effluent from the ABC
Sewage Treatment Plant for use
by industrial users in a nearby
petrochemical center, considered
to be the biggest consumer of
potable water in the region. This
project not only will help reduce
potable water consumption in a
region where water is increasingly
scarce, but it will also help reduce
pollutant loading to the
Tietê River.
Water reuse is very common in
California. The West Basin Water
Utility in greater Los Angeles
has taken reuse a step further
and introduced its ‘designer
water’ program, providing up to
five different types of water for
various commercial, industrial
and irrigation uses, as well
as groundwater injection to
create a barrier to prevent salt
water intrusion into a valuable
groundwater supply. The idea
behind this is to treat only certain
quantities to specific treatment
levels that are needed to sustain
demand at any given time. In
essence, they are treating water
to order.
35
36. 4.3 CONCLUDING REMARKS –
WHERE NEXT?
Water is paramount to a city’s sustainability, but too often it is being
wasted, polluted and taken for granted, while its potential to disrupt
communities and businesses is not being taken seriously enough.
Yet people expect healthy access to it, safety from it and city leaders
should view it as an opportunity and a resource for economic
development. The Arcadis Sustainable Cities Water Index attempts to
inspire cities to compare, collaborate and learn.
To succeed in an increasingly complex world, the world’s cities need to
focus on the opportunities that a healthy natural aquatic and municipal
water system offers, and find answers to major challenges if they are to
thrive and remain competitive over the coming decades.
The good news is there are inspirational efforts currently in place in many
of our global cities to improve provision of water. At present, around
ninety percent of the world’s population has access to clean drinking
water. This does represent a significant improvement and means that
we have met the UN millennium development goal in 2010, five years
ahead of schedule. Clearly, the appetite is there to make things better,
we just need to prioritize greater investment and move faster from the
strategizing and goal setting into actions that improve the quality of life
for every urban resident on this planet.
5. APPENDIX
5.1 METHODOLOGY
AUTHORSHIP AND ACKNOWLEDGEMENTS
The research that has informed this report was produced by CEBR, an independent economics and business research
consultancy established in 1992. The views expressed herein are those of the authors only and are based upon independent
research by them.
In partnership and consultation with the Centre for Economics and Business Research (CEBR), Arcadis developed the Sustainable
Cities Water Index with the ultimate goal of being able to rank the sustainability of cities with respect to their water profile and
systems. The Index centers around three key sub-indices for water sustainability: resiliency, efficiency, and quality. In turn, these
sub-indices are made up of a series of indicators, such as flood risk, green space and pollution.
The research examines a representative sample of 50 cities from 31 countries across all continents of the world. The cities
included within this report were selected to provide an overview of the world’s urban environment, providing not only wide-
ranging geographical coverage, but also a variety of levels of economic development, expectations for future growth and an
assortment of water sustainability challenges. These cities also parallel Arcadis’ 2015 Sustainable Cities Index that explored the
three demands of People, Planet and Profit and provided an indicative ranking of 50 of the world's leading cities.
The indicators are weighted according to their relative importance to water sustainability and quality of life. A metric is
developed for each indicator and a robust, evidence-based score is subsequently derived to quantify each city’s overall
performance. The breakdown of the indices also reveals where cities are doing well and where there may be room for
improvement.
Each sub-Index is built using a number of indicators. The data behind these indicators are processed so that higher scores
represent more sustainable cities, and give the highest-ranked city in each indicator a score of 100%, while the lowest-ranked
city receives 0%, so that each city’s performance within each indicator is measured relative to each of the other 49 cities.
By averaging the indicators, a score for every city in each of the three sub-indices is derived. The three sub-indices are then
combined to deliver an overall score. Some indicators, such as sanitation, are deemed to have importance to multiple sub-
indices. The output is a percentage score: theoretically a city could attain 100% if it came top in every category, but in reality no
city does.
It is important to recognize that personal and scientific opinions on the interpretation of the relative importance of indicators
will differ. We have ranked the indicators according to our interpretation of the impact on the quality of life in cities: their people,
environmental challenges and their natural assets. We hope this Index serves as a catalyst for a conversation on how cities can
further plan around their water sustainability. Hence the Sustainable City Water Index provides an interesting starting point of
further analysis and debate. The table below provides the quality of life weighting rational.
36
37. INDICATOR RANK QUALITY OF LIFE RATIONALE
Drinking water 1 Essential to public health and survival
Sanitation 2 Essential to public health
Water-related
disaster risk*
3 Essential to public safety, supply chain and business continuity
Flood risk*
Water-related
disease
4 Harmful to public health and economic progress
Water stress 5 Water shortages have a negative impact on the ecosystem, quality of life, future city
development and business continuity
Water balance 6 A stable water balance is an indicator for a healthy urban water system
Water pollution 7 Polluted water is both a public health risk and limits recreational and commercial
usability
Water reserves 8 Adequate safe yield and water reserves help a city through periods of water shortage,
important for both public health and the economy
Service continuity 9 To safeguard drinking water supply and industrial water supply for business continuity
Leakage 10 Leakages cause loss of revenues to invest in the water system
Treated wastewater 11 To enhance the quality of urban ecosystems and quality of life in cities and enable reuse
opportunities
Metered water 12 Serves the economical sustainability of the water system to accurately account for water
use
Water charges 13 To finance water services and to stimulate economic use of the water and provide for
cost recovery and finance system improvements
Green space 14 To store rain water, create space, add value to the urban ecosystem and fight urban heat
stress
Threatened species 15 Biodiversity in eco systems improves the urban environment.
Reused wastewater 16 Puts less strain on supplies and builds in system efficiencies and return on investment
*Note: water-related disaster risk and flood risk are different indicators, but collectively ranked third.
In total, 17 unique input indicators enter the Water Index, two of which appear in two sub-indices:
• Six enter the Resiliency sub-index;
• Seven enter the Efficiency sub-index;
• Six contribute to the Quality sub-index.
The raw inputs are then transformed. Firstly, the desirable characteristics are given higher scores. This is necessary for the
water pollution levels, for example, where higher scores indicate more polluted rivers. Second, all the raw inputs are scaled so
that they vary from 0 to 1: the lowest-ranked city receives 0 and the highest 1, and the others are spaced between that with the
same spacing as they had in the raw data. Where a data point is very far from the mean, the value is treated as an outlier and
receives either 0 or 1, and the next highest/lowest data point is treated as the lowest score. This prevents situations where one
or two cities receive an extreme score and there is little separation between the rest of the cities.
The United Nations Development Program uses a similar process in creating its Human Development Index¹.
The overall Index score is comprised of one third of the scores on each of the sub-indices.
¹See, for example, the UN Development Programme’s Human Development Reports page: http://hdr.undp.org/en/content/
human-development-Index-hdi
37
38. RESILIENCY INDICATORS AND DESCRIPTIONS
INDICATOR NAME DESCRIPTION SOURCE
Water stress Freshwater withdrawn as a percentage
of the total available locally
World Resources Institute
Green space Percentage of city area covered with
green space
Economist Intelligence Unit, Siemens
Green Cities Index
Water-related disaster risk Number of different types of water-
related natural disasters a city is
exposed to, including floods, storms,
droughts and mud flows.
EM-DAT International Disasters
Database
Flood risk Number of floods experienced
between 1985–2011
World Resources Institute
Water balance Monthly deficits and surpluses of
rainfall,
Terrestrial Water Balance Data Archive
(Willmott and Matsuura, University of
Delaware)
Reserve water Reservoir capacity within 100km of
city, relative to total city water supply
GRanD Global Reservoir and dam
database of the GSWP
EFFICIENCY INDICATORS AND DESCRIPTIONS
INDICATOR NAME DESCRIPTION SOURCE
Leakage* The proportion of water lost in transit.
Includes unbilled consumption, apparent
losses and physical leakage.
Smart Water Networks Forum, municipal
water utilities, World Bank
Water charges Average cost per cubic meter of water to
consumers, relative to average income
in city.
International Water Association, World
Bank IB-NET, municipal water utilities
Metered water Percentage of households whose water
consumption is metered.
Municipal water utilities, World Bank
Reused wastewater Wastewater reuse compared to total
wastewater produced.
FAO-Aquastat, Water Reuse Association
Service continuity Continuity of service, average hours per
day over the whole network.
World Bank, municipal water utilities
Sanitation Percentage of households with access to
improved sanitation.
WHO/UNICEF Joint Monitoring Program
for Water Supply and Sanitation
Drinking water Percentage of households with safe and
secure drinking water.
WHO/UNICEF Joint Monitoring Program
for Water Supply and Sanitation
QUALITY INDICATORS AND DESCRIPTIONS
INDICATOR NAME DESCRIPTION SOURCE
Sanitation Percentage of households with access to
improved sanitation.
WHO/UNICEF Joint Monitoring Program
for Water Supply and Sanitation
Drinking water Percentage of households using an
improved drinking-water source.
WHO/UNICEF Joint Monitoring Program
for Water Supply and Sanitation
Treated wastewater Percentage of wastewater treated. FAO Aquastat
Water-related disease Incidence of water/sanitation related
disease per capita.
WHO/Global Health Observatory Data
Repository
Threatened freshwater amphibian
species
Percentage of freshwater amphibian
species classified by the International
Union for Conservation of Nature as
threatened in an area.
World Resources Institute
Raw water pollution Concentration of phosphorus and
sediment yields from source
International Water Association
Drinking water Percentage of households with safe and
secure drinking water.
WHO/UNICEF Joint Monitoring Program
for Water Supply and Sanitation
38
39. DISCLAIMER
While every effort has been made to ensure the accuracy of the material
in this document, neither Centre for Economics and Business Research
Ltd nor Arcadis will be liable for any loss or damages incurred through
the use of the report. The report does not necessarily reflect the views of
Arcadis.
5.2 FURTHER READING
BUILT ASSET WEALTH
INDEX 2015
THE FUTURE OF ASSET
MANAGEMENT
SUSTAINABILITY REPORT 2015
GLOBAL INFRASTRUCTURE
INVESTMENT INDEX 2016
SUSTAINABLE CITIES INDEX 2015
39
40. John Batten
Global Director of Water and Cities
E water@arcadis.com
CONTACT US
www.arcadis.com/waterindex
Arcadis
@ArcadisGlobal
ABOUT ARCADIS
Arcadis is the leading global Design & Consultancy firm for natural and
built assets. Applying our deep market sector insights and collective
design, consultancy, engineering, project and management services we
work in partnership with our clients to deliver exceptional and sustainable
outcomes throughout the lifecycle of their natural and built assets. We
are 27,000 people active in over 70 countries that generate €3.4 billion
in revenues. We support UN-Habitat with knowledge and expertise to
improve the quality of life in rapidly growing cities around the world.
Arcadis. Improving quality of life.
Arcadis. Improving quality of life