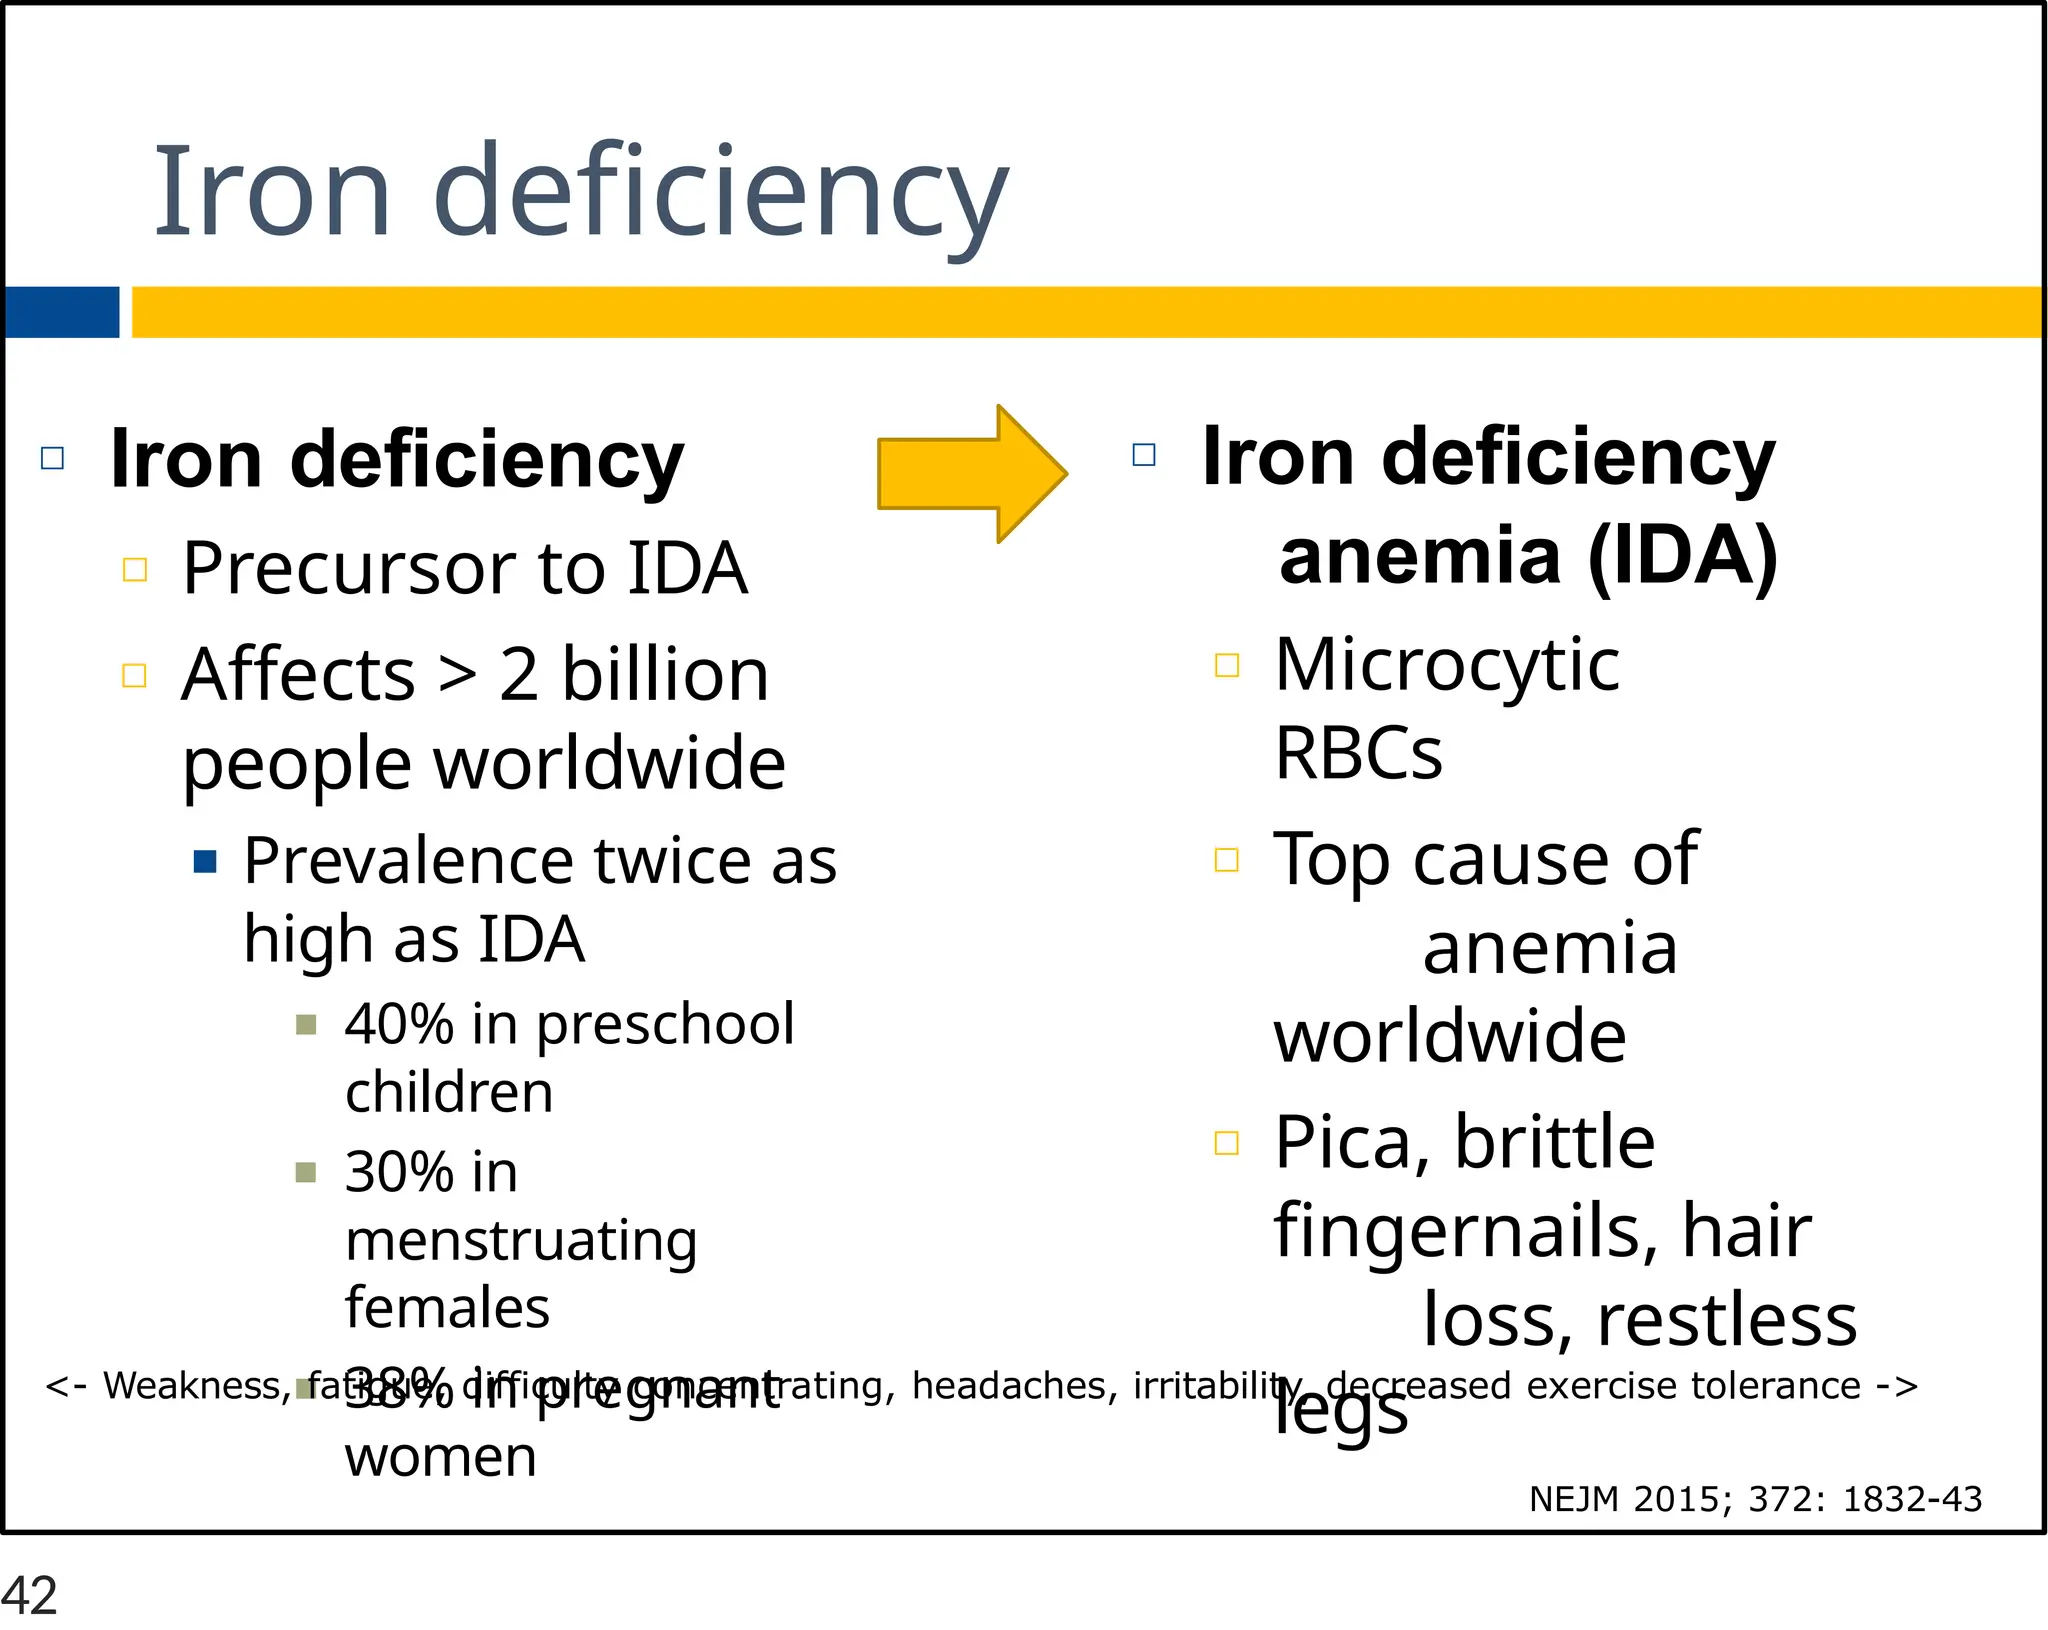
APPROACH TO IRON DEFICIENCY
ANEMIA
Suman Sood, MD, MSCE
Clinical Associate Professor of
Medicine UM Division of
Hematology/Oncology
Director, UM Hemophilia and
Coagulation Disorders Program
39th Annual Internal Medicine
Update July 28, 2023
1
Outline
□ General approach to
anemia
□ Iron Deficiency Anemia
(IDA)
□ Diagnosis
□ Workup of etiologies
□ Management
2
Approach to
anemia
• Normal red blood cell (RBC)
function
• Definition of anemia
• The CBC
• How to classify anemia
3
Normal RBC function
□ RBCs carry
oxygen linked
to hemoglobin
from the lungs
to the tissue
capillaries.
4
RBC life cycle
□ Erythropoesis occurs in the bone marrow
□ Erythropoetin (EPO) is the erythroid
specific growth factor.
□ Produced in the kidneys
□ Enhances the growth and
differentiation of erythroid
progenitor cells
■ Helps burst forming units-erythroid (BFU-E)
and colony forming units-erythroid (CFU-E)
become normoblasts.
5
RBC life cycle
□ Reticulocyte: formed when a normoblast
extrudes its nucleus to form a mature RBC
□ Circulate for 1 day, and then lose their reticulum
and become mature red blood cells
□ Reticulocyte count is a marker of RBC production
□ Mature RBC: circulates for 110-120 days.
□ Senescent RBCs are removed by macrophages.
Under steady state conditions: 1% of RBCs are
removed by the circulation every day, so 1% of
reticulocytes should be produced every day
6
RBC life cycle
7
Definition of anemia
□ Reduction in number of circulating red
blood cells (RBC)
□ Affects 25% of the world population
□ WHO estimates (2019):
■ 40% of children 6–59 months of age
■ 37% of pregnant women
■ 30% of women 15–49 years of age worldwide
Biological gender Hemoglobin
(hgb)
Hematocrit
Females <11.9 g/dL <35 percent
Males <13.6 g/dL <40 percent
Global Health Metrics. Anaemia–Level 1 impairment. Lancet. 2019; 393 https://www.healthdata.org/results/gbd_summaries/2019/anemia-level-1-
impairment
8
Panel Test Drawn Value Units Range
WBC 00:34 12.6 H THO/uL 4.0-11.0
HEMOGLOBIN
HEMATOCRIT
00:34
00:34
12.1
36
g/dL
%
11.8-15.5
36-46
150-400
0.0-2.0
THO/uL
%
/uL
/uL
/uL
%
%
%
pg
%
fL
%
MIL/uL
%
0.0-8.0
45.0-74.0
20.0-47.0
27-33
31-36
80-100
3.0-11.0
3.80-5.30
11.5-14.5
RBCMORPH
PLATELET Count
% BASOPHILS
Calculated GRANULOCYTES
Calculated LYMPHS
Calculated MONONUCLEARS
% EOSINOPHILS
% GRANULOCYTES
% LYMPHOCYTES
MCH
MCHC
MCV
%
MON
ONUC
LEARS
RBC
RED
Cell
DISTRI
BUTIO
N
MACROCYTES
MICROCYTES
00:34
00:34
00:34
00:34
00:34
00:34
00:34
00:34
00:34
00:34
00:34
00:34
00:34
00:34
00:34
00:34
287
0.5
10100
1700
600
1.1
80.3 H
13.7 L
30
34
88
4.3
4.05
17.9 H
SLIGHT *
SLIGHT *
POLYCHROMASIA 00:34 SLIGHT *
RED Blood Cell MORPHOLOGY 00:34 *****
*
HEME
PROFILE +
ELECTRONIC
DIFF
9
Hemoglobin
□ Measures the
concentration of the
major oxygen
carrying pigment in
whole blood
□ Values may be
expressed as g/dl
of whole blood
10
Hematocrit
□ Percent of a
sample of
whole blood
that is
occupied by
intact red
blood cells
11
RBC count
□ Number of red blood cells contained
in a specified volume of whole
blood
□ Expressed as millions of RBCs per
microliter of whole blood
□ Not often used clinically
12
RBC Indices
□ *MCV: Mean corpuscular volume ~ size
□ Normal range 80-100 femtoliters
□ MCH: Mean corpuscular hemoglobin ~ color
□ Low in iron deficiency, thalassemia
□ High in macrocytosis
□ MCHC: Mean corpuscular
hemoglobin concentration
□ Low with iron deficiency, thalassemia
□ High in congenital or acquired spherocytosis, or in
other congenital hemolytic anemias
□ RED Cell DISTRIBUTION WIDTH: RDW
□ Increased with reticulocytosis
13
Reticulocyte count
□ Can be measured as a percentage of all RBCs, as
an absolute reticulocyte count, or as reticulocyte
production index (takes into account HCT)
□ High: increased erythropoesis--compensation
for hemolytic anemia or blood loss
□ Low (in an anemic patient): impaired RBC
production by the bone marrow
□ With pancytopenia: aplastic anemia, folate or
B12 deficiency, acute leukemia
□ With normal WBC and platelets: pure red cell aplasia
(may be associated with parvovirus B19).
14
Nucleated red blood cells
□ Not normally found in circulation
□ May be seen with sickle cell disease,
thalassemia major, various hemolytic
anemias after splenectomy
□ May be seen in patients with a
leukoerythroblastic picture, severe sepsis,
or heart failure
15
The peripheral smear
□ It is always important to look at the peripheral blood
smear for clues to the etiology of the anemia
16
RBC Morphology
□ MACROCYTES vs MICROCYTES
□ POLYCHROMASIA vs HYPOCHROMIC
□ RED Blood Cell MORPHOLOGY
□ Anisocytosis: variation of RBC size
□ Poikilocytosis: variation of RBC shape
□ Spherocytes: immune mediated hemolysis
□ Schistocytes: red cell fragmentation with
microangiopathic hemolysis
□ Teardrop cells: marrow infiltration
□ Target cells: thalassemia
□ Sickle cells
□ Acanthocytes (spur cells): liver disease
□ Echinocytes (burr cells): renal disease
17
Schistocyte
Spherocyte Burr Cell (renal)
Spur Cell (liver) Teardrop Cell Target Cell
18
Limitations of the definition
of anemia
□ The “normal” range includes 95% of the
normal population.
□ Therefore 2.5% of normal adults will have values that
are > 2 standard deviations below this range and be
falsely considered anemic
□ The normal ranges are so wide that a patient can
lose up to 15% of their red cell mass and still
have a normal HCT
□ “Normal” values may not apply to
special populations (i.e. high
altitude living, etc.)
19
Special populations
□ High altitude: higher Hgb values (less oxygen)
□ Smokers: more likely to have higher Hgb level
due to carbon monoxide exposure
□ Pregnancy
□ Athletes: Hgb can vary depending on
circumstances
□ Dilutional anemia with increased plasma volume, GI
bleeding, intravascular hemolysis (after a marathon),
iron deficiency
□ Polycythemia may occur with dehydration, or the
use of performance enhancing agents such as
androgens and erythropoetin.
20
Elderly
□ The elderly generally have lower values
for Hgb and HCT compared to
younger populations
□ However, elderly patients should not be
presumed to have a lower normal range, for
fear of missing a serious underlying disorder.
□ Disorders such as malignancy, peptic
ulcer disease, and infection are
more common in anemic elderly
patients.
21
Anemia in the elderly is due to
disease not aging!
□ A number of large studies have shown
increased mortality for elderly anemic
patients.
□ A study of 755 patients older than age 85
showed having a hgb < 13 in men and < 12 in
women (compared to age matched non-anemic
patients):
□ increased mortality 1.6x in men
□ increased mortality 2.3x in women
□ Even without an obvious chronic disease, the mortality
rate in anemic patients was 2x that of non-anemic
patients.
Izaks, et al. JAMA 1999; 281: 1714
22
African Americans
□ In both sexes and all ages, values for Hgb
are generally 0.5-1.0 g/dl lower than
in comparable Caucasian
populations.
□ Reason for this is unclear. Some part may
be attributable to an increased
incidence of iron deficiency anemia
and/or alpha thalessemia.
23
Volume status
□ Hgb, HCT, and RBC are all concentrations
and depend on the red cell mass as
well as plasma volume
□ Therefore, if red cell mass is decreased or
plasma volume is increased, the patient will
appear anemic
□ i.e.: patients admitted to the hospital dehydrated
may not appear anemic until they are fluid
repleted.
24
Anemia: signs and symptoms
□ May result from:
1) decreased oxygen delivery to the tissue
2) hypovolemia with acute bleeding
□ Depends clinically on:
□ time course over which anemia developed
□ degree of anemia
□ oxygen demands of the patient (i.e. at rest versus with exertion)
□ Patients with mild anemia or an anemia that evolved slowly
(mild chronic GI blood loss) will likely be asymptomatic except
with exertion
□ Acute blood loss will lead to marked symptoms of
hypovolemia and tissue ischemia (i.e. chest pain, etc).
25
Anemia: signs and symptoms
□ Primary symptoms:
□ Begins with symptoms with exertion:
dyspnea, palpitations, muscle cramps,
decreased exercise tolerance
□ Progresses to symptoms at rest: Dyspnea at
rest, fatigue, weakness, dizziness
□ With underlying disease: worsening CHF,
angina
□ Acute bleeding: hypovolemia:
□ Postural dizziness, lethargy, syncope,
persistent hypotension, shock, death
26
Causes of anemia
□ Two methods of classification:
□ Kinetic approach: identify the
mechanism responsible for
anemia
■ Useful for forming a differential diagnosis
□ Morphological approach: categorize the
anemia based on the MCV (mean
corpuscular volume)
■ Useful for further classifying normocytic anemias
27
Differential diagnosis
Anemi
a
Decreased
productio
n
Increased
destructio
n
Loss
28
Causes of anemia
PRODUCTION DESTRUCTION LOSS
BONE MARROW IMMUNE Blood loss
- Infiltrative: Cancer
- Failure: aplastic
- Radiation, Chemotherapy
Autoimmune
hemolytic anemia
VITAMIN DEFICIENCY
- B12, folate
- Copper
NON-IMMUNE
Microangiopathic
hemolytic anemia
- DIC, TTP, aHUS
- Valve hemolysis
RENAL DISEASE
-Erythropoietin
deficiency
INFLAMMATION
- Acute (sepsis) or chronic
MEDICATIONS
VIRUSES
DIC: Disseminated Intravascular
Coagulation. TTP: thrombotic
thrombocytopenia purpura aHUS: atypical
hemolytic uremic syndrome
29
Morphological approach:
□ Macrocytic: MCV > 100 femtoliters
□ Microcytic: MCV < 80 fl
□ Normocytic: MCV 80-100 fl
□ Note: be cautious about interpreting the MCV
after a patient has been transfused
30
Underproduction anemias
MICROCYTIC NORMOCYTIC MACROCYTIC
Iron deficiency anemia Anemia of
inflammation, chronic
kidney disease
Megaloblastic
anemia (B12, folate)
Thalassemia,
hemoglobinopath
y
Increased
reticulocyte count
Copper deficiency liver disease
Hypothyroid
Alcohol
MDS, acquired
sideroblastic
anemia
31
Microcytic vs macrocytic
anemia
32
Microcytic anemia: MCV < 80
□ Iron, iron, iron!
□ Reduced iron availability
□ iron deficiency, anemia of chronic disease,
copper deficiency
□ Reduced globin production
□ thalassemia, hemoglobinopathy
□ Reduced heme synthesis
□ lead poisoning, sideroblastic anemia
(congenital, alcohol)
33
Microcytic anemia: in clinical practice
□ Iron deficiency
□ Once diagnosed, essential to determine
the cause of the iron deficient state
□ Anemia of chronic disease
□ Thalassemia minor
□ Alpha thalassemia minor trait is
especially prevalent in African
American populations
□ Diagnosis of exclusion!
34
2010 WHO estimate: ~1.24 billion
individuals are affected by iron deficiency
anemia
IRON DEFICIENCY ANEMIA
Blood. 2019;133(1):30-39
35
Iron
□ Crucial to biological functions
□ Respiration, energy production, DNA
synthesis, cell proliferation
■ Hemoglobin, myoglobin
□ Humans are designed to conserve iron
□ Iron is recycled by macrophages after
breakdown of senescent RBCs
□ Iron is retained (no excretion mechanism)
36
Iron balance: regulated by
hepcidin
EXCESS IRON
- No physiological excretion mechanism
- TOXIC: hemochromatosis
IRON DEFICIENCY
- Usually from blood loss
-Oral iron absorption
is limited: 1-2 mg/d
-Most iron (25 mg/d) from
iron recycling from old RBCs
Adult: ~3-4g of iron
- 2.5 g in RBC
-1 g stored (bone
marrow, liver, spleen)
37
Iron cycle
Only 5-10% of
dietary iron is
absorbed; this
occurs in the distal
duodenum and
proximal jejunum.
38
Hepcidin
□ Peptide hormone made in the liver
□ Acute phase reactant
□ Adjusts plasma iron levels
■ Binds/induces degradation of ferroportin
(which exports iron from cells)
□ LOW hepcidin: iron deficiency
□ HIGH hepcidin: in high iron states (or
systemic inflammation/infection)
□ induced by inflammatory cytokines such as IL6 ->
anemia chronic disease
39
Hepcidin
Dos Reis Lemos et al. Rev Assoc Med Bras 2010; 56(5)
Ganz et al. BBA 2012; 1823 (9): 1434-43
40
NEJM 2015; 372: 1832-43
41
Iron deficiency
□ Iron deficiency
□ Precursor to IDA
□ Affects > 2 billion
people worldwide
■ Prevalence twice as
high as IDA
■ 40% in preschool
children
■ 30% in
menstruating
females
■ 38% in pregnant
women
□ Iron deficiency
anemia (IDA)
□ Microcytic
RBCs
□ Top cause of
anemia
worldwide
□ Pica, brittle
fingernails, hair
loss, restless
legs
<- Weakness, fatigue, difficulty concentrating, headaches, irritability, decreased exercise tolerance ->
NEJM 2015; 372: 1832-43
42
Blood 2019; 133 (1): 30-
39
43
Low iron: must identify the
cause
□ Blood loss
□ Menstruation, pregnancy
□ Chronic GIB
■ Intestinal worm colonization in developing countries
□ Insufficient dietary intake
□ Poor diet
□ Vegan > vegetarian diet
□ Malabsorption
□ Gastric bypass of the duodenum, celiac disease,
H. pylori infection, atrophic gastritis
44
Blood Loss: iron deficiency
□ Most common cause of anemia
□ Obvious bleeding: trauma, melena, hematemesis
□ Occult bleeding: slowly bleeding ulcer or
carcinoma
□ Induced bleeding: blood draws for lab
testing, procedures/surgery, excessive
blood donation
□ Pregnancy
□ Menses: 25% of menstruating females have
absent iron stores
In higher income countries, in adult males and post menopausal females,
evaluation of the GI tract (endoscopic or radiographic) finds a cause of IDA
in
Acquired Underproduction Anemias. American Society of Hematology Self Assessment Program 2019; p.
138-160
45
Iron deficiency: labs to order
□ CBC
□ TIBC (iron with total binding capacity)
□ Iron level
□ Iron binding capacity (TIBC)
□ % transferrin saturation
□ Ferritin
Patient should not take iron on day of blood draw
46
Interpretation of iron stores
Serum
iron
Serum
ferritin
TIBC* %
Transferrin
Saturation
Normal 10-160
ug/dl
40-300 ng/ml
men
20-200 ng/ml
women
228-428
ug/dl
16-45%
Iron
Deficiency
Low Low-
< 10-30
High Low
(often <
9-16%)
Anemia of
Chronic
Disease
Low Normal/
high
Low 10-20%
*TIBC: Total Iron Binding Capacity ~ amount of transferrin
47
NEJM 2015; 372: 1832-43
48
MANAGEMENT OF IDA
49
Iron Deficiency
□ Stepwise approach to treatment
□ Dietary
□ Oral: Ferrous sulfate 325 mg PO qod
■ Take between meals, with orange juice,
for maximal absorption
□ Intravenous (IV) Iron
□ Blood transfusion: 1 unit of blood = 250
mg iron
50
Iron
rich
foods
https://www.redcross.org/content/dam/redcrossblood/landing-page-documents/246401_ironrichpyramid_flyer_ms_v02.pdf
□ Red cross: https://www.redcrossblood.org/donate-blood/blood-donation-process/before-during-after/iron-blood-
donation/iron- rich-foods.html
□ Canada: https://carleton.ca/healthy-workplace/wp-content/uploads/Food-Sources-of-Iron.pdf
Heme iron
Red meats, liver,
egg yolk, salmon,
tuna and oysters
Non heme iron
(harder to absorb)
vegetables, fruits
and grains
51
Adjunctive iron
□ Other factors that affect dietary iron
absorption
□ INHIBIT absorption: calcium rich foods, tannins in
tea and coffee, phytates in cereals
□ ENHANCE ABSORPTION: ascorbic acid, heme iron,
legumes (removes phytates)
□ Cast iron pans
□ Lucky iron fish
52
Oral iron
□ 60 mg elemental
iron every
day- other day
□ Take with vit C
□ Adverse events (AE):
nausea/ vomiting,
constipation,
bloating, darker
stool
□ More iron ->
more AE
Kasthuri et al. Cure HHT website, https://curehht.org/understanding-hht/diagnosis-treatment/hhtguidelines; accessed 5/24/21
53
Snook J, Bhala N, Beales ILP, et al. Gut
2021;70:2030–2051.
54
Iron every other day (QOD)
□ Excessive dosing is counterproductive
□ Recommend 1 iron pill qod (or MWF)
□ consider take with vit C (no high quality data)
■ Iron generally should not be given with food.
■ Iron should especially be taken separately from calcium-
containing foods and beverages (milk), calcium
supplements, cereals, dietary fiber, tea, coffee, and eggs.
■ Iron should be given two hours before, or four hours after,
ingestion of antacids.
□ AE: N/V, constipation, bloating, darker stool
□ More iron -> more AE
55
No point in three times a day
iron….
□ 2015: iron deficient women (n=54): 40-80 mg iron
no more than daily best
□ Higher or more frequent doses of iron raised circulating
hepcidin levels and reduced subsequent fractional
iron absorption.
□ 2017 RCT: women with iron deficiency (n=40).
□ Iron sulfate 60 mg: daily x 14 d vs qod x 28d
□ every-other-day dosing resulted in greater iron absorption
(131 versus 175 mg total), with a trend to less AE
□ Serum hepcidin levels higher with daily dosing
□ RCTs in women with IDA are ongoing
□ DBRCT: 60 mg daily vs 120 mg qod x 8 weeks (n=200 with hgb <
10 and low MCV or ferritin <50); no difference in hgb rise at
week 8 Stoffel et al. Lancet Hematol 2017; 4: 524-33
Pasupathy et al. Sci Rep 2023; 13(1): 1818
56
Iron replacement: Time to
response
□ Reticulocytosis: 7-10 days
□ Increased Hgb: 2-4 weeks
□ Resolution of anemia: 4-6 months
□ Continue oral iron replacement for several months
after anemia resolves to replete iron stores.
57
What if the patient is not
responding?
□ Adherence, adherence, adherence
□ Ongoing bleeding
□ Celiac disease, atrophic gastritis, H pylori
□ High hepcidin levels
□ Oral iron absorption test:
1. measure baseline fasting serum iron level
2. administer 325 mg PO FeSO4
3. retest serum iron level after 1-2 hrs; should increase by 50-
100
□ If fails to respond -> IV iron
When should we use IV iron?
□ Ganzoni equation to calculate iron deficit:
Total iron deficit = weight (kg) x (target Hgb – actual hgb) x 2.4 +
500
Blood 2019; 133 (1): 30-
39
, IBD
59
• AE: N/V, pruritus, headache, flushing, myalgias, arthralgias, back pain
• sx resolve within 48 h
Kasthuri et al. Cure HHT website, https://curehht.org/understanding-hht/diagnosis-treatment/hhtguidelines; accessed 5/24/21
60
Time to response to IV iron
□ Rapid iron repletion
□ Ferritin peaks 7-9 days after infusion
□ Hemoglobin should rise within 2-3 weeks
□ Remember to continue to monitor CBC and
iron studies every 2-3 months in patients with
ongoing causes of iron deficiency
61
Any questions?
Thank you for your
attention!
62

APPROACH TO IRON DEFICIENCY ANEMIA......

  • 1.
    APPROACH TO IRONDEFICIENCY ANEMIA Suman Sood, MD, MSCE Clinical Associate Professor of Medicine UM Division of Hematology/Oncology Director, UM Hemophilia and Coagulation Disorders Program 39th Annual Internal Medicine Update July 28, 2023 1
  • 2.
    Outline □ General approachto anemia □ Iron Deficiency Anemia (IDA) □ Diagnosis □ Workup of etiologies □ Management 2
  • 3.
    Approach to anemia • Normalred blood cell (RBC) function • Definition of anemia • The CBC • How to classify anemia 3
  • 4.
    Normal RBC function □RBCs carry oxygen linked to hemoglobin from the lungs to the tissue capillaries. 4
  • 5.
    RBC life cycle □Erythropoesis occurs in the bone marrow □ Erythropoetin (EPO) is the erythroid specific growth factor. □ Produced in the kidneys □ Enhances the growth and differentiation of erythroid progenitor cells ■ Helps burst forming units-erythroid (BFU-E) and colony forming units-erythroid (CFU-E) become normoblasts. 5
  • 6.
    RBC life cycle □Reticulocyte: formed when a normoblast extrudes its nucleus to form a mature RBC □ Circulate for 1 day, and then lose their reticulum and become mature red blood cells □ Reticulocyte count is a marker of RBC production □ Mature RBC: circulates for 110-120 days. □ Senescent RBCs are removed by macrophages. Under steady state conditions: 1% of RBCs are removed by the circulation every day, so 1% of reticulocytes should be produced every day 6
  • 7.
  • 8.
    Definition of anemia □Reduction in number of circulating red blood cells (RBC) □ Affects 25% of the world population □ WHO estimates (2019): ■ 40% of children 6–59 months of age ■ 37% of pregnant women ■ 30% of women 15–49 years of age worldwide Biological gender Hemoglobin (hgb) Hematocrit Females <11.9 g/dL <35 percent Males <13.6 g/dL <40 percent Global Health Metrics. Anaemia–Level 1 impairment. Lancet. 2019; 393 https://www.healthdata.org/results/gbd_summaries/2019/anemia-level-1- impairment 8
  • 9.
    Panel Test DrawnValue Units Range WBC 00:34 12.6 H THO/uL 4.0-11.0 HEMOGLOBIN HEMATOCRIT 00:34 00:34 12.1 36 g/dL % 11.8-15.5 36-46 150-400 0.0-2.0 THO/uL % /uL /uL /uL % % % pg % fL % MIL/uL % 0.0-8.0 45.0-74.0 20.0-47.0 27-33 31-36 80-100 3.0-11.0 3.80-5.30 11.5-14.5 RBCMORPH PLATELET Count % BASOPHILS Calculated GRANULOCYTES Calculated LYMPHS Calculated MONONUCLEARS % EOSINOPHILS % GRANULOCYTES % LYMPHOCYTES MCH MCHC MCV % MON ONUC LEARS RBC RED Cell DISTRI BUTIO N MACROCYTES MICROCYTES 00:34 00:34 00:34 00:34 00:34 00:34 00:34 00:34 00:34 00:34 00:34 00:34 00:34 00:34 00:34 00:34 287 0.5 10100 1700 600 1.1 80.3 H 13.7 L 30 34 88 4.3 4.05 17.9 H SLIGHT * SLIGHT * POLYCHROMASIA 00:34 SLIGHT * RED Blood Cell MORPHOLOGY 00:34 ***** * HEME PROFILE + ELECTRONIC DIFF 9
  • 10.
    Hemoglobin □ Measures the concentrationof the major oxygen carrying pigment in whole blood □ Values may be expressed as g/dl of whole blood 10
  • 11.
    Hematocrit □ Percent ofa sample of whole blood that is occupied by intact red blood cells 11
  • 12.
    RBC count □ Numberof red blood cells contained in a specified volume of whole blood □ Expressed as millions of RBCs per microliter of whole blood □ Not often used clinically 12
  • 13.
    RBC Indices □ *MCV:Mean corpuscular volume ~ size □ Normal range 80-100 femtoliters □ MCH: Mean corpuscular hemoglobin ~ color □ Low in iron deficiency, thalassemia □ High in macrocytosis □ MCHC: Mean corpuscular hemoglobin concentration □ Low with iron deficiency, thalassemia □ High in congenital or acquired spherocytosis, or in other congenital hemolytic anemias □ RED Cell DISTRIBUTION WIDTH: RDW □ Increased with reticulocytosis 13
  • 14.
    Reticulocyte count □ Canbe measured as a percentage of all RBCs, as an absolute reticulocyte count, or as reticulocyte production index (takes into account HCT) □ High: increased erythropoesis--compensation for hemolytic anemia or blood loss □ Low (in an anemic patient): impaired RBC production by the bone marrow □ With pancytopenia: aplastic anemia, folate or B12 deficiency, acute leukemia □ With normal WBC and platelets: pure red cell aplasia (may be associated with parvovirus B19). 14
  • 15.
    Nucleated red bloodcells □ Not normally found in circulation □ May be seen with sickle cell disease, thalassemia major, various hemolytic anemias after splenectomy □ May be seen in patients with a leukoerythroblastic picture, severe sepsis, or heart failure 15
  • 16.
    The peripheral smear □It is always important to look at the peripheral blood smear for clues to the etiology of the anemia 16
  • 17.
    RBC Morphology □ MACROCYTESvs MICROCYTES □ POLYCHROMASIA vs HYPOCHROMIC □ RED Blood Cell MORPHOLOGY □ Anisocytosis: variation of RBC size □ Poikilocytosis: variation of RBC shape □ Spherocytes: immune mediated hemolysis □ Schistocytes: red cell fragmentation with microangiopathic hemolysis □ Teardrop cells: marrow infiltration □ Target cells: thalassemia □ Sickle cells □ Acanthocytes (spur cells): liver disease □ Echinocytes (burr cells): renal disease 17
  • 18.
    Schistocyte Spherocyte Burr Cell(renal) Spur Cell (liver) Teardrop Cell Target Cell 18
  • 19.
    Limitations of thedefinition of anemia □ The “normal” range includes 95% of the normal population. □ Therefore 2.5% of normal adults will have values that are > 2 standard deviations below this range and be falsely considered anemic □ The normal ranges are so wide that a patient can lose up to 15% of their red cell mass and still have a normal HCT □ “Normal” values may not apply to special populations (i.e. high altitude living, etc.) 19
  • 20.
    Special populations □ Highaltitude: higher Hgb values (less oxygen) □ Smokers: more likely to have higher Hgb level due to carbon monoxide exposure □ Pregnancy □ Athletes: Hgb can vary depending on circumstances □ Dilutional anemia with increased plasma volume, GI bleeding, intravascular hemolysis (after a marathon), iron deficiency □ Polycythemia may occur with dehydration, or the use of performance enhancing agents such as androgens and erythropoetin. 20
  • 21.
    Elderly □ The elderlygenerally have lower values for Hgb and HCT compared to younger populations □ However, elderly patients should not be presumed to have a lower normal range, for fear of missing a serious underlying disorder. □ Disorders such as malignancy, peptic ulcer disease, and infection are more common in anemic elderly patients. 21
  • 22.
    Anemia in theelderly is due to disease not aging! □ A number of large studies have shown increased mortality for elderly anemic patients. □ A study of 755 patients older than age 85 showed having a hgb < 13 in men and < 12 in women (compared to age matched non-anemic patients): □ increased mortality 1.6x in men □ increased mortality 2.3x in women □ Even without an obvious chronic disease, the mortality rate in anemic patients was 2x that of non-anemic patients. Izaks, et al. JAMA 1999; 281: 1714 22
  • 23.
    African Americans □ Inboth sexes and all ages, values for Hgb are generally 0.5-1.0 g/dl lower than in comparable Caucasian populations. □ Reason for this is unclear. Some part may be attributable to an increased incidence of iron deficiency anemia and/or alpha thalessemia. 23
  • 24.
    Volume status □ Hgb,HCT, and RBC are all concentrations and depend on the red cell mass as well as plasma volume □ Therefore, if red cell mass is decreased or plasma volume is increased, the patient will appear anemic □ i.e.: patients admitted to the hospital dehydrated may not appear anemic until they are fluid repleted. 24
  • 25.
    Anemia: signs andsymptoms □ May result from: 1) decreased oxygen delivery to the tissue 2) hypovolemia with acute bleeding □ Depends clinically on: □ time course over which anemia developed □ degree of anemia □ oxygen demands of the patient (i.e. at rest versus with exertion) □ Patients with mild anemia or an anemia that evolved slowly (mild chronic GI blood loss) will likely be asymptomatic except with exertion □ Acute blood loss will lead to marked symptoms of hypovolemia and tissue ischemia (i.e. chest pain, etc). 25
  • 26.
    Anemia: signs andsymptoms □ Primary symptoms: □ Begins with symptoms with exertion: dyspnea, palpitations, muscle cramps, decreased exercise tolerance □ Progresses to symptoms at rest: Dyspnea at rest, fatigue, weakness, dizziness □ With underlying disease: worsening CHF, angina □ Acute bleeding: hypovolemia: □ Postural dizziness, lethargy, syncope, persistent hypotension, shock, death 26
  • 27.
    Causes of anemia □Two methods of classification: □ Kinetic approach: identify the mechanism responsible for anemia ■ Useful for forming a differential diagnosis □ Morphological approach: categorize the anemia based on the MCV (mean corpuscular volume) ■ Useful for further classifying normocytic anemias 27
  • 28.
  • 29.
    Causes of anemia PRODUCTIONDESTRUCTION LOSS BONE MARROW IMMUNE Blood loss - Infiltrative: Cancer - Failure: aplastic - Radiation, Chemotherapy Autoimmune hemolytic anemia VITAMIN DEFICIENCY - B12, folate - Copper NON-IMMUNE Microangiopathic hemolytic anemia - DIC, TTP, aHUS - Valve hemolysis RENAL DISEASE -Erythropoietin deficiency INFLAMMATION - Acute (sepsis) or chronic MEDICATIONS VIRUSES DIC: Disseminated Intravascular Coagulation. TTP: thrombotic thrombocytopenia purpura aHUS: atypical hemolytic uremic syndrome 29
  • 30.
    Morphological approach: □ Macrocytic:MCV > 100 femtoliters □ Microcytic: MCV < 80 fl □ Normocytic: MCV 80-100 fl □ Note: be cautious about interpreting the MCV after a patient has been transfused 30
  • 31.
    Underproduction anemias MICROCYTIC NORMOCYTICMACROCYTIC Iron deficiency anemia Anemia of inflammation, chronic kidney disease Megaloblastic anemia (B12, folate) Thalassemia, hemoglobinopath y Increased reticulocyte count Copper deficiency liver disease Hypothyroid Alcohol MDS, acquired sideroblastic anemia 31
  • 32.
  • 33.
    Microcytic anemia: MCV< 80 □ Iron, iron, iron! □ Reduced iron availability □ iron deficiency, anemia of chronic disease, copper deficiency □ Reduced globin production □ thalassemia, hemoglobinopathy □ Reduced heme synthesis □ lead poisoning, sideroblastic anemia (congenital, alcohol) 33
  • 34.
    Microcytic anemia: inclinical practice □ Iron deficiency □ Once diagnosed, essential to determine the cause of the iron deficient state □ Anemia of chronic disease □ Thalassemia minor □ Alpha thalassemia minor trait is especially prevalent in African American populations □ Diagnosis of exclusion! 34
  • 35.
    2010 WHO estimate:~1.24 billion individuals are affected by iron deficiency anemia IRON DEFICIENCY ANEMIA Blood. 2019;133(1):30-39 35
  • 36.
    Iron □ Crucial tobiological functions □ Respiration, energy production, DNA synthesis, cell proliferation ■ Hemoglobin, myoglobin □ Humans are designed to conserve iron □ Iron is recycled by macrophages after breakdown of senescent RBCs □ Iron is retained (no excretion mechanism) 36
  • 37.
    Iron balance: regulatedby hepcidin EXCESS IRON - No physiological excretion mechanism - TOXIC: hemochromatosis IRON DEFICIENCY - Usually from blood loss -Oral iron absorption is limited: 1-2 mg/d -Most iron (25 mg/d) from iron recycling from old RBCs Adult: ~3-4g of iron - 2.5 g in RBC -1 g stored (bone marrow, liver, spleen) 37
  • 38.
    Iron cycle Only 5-10%of dietary iron is absorbed; this occurs in the distal duodenum and proximal jejunum. 38
  • 39.
    Hepcidin □ Peptide hormonemade in the liver □ Acute phase reactant □ Adjusts plasma iron levels ■ Binds/induces degradation of ferroportin (which exports iron from cells) □ LOW hepcidin: iron deficiency □ HIGH hepcidin: in high iron states (or systemic inflammation/infection) □ induced by inflammatory cytokines such as IL6 -> anemia chronic disease 39
  • 40.
    Hepcidin Dos Reis Lemoset al. Rev Assoc Med Bras 2010; 56(5) Ganz et al. BBA 2012; 1823 (9): 1434-43 40
  • 41.
    NEJM 2015; 372:1832-43 41
  • 42.
    Iron deficiency □ Irondeficiency □ Precursor to IDA □ Affects > 2 billion people worldwide ■ Prevalence twice as high as IDA ■ 40% in preschool children ■ 30% in menstruating females ■ 38% in pregnant women □ Iron deficiency anemia (IDA) □ Microcytic RBCs □ Top cause of anemia worldwide □ Pica, brittle fingernails, hair loss, restless legs <- Weakness, fatigue, difficulty concentrating, headaches, irritability, decreased exercise tolerance -> NEJM 2015; 372: 1832-43 42
  • 43.
    Blood 2019; 133(1): 30- 39 43
  • 44.
    Low iron: mustidentify the cause □ Blood loss □ Menstruation, pregnancy □ Chronic GIB ■ Intestinal worm colonization in developing countries □ Insufficient dietary intake □ Poor diet □ Vegan > vegetarian diet □ Malabsorption □ Gastric bypass of the duodenum, celiac disease, H. pylori infection, atrophic gastritis 44
  • 45.
    Blood Loss: irondeficiency □ Most common cause of anemia □ Obvious bleeding: trauma, melena, hematemesis □ Occult bleeding: slowly bleeding ulcer or carcinoma □ Induced bleeding: blood draws for lab testing, procedures/surgery, excessive blood donation □ Pregnancy □ Menses: 25% of menstruating females have absent iron stores In higher income countries, in adult males and post menopausal females, evaluation of the GI tract (endoscopic or radiographic) finds a cause of IDA in Acquired Underproduction Anemias. American Society of Hematology Self Assessment Program 2019; p. 138-160 45
  • 46.
    Iron deficiency: labsto order □ CBC □ TIBC (iron with total binding capacity) □ Iron level □ Iron binding capacity (TIBC) □ % transferrin saturation □ Ferritin Patient should not take iron on day of blood draw 46
  • 47.
    Interpretation of ironstores Serum iron Serum ferritin TIBC* % Transferrin Saturation Normal 10-160 ug/dl 40-300 ng/ml men 20-200 ng/ml women 228-428 ug/dl 16-45% Iron Deficiency Low Low- < 10-30 High Low (often < 9-16%) Anemia of Chronic Disease Low Normal/ high Low 10-20% *TIBC: Total Iron Binding Capacity ~ amount of transferrin 47
  • 48.
    NEJM 2015; 372:1832-43 48
  • 49.
  • 50.
    Iron Deficiency □ Stepwiseapproach to treatment □ Dietary □ Oral: Ferrous sulfate 325 mg PO qod ■ Take between meals, with orange juice, for maximal absorption □ Intravenous (IV) Iron □ Blood transfusion: 1 unit of blood = 250 mg iron 50
  • 51.
    Iron rich foods https://www.redcross.org/content/dam/redcrossblood/landing-page-documents/246401_ironrichpyramid_flyer_ms_v02.pdf □ Red cross:https://www.redcrossblood.org/donate-blood/blood-donation-process/before-during-after/iron-blood- donation/iron- rich-foods.html □ Canada: https://carleton.ca/healthy-workplace/wp-content/uploads/Food-Sources-of-Iron.pdf Heme iron Red meats, liver, egg yolk, salmon, tuna and oysters Non heme iron (harder to absorb) vegetables, fruits and grains 51
  • 52.
    Adjunctive iron □ Otherfactors that affect dietary iron absorption □ INHIBIT absorption: calcium rich foods, tannins in tea and coffee, phytates in cereals □ ENHANCE ABSORPTION: ascorbic acid, heme iron, legumes (removes phytates) □ Cast iron pans □ Lucky iron fish 52
  • 53.
    Oral iron □ 60mg elemental iron every day- other day □ Take with vit C □ Adverse events (AE): nausea/ vomiting, constipation, bloating, darker stool □ More iron -> more AE Kasthuri et al. Cure HHT website, https://curehht.org/understanding-hht/diagnosis-treatment/hhtguidelines; accessed 5/24/21 53
  • 54.
    Snook J, BhalaN, Beales ILP, et al. Gut 2021;70:2030–2051. 54
  • 55.
    Iron every otherday (QOD) □ Excessive dosing is counterproductive □ Recommend 1 iron pill qod (or MWF) □ consider take with vit C (no high quality data) ■ Iron generally should not be given with food. ■ Iron should especially be taken separately from calcium- containing foods and beverages (milk), calcium supplements, cereals, dietary fiber, tea, coffee, and eggs. ■ Iron should be given two hours before, or four hours after, ingestion of antacids. □ AE: N/V, constipation, bloating, darker stool □ More iron -> more AE 55
  • 56.
    No point inthree times a day iron…. □ 2015: iron deficient women (n=54): 40-80 mg iron no more than daily best □ Higher or more frequent doses of iron raised circulating hepcidin levels and reduced subsequent fractional iron absorption. □ 2017 RCT: women with iron deficiency (n=40). □ Iron sulfate 60 mg: daily x 14 d vs qod x 28d □ every-other-day dosing resulted in greater iron absorption (131 versus 175 mg total), with a trend to less AE □ Serum hepcidin levels higher with daily dosing □ RCTs in women with IDA are ongoing □ DBRCT: 60 mg daily vs 120 mg qod x 8 weeks (n=200 with hgb < 10 and low MCV or ferritin <50); no difference in hgb rise at week 8 Stoffel et al. Lancet Hematol 2017; 4: 524-33 Pasupathy et al. Sci Rep 2023; 13(1): 1818 56
  • 57.
    Iron replacement: Timeto response □ Reticulocytosis: 7-10 days □ Increased Hgb: 2-4 weeks □ Resolution of anemia: 4-6 months □ Continue oral iron replacement for several months after anemia resolves to replete iron stores. 57
  • 58.
    What if thepatient is not responding? □ Adherence, adherence, adherence □ Ongoing bleeding □ Celiac disease, atrophic gastritis, H pylori □ High hepcidin levels □ Oral iron absorption test: 1. measure baseline fasting serum iron level 2. administer 325 mg PO FeSO4 3. retest serum iron level after 1-2 hrs; should increase by 50- 100 □ If fails to respond -> IV iron
  • 59.
    When should weuse IV iron? □ Ganzoni equation to calculate iron deficit: Total iron deficit = weight (kg) x (target Hgb – actual hgb) x 2.4 + 500 Blood 2019; 133 (1): 30- 39 , IBD 59
  • 60.
    • AE: N/V,pruritus, headache, flushing, myalgias, arthralgias, back pain • sx resolve within 48 h Kasthuri et al. Cure HHT website, https://curehht.org/understanding-hht/diagnosis-treatment/hhtguidelines; accessed 5/24/21 60
  • 61.
    Time to responseto IV iron □ Rapid iron repletion □ Ferritin peaks 7-9 days after infusion □ Hemoglobin should rise within 2-3 weeks □ Remember to continue to monitor CBC and iron studies every 2-3 months in patients with ongoing causes of iron deficiency 61
  • 62.
    Any questions? Thank youfor your attention! 62