Quantifi whitepaper how the credit crisis has changed counterparty risk man...Quantifi
This paper will explore some of the key changes to internal counterparty risk management processes by tracing typical workflows within banks before and after CVA desks, and how increased clearing due to regulatory mandates, affects these workflows. Since CVA pricing and counterparty risk management workflows require extensive amounts of data, as well as a scalable, high-performance technology, it is important to understand the data management and analytical challenges involved.
• Current trends and best practices
• Key data and technology challenges
Resume of Alan Leal, Global Technology Licensing Executive with critical expertise in IP licensing, technology transfer and monetization of emerging technologies
US Patent Litigation CSIRO v. Cisco - Judge Davis's Damages Calculation of Re...Rahul Dev
How to calculate damages during patent infringement?
In case of patent infringement, there are two types of damages: (a) Loss Profits, and (b) Reasonable Royalty. Loss profits imply additional profits that the patent owner would have made if there had been no patent infringement. Reasonably royalty on the other hand implies minimum damages that a patent owner can receive pertaining to a reasonable amount that someone would have agreed to pay to the patent owner for using the patented technology and patent owner would have accepted.
Provisions related to Patent Damages as per US Patent Law
In accordance with the provisions of US patent laws (35 U.S. Code § 284 – Damages), section 284 states that a patentee is entitled to damages adequate to compensate for any infringement and that compensation cannot be less than a reasonable royalty for the use made of the invention by the infringer.
How to determine “reasonable royalty” damages?
In past, various federal courts in US have clarified that in case patentee is unable to prove actual damages (i.e. loss profits), there exists no single methodology to determine reasonable royalty damages.
Standard Essential Patents (SEPs)
Technical standard across various industries are defined by standards organizations (SDOs) that can be patented by private companies to protect their research and development activities. Such patents relating to standardized technology may be used by patent owners to pressurize the market and create monopoly to prevent competition. Accordingly, the SDOs require their participants do disclose patents covering standards prior to adoption. SDOs further require the patent owners to license such patents on “fair, reasonable and non-discriminatory” (FRAND) terms.
However, FRAND terms have been core of various patent infringement lawsuits, specifically in the smartphone industry, wherein the industry standard covers core features of any smartphone, such as, for example, wireless connectivity (WiFi), Bluetooth, GPS (location capabilities), and the like.
WiFi Standard Essential Patents (SEPs)
In this guide to image licensing, integrated agency Crafted's Designer Chris Plowman takes you through the process of finding images online, the various licensing types that apply, the restrictions that each license type places on you and how and where you can use the images that you have found.
Open Source und Free Software unter WindowsMartin Leyrer
Die erste Assoziation zu Open Source und Freier Software ist oft eine GNU/Linux Distribution. Viele Anwender scheuen aber aufgrund der (vermuteten) Komplexität vor einem Wechsel auf das neue Betriebssystem zurück.
In diesem Talk möchte ich zeigen, dass man auch unter Windows eine Vielzahl von Open Source Anwendungen und Freie Software im täglichen Umgang mit dem PC einsetzen und so den sanfteren Wechsel zu einem freien Betriebssystem vorbereiten kann.
The Digital Music Performance Royalty ApocalypsePaul Fakler
Deck from my presentation at SXSW 2014, covering digital music licensing issues, recent developments, and potential impacts on various digital music industry parties.
The Strategic Counter-Assertion Model for Patent Portfolio ROIErik Oliver
Targeting the revenues of other companies according to the patent assertion risk they present effectively defines your patent development and external acquisition strategies. We show how to build a financial model to determine where you spend your patent development and buying dollars and then how to calculate risk and ROI.
Modeling the Value of a Strategic Patent Portfolio for High-Tech CompaniesErik Oliver
Are you looking for a financial model to explain your patent development and acquisition programs? We show how to answer your CEO’s, or GC’s, question about how much to spend on patents? We present a method to tie your strategy to a firm business plan and calculate a return on your patent investment.
Title Insurance Monopoly Disruption: iTitleTransfer Introduces Anti-Monopoly and Pro-Costumer Choice "Alternative to Title Insurance" for a Third of the Closing Cost, Authorized by Fannie Mae and Freddie Mac, utilizing Real Estate Attorney Opinion Letters.
A crucial element of formulating a firm’s technological innovation strategy is determining whether and how to protect its technological innovation. Traditionally, economics and strategy have emphasized the importance of vigorously protecting an innovation in order to be the primary beneficiary of the innovation’s rewards, but the decision about whether and to what degree to protect an innovation is actually complex.
Cleantech.org Energy Storage Venture Investment AnalysisNeal Dikeman
Cleantech.org Research Brief Energy Storage Venture Capital Investment and Valuation Analysis 2001-2009
Valuation analysis and trends of energy storage startups
Similar to Applied Royalties In The High Tech Industry (Les Nouvelles March2011 Final Publ) (20)
Cleantech.org Energy Storage Venture Investment Analysis
Applied Royalties In The High Tech Industry (Les Nouvelles March2011 Final Publ)
1. Applied Royalties
Applied Royalties In The High-Tech Industry
By Alan G. Leal
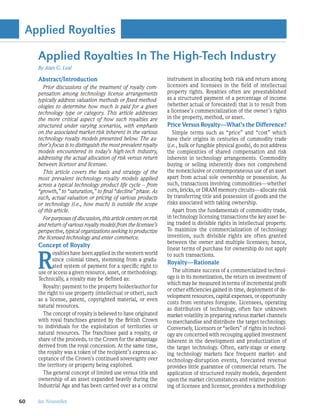
Abstract/Introduction instrument in allocating both risk and return among
Prior discussions of the treatment of royalty com- licensors and licensees in the field of intellectual
pensation among technology license arrangements property rights. Royalties often are preestablished
typically address valuation methods or fixed method- as a structured payment of a percentage of income
ologies to determine how much is paid for a given (whether actual or forecasted) that is to result from
technology type or category. This article addresses a licensee’s commercialization of the owner’s rights
the more critical aspect of how such royalties are in the property, method, or asset.
structured under varying scenarios, with emphasis Price Versus Royalty—What’s the Difference?
on the associated market risk inherent in the various Simple terms such as “price” and “cost” which
technology royalty models presented below. The au- have their origins in centuries of commodity trade
thor’s focus is to distinguish the most prevalent royalty (i.e., bulk or fungible physical goods), do not address
models encountered in today’s high-tech industry, the complexities of shared compensation and risk
addressing the actual allocation of risk versus return inherent in technology arrangements. Commodity
between licensor and licensee. buying or selling inherently does not comprehend
This article covers the basis and strategy of the the nonexclusive or contemporaneous use of an asset
most prevalent technology royalty models applied apart from actual sole ownership or possession. As
across a typical technology product life cycle – from such, transactions involving commodities—whether
“growth,” to “saturation,” to final “decline” phase. As corn, bricks, or DRAM memory circuits—allocate risk
such, actual valuation or pricing of various products by transferring title and possession of goods and the
or technology (i.e., how much) is outside the scope risks associated with taking ownership.
of this article. Apart from the fundamentals of commodity trade,
For purposes of discussion, this article centers on risk in technology licensing transactions the key asset be-
and return of various royalty models from the licensee’s ing traded is divisible rights in intellectual property.
perspective, typical organizations seeking to productize To maximize the commercialization of technology
the licensed technology and enter commerce. invention, such divisible rights are often granted
between the owner and multiple licensees; hence,
Concept of Royalty
R
linear terms of purchase for ownership do not apply
oyalties have been applied in the western world to such transactions.
since colonial times, stemming from a gradu-
Royalty—Rationale
ated system of payment for a specific right to
use or access a given resource, asset, or methodology. The ultimate success of a commercialized technol-
Technically, a royalty may be defined as: ogy is in its monetization, the return on investment of
which may be measured in terms of incremental profit
Royalty: payment to the property holder/author for
or other efficiencies gained in time, deployment of de-
the right to use property (intellectual or other), such
velopment resources, capital expenses, or opportunity
as a license, patent, copyrighted material, or even
costs from ventures foregone. Licensees, operating
natural resources.
as distributors of technology, often face unknown
The concept of royalty is believed to have originated market volatility in preparing various market channels
with royal franchises granted by the British Crown to merchandise and distribute the target technology.
to individuals for the exploitation of territories or Conversely, Licensors or “sellers” of rights in technol-
natural resources. The franchisee paid a royalty, or ogy are concerned with recouping applied investment
share of the proceeds, to the Crown for the advantage inherent in the development and productization of
derived from the royal concession. At the same time, the target technology. Often, early-stage or emerg-
the royalty was a token of the recipient’s express ac- ing technology markets face frequent market- and
ceptance of the Crown’s continued sovereignty over technology-disruption events, forecasted revenue
the territory or property being exploited. provides little guarantee of commercial return. The
The general concept of limited use versus title and application of structured royalty models, dependent
ownership of an asset expanded heavily during the upon the market circumstances and relative position-
Industrial Age and has been carried over as a central ing of licensee and licensor, provides a methodology
60 les Nouvelles
2. Applied Royalties
to achieve shared risk and return—crucial to the royalties can mitigate such risk by eliminating,
sustainability of any long-term technology venture. for example, volume- or prepaid-revenue com-
From a shared market perspective, the rationale for mitments for licensed technology.
the general application of royalties is straightforward: • Market risk (volatility)—likelihood of a li-
as the market for a product goes up, both share in the censee’s margin erosion due to net price (market
profit; as the market declines, both share the loss. price) declining more rapidly than the related
Conversely, commodity-oriented pricing and pay- license royalty to licensor. Such risk can be
ment models such as flat-fee or fixed per-unit struc- hedged by implementation of either pure run-
tures often create an “all-or-nothing” approach to ning royalties (e.g., net-based per-unit royalties)
allocation of return between merchants: one party or automatic time-functioned discounts at a
risks potential overpayment and therefore margin declination rate equal to or exceeding projected
risk ahead of realizing actual market performance, market price decli-
while the other risks undervaluation or opportunity nation rate.
■ Alan Leal,
cost of commercialization of its technology in the • Unsystematic
event market performance exceeds prior forecasts. Hewlett-Packard Company,
risk—likelihood of
From the licensee’s perspective, assuming a fixed- or unrecoverable up- Enterprise Business,
flat-fee pricing model regardless of the technology’s front investment Technology Licensing
market performance often serves to insulate the due to nonrecurring Roseville, CA USA
owner of the technology from market volatility, often initial costs paid to E-mail: alan.leal@
at the buyer’s expense, potentially jeopardizing the licensor. Such risk hp.comdesolapate.com
business association between owner and licensee as can be minimized
market conditions deviate. by the avoidance of
Why Do Royalties Matter? upfront credits, prepaid royalties, or other artifi-
Critical revenue-generating deals (i.e., product ini- cial commitments often sought by the licensor.
tiatives representing significant impact on profitability Unsystematic costs rapidly increase overpayment
and revenue) and key technology deals (i.e., technol- risk for the licensee.
ogy development or licensing initiatives with signifi- Technology Product Life Cycle and
cant impact to an organization’s design ability and Profitability Phases
intellectual asset portfolio) require the preservation For purposes of the current discussion, assume
of profit and competitive position throughout the life a typical commercialized technology product life
cycle of commercialized technologies. Successfully cycle where a given technology’s market price peaks
applied royalties are essential to the commercial suc- shortly after product introduction (where t = 0), and
cess of any licensed technology market introduction. follows a nonlinear decline over time due to market-
Sustainable new business—whether new or suc- and technology-displacing events (i.e., weakening
cessor technology to current markets—hinges upon demand for mature technology with the introduction
successfully applied royalties serving as the
most effective hedge against market volatil- Figure 1: Technology Product Life Cycle–
ity and margin risk inherent in technology
Profitability Phases
monetization. Minimizing market, margin,
and upfront, or unsystematic risk generates a
decisive advantage for the combined objectives
of technology alliances seeking to productize
and deliver technologies to targeted markets. List
Problems of Poorly Structured Royalties Growth
price
Problems most frequently encountered from phase
poorly-structured technology royalties can be
summarized as follows: Saturation
phase
Price
• Margin risk—likelihood of incurring Actual
Decline
license or material costs that are either phase
sales
price
unprofitable initially or become so over (ASP)
time due to a combination of inflated li- Time
cense costs and declining net sales. Applied
March 2011 61
3. Applied Royalties
of superior technology, products, or methods).
For simplicity in illustrating the comparative Figure 2: Paid-Up or Lump-Sum Royalty
effects upon margin (versus profit) of the most
commonly-applied royalty structures, also as-
sume sales volume remains constant (linear) Effect of a paid-up or lump
with time and unit volume directly proportional sum royalty amortized over
product life cycle
throughout the product life cycle.
The profitability phases of the typical technol-
List
ogy life cycle represented above are: price
Growth phase—the ascending path of ini-
tially successful commercialized technologies;
Break-even point for
the lesser the slope, the greater the profitability paid-up royalty over
and period of commercial relevance. product life cycle
Price
Actual
Saturation phase—the path of established sales
License cost (royalty)
or mature technologies; the flatness of the price
curve depends on the relative strength of the (ASP)
technology against competitive forces. Time
Decline phase—inherent with continuing
technology innovation, this phase represents • Note: the graphs in the Figures presented
a mature technology’s inevitable loss of commercial assume sales performance / volume of licenses
viability as a result of displacing or disruptive com- sold to be cumulative over time; thus, the x-axis
peting technologies (e.g., floppy disks v. CD’s v. USB represents time and volume cooperatively.
flash storage). • Note 2: the dotted curve in Figure (2) illus-
Applied Royalty Models trates the high initial royalty cost resulting from
Technology royalties can be structured under mul- a licensee’s upfront payment of all the combined
tiple models; from upfront lump-sum payments to royalty costs of all projected future license sales
running per-unit fees, and including numerous hybrid during the license period.
models. The following are, in order of descending risk • Note 3: if the licensee’s sales volumes continue
to the licensee, the most commonly applied technol- sufficiently during the paid-up royalty period, the
ogy royalty models with a comparative evaluation of effective amortized per-license royalty cost reach-
the strengths and weaknesses of each:
es a break-even point (i.e., the licensee’s material
• Paid-up or lump-sum royalty margin reaches 0 percent), with the licensee’s
• Minimum royalty margin inflection point eventually surpassed as
• Fixed per-license royalty additional product sales realize a positive material
• Volume- or revenue-based discounted royalty margin as sales volume accumulates during the
• List-based royalty (LBR) paid-up royalty period.
• Net-based royalty (NBR) In determining paid-up or lump-sum royalty models,
central among consideration is the duration of the
Paid-Up or Lump-Sum Royalty paid-up royalty period for which the lump-sum royalty
Application: payment covers the licensee’s sale and distribution
Paid-up or lump-sum royalties are most commonly of the licensor’s technology.
formulated upon the total perceived commercial Advantages:
value of the technology as monetized by the licensee,
Opposed to a minimum royalty (see below), a paid-
payable either as a preestablished single payment
up or lump-sum royalty serves as an “all-you-can-eat”
upfront or in fixed installments (e.g., quarterly). The
payment entitling a licensee to sell unlimited subli-
effect upon the licensee of such upfront royalties is
the immediate negative impact upon product gross censes or units of the technology during the covered
margin performance with the licensee’s overpayment licensing period. The potential advantage to the
or margin risk being overcome only if the licensee’s licensee is the potential to amortize the per-license
sustained unit sales volume and market price even- royalty cost over a larger-than-expected sales volume,
tually exceed the initial cost burden of the paid-up thereby effectively reducing the average license cost
license (see Figure 2). as sales volume increases.
62 les Nouvelles
4. Applied Royalties
Caveats: take the form of an assessed prepaid fixed minimum
For the licensee, paid-up royalties are among the payment, independent of actual market performance
riskiest of royalty models in that such are least related or sales factors, which is then credited against suc-
to the licensee’s actual sales performance of the li- ceeding license sales by the licensee.
censed technology. Such royalties often include the A crucial element for the licensee in avoiding over-
presumption of anticipated future license sales over payment risk in determining an applied minimum
the paid-up sales period; thus, the forecast assump- royalty is whether the licensee possesses superior
tion is central to the negotiation of such royalties. market knowledge of the total value of the prospec-
As opposed to per-license royalty models discussed tive technology over the product life cycle.
below, the difficulty inherent with such lump-sum • Note: the dotted curve in Figure (3) illustrates
royalties is in consolidating the entire royalty discus- the high initial royalty cost resulting from the
sion to a single value, amplifying the licensor’s and licensee’s accelerated royalty payment against
licensee’s competing interests in establishing the a portion of projected, but unrecognized future
royalty amount. license revenue during the license period.
In effect, such royalties impose the ominous obliga- • Note 2: the amount of the applied minimum
tion of reducing the basis of the licensee’s royalty costs royalty, the length of time available to the li-
to a single guess as to total future market performance censee for royalty recovery, and the accuracy of
of the end technology or product; often generating a the licensee’s market data (e.g., volume forecast,
significant overpayment risk to the licensee as it ad- actual net price, progressive price erosion, cost
dresses competitive pricing pressure and potentially of sales) are critical factors in driving profit per-
disruptive market events. Both parties are relegated formance under such a royalty structure.
to agreeing to in effect a single calculated number • Note 3: if the licensee’s sales volumes increase
upon which both licensor and licensee face either an sufficiently during the royalty period, the effec-
overpayment risk in the case of the licensee, or an tive amortized per-license royalty cost reaches
opportunity cost in the case of the licensor. a break-even point (i.e., the licensee’s material
Minimum Royalty margin reaches 0 percent), with additional prod-
Application: uct sales eventually realizing an increased true
Minimum royalties require a guaranteed payment material margin typically through the remainder
payable either upfront at the beginning of the technol- of the royalty period.
ogy transaction or with the commencement of each Advantages:
successive reporting period (e.g., month, quarter) The distinction of minimum royalties from lump-
for which royalties are due. Similar to paid-up or sum models is that ostensibly only a portion of
lump-sum royalties, minimum royalty models typically the licensee’s total perceived value of the licensed
technology is required by the upfront pay-
ment. Apart from the accuracy of the applied
Figure 3: Minimum Royalty royalty rate, minimum royalties represent a
slightly-mitigated risk versus total paid-up or
lump-sum royalties calculated to represent
Effect of minimum royalty the entire value of the licensed technology
amortized over product life over the expected commercial life cycle of the
cycle
intended product.
Caveats:
List
price A minimum royalty provides significantly lim-
ited protection to the licensee against market
volatility. The central risk in assuming minimum
Break-even point for
minimum royalty over
royalties is that otherwise variable royalty costs
product life cycle (i.e., royalties which scale as a portion of actual
Price
Actual revenue) are converted to an accelerated fixed
sales
License cost (royalty)
price cost irrespective of actual sales performance.
(ASP) Especially in the case with emerging technolo-
Time gies, such risks often become difficult to predict
resulting in wide-fluctuating returns; hence the
March 2011 63
5. Applied Royalties
increased risk to the licensee of overpayment risk and as the actual net sales price for the technology
loss of profitability. In such cases, minimum royalty declines.
models operate as “credit” or prepaid royalties, the Advantages:
result of which is to generate a fixed unrecoverable Fixed per-unit royalties offer an incremental expo-
royalty cost absorbed by the licensee in the event of sure to the licensee for incurred royalty costs. Effec-
minimal or no sales performance. tively, royalties accrue as actual sales are made and
Fixed Per-License Royalty in proportion to the volume of sales realized. Such
Application: simplified royalty models may be appropriate in cases
A fixed per-license royalty is a running per-unit pay- of mature, more static product markets (e.g., market
ment, the rate of which remains fixed over a given oligopolies such as the sublicensing of predominant
period. A key distinction of fixed per-license royalties O/S platforms) where the licensee benefits from
is that royalties are payable in increments typically highly-accurate market and historical data in forecast-
tied to the licensee’s actual sales of licenses or units ing future sales performance.
of the technology, versus lump sums otherwise re- Caveats:
quired under paid-up models. The established royalty Fixed per-unit royalties are among the highest-risk
rate under a pure fixed per-license royalty (as opposed running royalties encountered by technology licens-
to models discussed below) remains constant for ees. The primary challenge to licensees in considering
each unit or license sold and is independent of sales, pure fixed per-license royalties is that no relief is pro-
performance, market, or other competitive factors vided to mitigate progressive price erosion over time.
incurred by the licensee in the commercialization of Given that the profitability of nearly all technologies
the technology. bears the effects of declining market relevance over
Similar to the royalty models discussed above, a time (see Figure 1), under such royalty models, mar-
key consideration for the licensee in determining a gin retention becomes a significant challenge for the
fixed per-license royalty is whether the licensee pos- licensee, with the bulk of associated start-up costs to
sesses superior market knowledge of the total value commercialize and distribute the resulting product
of the technology over the technology’s product life absorbed upfront. Consequently, fixed per-unit royal-
cycle, with particular scrutiny given to anticipated ties offer no protection of margin retention in volatile
price erosion during the expected product life cycle. or declining markets.
Figure (4) below represents the margin risk inherent Volume- or Revenue-Based Discounted Royalty
with fixed per-license royalty models. Application:
• Note: the fixed royalty cost in Figure (4) is il- A volume- or revenue-based discounted royalty is
lustrated by the lateral dotted line representing a running per-license royalty which remains fixed
a constant royalty cost applied against all tech- over time, subject to adjustment of the applied roy-
nology sales during the royalty period. Note also alty rate contingent upon preestablished volume or
that when a fixed royalty model is imposed, the revenue targets being met by the licensee’s sales or
licensee’s resulting royalty margin deteriorates distribution volume of the licensed technology.
Volume- or revenue-based discounted royalties
Figure 4: Fixed Per-Unit Royalty offer limited margin retention for licensees, the
effect of which is that royalty cost relief is real-
ized only after and until a prolonged period of
static royalty cost is applied against successive
technology sales until a preestablished sales or
Material
List volume milestone is reached. The effect is a
price
margin compression of the licensee’s resulting license
decreases or material margin which continues until the
over time given sales or volume performance threshold
is reached.
Price
Actual Key factors in determining a volume- or
License cost (royalty) sales revenue-based discounted royalty are deter-
price
(ASP) mination of the initial royalty rate, the viability
Time of the preestablished performance milestones
to be reached, and the comparative rate of the
64 les Nouvelles
6. Applied Royalties
royalty discount vis-à-vis the projected price erosion carried by the licensee through the technology life
of the commercialized technology over time. As illus- cycle. Discounted royalties may be appropriate for
trated in Figures (5) and (6) below, such discounted licensees with strong or exceptional sustained sales
royalty models can generate wide-ranging results upon performance within a target technology market. Such
licensee royalty margin. metrics are most often accurately forecasted within
• Note: the progressive-tiered discounted royalty mature or static markets.
structure illustrated above represents the effects Additionally, the discounted royalty model can be
of a constant royalty subject to periodic royalty inversely applied as a regressively-tiered royalty. Re-
rate reductions upon specific sales milestones. versing the initial allocation of margin risk between
The effect of such a royalty model is a step-func- licensee and licensor, a regressively-tiered royalty
tioned royalty cost curve with successive margin provides the licensee with the more favorable position
compression and expansion for the licensee of an initial lowest per-license royalty as an incen-
throughout the technology life cycle. tive to induce distribution and sales momentum as a
Advantages: market channel in an effort to proliferate the licensed
Discounted royalty models can provide limited but technology.
non-proportional scale to the royalty cost burden Caveats:
Discounted royalties are often sought by
licensors as a hedge against unknown sales
Figure 5: Volume- or Revenue-Based competency or marketing efficiency of new li-
Discounted Royalty–High Volume censees and the volatility of emerging markets,
allowing the licensor to gain a disproportion-
ately higher return from the licensee’s initial
sales cycle, the effect of which imposes margin
License cost pressure on the licensee to accelerate sales
(royalty) List volume in order to recover profit by achieving
price royalty cost adjustment. A primary caution for
Material margin more
highly sustained the licensee in considering discounted royalty
structures is the net effect such royalties im-
pose when entering technology markets exhib-
Price
Actual iting significantly volatile or declining markets.
Royalty discounts occur upon exceeding sales Because such royalties are tied to cumulative
set volume or revenue milestones price sales or volume activity and not actual price
(ASP)
Time or profit performance, discounted royalties
provide licensees with little protection against
market volatility (e.g., progressive price ero-
sion, displacing market or technology events).
Under such conditions, the licensee faces
Figure 6: Volume- or Revenue-Based continually decreasing margins and reduced
Discounted Royalty–Low Volume ability to counter competitive market pricing
pressures. The result is that the licensee must
either continue to sell the technology at the
expense of profit or else withdraw from po-
License cost
List
tentially strategic markets, conceding market
(royalty)
price share to advancing competition.
Material margin severely impacted List-Based Royalty (LBR)
Application:
A list-based royalty (LBR) is a running per-
Price
Actual license payment, the rate of which is variable
Royalty discounts occur upon exceeding sales typically in the form of a percentage of a refer-
set volume or revenue milestones price
(ASP) ence or list per-license price for the productized
Time technology to be licensed. An LBR’s variability is
contingent upon the reference list price being
March 2011 65
7. Applied Royalties
adjusted, as the royalty model is typically established and expansion for the licensee throughout the
as a percentage of the list price. LBR royalties are dis- technology life cycle.
tinguished from volume- or revenue-based discounted • Note 2: LBR models are often sought by licen-
royalty models in that LBR’s are variable solely upon sors to alleviate concerns over potential sacrificial
the associated reference list price. In theory, for so discounting by licensees. LBR’s are most often
long as the associated list price remains static, so too successfully applied with mature technologies
does the per-unit license or royalty cost to be paid exhibiting stable market performance (i.e., price
by the licensee. Thus, in the event of an unchanged declination behavior and competitive markets are
or infrequently-adjusted reference list price, LBR’s well-known).
may in practice operate as a fixed per-license royalty, Advantages:
remaining constant for each unit or license sold,
An LBR offers licensees limited protection against
independent of sales, performance, market, or other
market volatility, allowing for improved margin reten-
competitive factors the licensee faces in commercial- tion over fixed per-license royalties and performance-
izing the technology. based discounted royalty models. LBR royalty models
Key considerations in the application of list-based can provide limited but non-proportional scale to the
royalties are the establishment and control of the royalty cost burden carried by the licensee through
reference list price from which the resulting LBR the technology life cycle. LBR royalties may be appro-
royalty is to be calculated (i.e., whether the refer- priate for licensees with strong sustained sales per-
ence list price is that of the licensee’s, licensor’s, a formance within stable, mature technology markets.
third-party’s, or other market-derived reference). Cal- Given that the applied royalty adjusts concurrently
culation of LBR royalties would be therefore derived with changes to the associated reference list price,
from the number of licenses sold times the applied LBR’s can provide periodic royalty cost relief if the
percentage of the then-current applicable reference associated reference list price remains proportionate
list price for the trading period. Thus, superior market to then-current market prices.
knowledge of the target market’s anticipated price Caveats:
erosion over the expected product life cycle and the Problems inherent with LBR models occur with di-
ability to adjust a technology’s associated reference vergence between the applied reference list price from
price are critical in preserving the licensee’s profit- which the royalty is calculated, and the actual street
ability from productizing the licensed technology. or net sales price of the commercialized technology.
• Note: the list-based royalty model illustrated Such disparity often results from applied discounts
above represents a constant royalty subject to that licensees must often absorb to sustain unit sales
periodic royalty rate reductions based upon ad- and distribution performance. Thus, a key factor in
justments in the associated reference list price applying LBR royalty models is the degree to which
for the given technology. The effect of such a the applied reference list price scales to actual net
royalty model is a step-functioned royalty cost sales prices over time. The greater the divergence be-
curve exhibiting successive margin compression tween the reference list price and actual street price,
the greater the licensee’s effective per-license
Figure 7: List-Based Royalty (LBR) royalty cost becomes, resulting in increased
margin risk and decreasing margin over time.
Acceptable material margin Assuming an LBR’s reference list price
is controlled by the licensee, some margin
Material margin declines
relief can be gained by the licensee effect-
List ing a reduction in the list price. In practice,
price however, administrative limitations often limit
Potential for negative material margin the frequency of such list price adjustments.
as actual net (street) price declines Consequently, price declination may occur with
License cost every point-of-sale transaction, whereas the
(royalty) associated reference list price may be adjusted
Price
Actual only infrequently.
sales
Material cost adjusted in-step functioned phases price Net-Based Royalty (NBR)
(ASP)
Application:
Time
A net-based royalty (NBR) consists of run-
66 les Nouvelles
8. Applied Royalties
ning per-license payments to the licensor, with the volatile markets. In practice, because net sales price
amount of such payments based on a percentage of performance can fluctuate with every point-of-sale
the actual net sales revenue received by the licensee transaction, an NBR provides margin retention by
from sublicensing the licensor’s technology. Calcula- adjusting the licensee’s royalty cost burden continu-
tion of NBR payments is typically made periodically ously in constant proportion with each license sale
(i.e., monthly or quarterly) with the application of the as market performance varies throughout the tech-
agreed royalty rate percentage or basis applied to the nology’s life cycle. Subsequently, in cases where the
aggregate net sales by the licensee over the period licensee must absorb increasing price discounts in or-
reported, resulting in the royalty sum payment made der to sustain unit sales and distribution performance,
to the licensor. an NBR offers the licensee a significant hedge against
An NBR is a prime example of a “pure” applied unforeseen market volatility and price declination. In
royalty, with the main determinant being tied to ac- short, as the licensee’s revenue increases, so does the
tual net sales performance precluding any additional licensor’s: as the licensee’s revenue declines, so too
payments apart from the per-license running royalty. proportionally does the licensor’s.
As such, additional payments such as support pay- Caveats:
ments, maintenance fees, or unsystematic costs such Since applied NBR royalty returns are largely a
as NRE payments may be avoided by negotiating the proportion of a licensee’s actual net sales, NBR’s
factoring of such costs of the licensing arrangement effectively present unlimited upside and downside
into the agreed running royalty percentage for the potential to the licensor. Consequently, while per-
applied NBR royalty. license margin performance is preserved under NBR
Given an NBR’s static applied royalty rate, an NBR’s models, a primary concern for licensors in considering
variability is wholly contingent upon the actual street pure NBR’s is the effect of unforeseen price erosion
price performance for the technology being licensed upon profit. Under an NBR model, technologies
and its unit sales performance given the licensee’s licensed in significantly volatile or declining markets
marketing efficiencies against extrinsic market forces will generate the greatest variance upon net revenue
(e.g., competitive pricing pressures, disruptive tech- and resulting profit for both licensee and licensor.
nologies). As such, NBR royalties are distinct from Additionally, licensor concerns may arise over
LBR royalty models in that the variability of return “sacrificial discounting”—a product pricing tactic
generated by NBR royalties is solely dependent sometimes encountered when sales of the licensed
upon the licensee’s actual net, or street revenue. technology are sold in combination or “bundled”
Under such an applied model, both the licensor and with other of the licensee’s marketed products. In
licensee may realize theoretically unlimited upside instances where the licensed technology may be
and downside potential in the monetization of the sold within a combined or overall solution sale at
licensed technology. a disproportionately higher applied discount, the
Because no arbitrary factors such as fixed royalty effect can be to increase the licensee’s resulting
costs, reference pricing, or preestablished volume or overall margin while reducing the licensee’s license
revenue requirements are ordinarily avoided in
applied NBR royalty models, the key consider- Figure 8: Net-Based Royalty (NBR)
ation of NBR models is the applied royalty rate.
Negotiation of this item becomes the principal
determinant of the resulting license margin of
both the licensor and licensee. The illustration
in Figure (8) below represents how an applied
List
NBR model can preserve license margin for price
both licensor and licensee throughout a tech- Material margin sustained
nology’s life cycle, including fluctuations in over product life cycle
street price performance.
Advantages: License cost
Price
(royalty) Actual
Net-based royalties are among the most struc- sales
turally advantaged royalty models for preserving price
(ASP)
sustained margins for licensed technologies,
Time
especially when engaging emerging or highly-
March 2011 67
9. Applied Royalties
cost—and the licensor’s resulting license revenue. technology is highly dependent upon its implementa-
Such concerns over potential sacrificial discounting tion of applied royalties that sustain profitability while
can be alleviated when the licensed technology is to perpetuating commercial relevance. An organization’s
be sold as a stand-alone product by the licensee, as development of a central intellectual property strat-
the licensee’s revenue will be proportionally impacted egy that discerns the advantages—and risks—inher-
by any decline in the final sales price of licenses sold. ent among the technology royalties encountered
Sacrificial discounting concerns are also minimized in today’s high-tech arena is the cornerstone for
in cases where the licensed technology is a predomi- successful commercialization—and avoidance of the
nant portion of the licensee’s product portfolio or often catastrophic pitfalls encountered from poorly-
represents a significant portion of the licensee’s total structured technology deals.
expected revenue. With the implementation of a disciplined, struc-
In arrangements where concerns over sacrificial tured approach to the monetization of strategic
discounting remain high, hybrid royalty models such technologies, an organization can expand its asset
as NBR’s with floor pricing and other more elaborate potential by maximizing investment efficiency and
models (e.g., industry standard method, discounted leverage, balancing product portfolio risk, maintain-
cash-flow (NPV) method, Monte Carlo analysis, Black- ing competitive positioning, and ultimately, estab-
Sholes options pricing), may enter discussion. Such lishing sustained exceptional financial performance.
advanced (and administratively more costly royalty An understanding of the basis and strategy of the
methodologies) are beyond the intended scope of industry’s most prevalent technology royalty models
the current royalty treatise.
and their implications is key in mastering the pro-
Conclusion ductization and delivery of relevant technologies to
The crux of an organization’s success in monetizing targeted markets. ■
68 les Nouvelles