1. APPLIED MICROBIAL AND CELL PHYSIOLOGY
Quantitative monitoring of 2-oxoglutarate in Escherichia coli
cells by a fluorescence resonance energy transfer-based
biosensor
Chang Zhang & Zi-Han Wei & Bang-Ce Ye
Received: 24 April 2013 /Revised: 7 June 2013 /Accepted: 10 July 2013 /Published online: 28 July 2013
#
Abstract 2-Oxoglutarate (2OG) is a metabolite from the
highly conserved Krebs cycle and not only plays a critical
role in metabolism but also acts as a signaling molecule in a
variety of organisms. Environmental inorganic nitrogen is
reduced to ammonium by microorganisms, whose metabolic
pathways involve the conversion of 2OG to glutamate and
glutamine. Tracking of 2OG in real time would be useful for
studies on cell metabolism and signal transduction. Here, we
developed a genetically encoded 2OG biosensor based on
fluorescent resonance energy transfer by inserting the func-
tional 2OG-binding domain GAF of the NifA protein between
the fluorescence resonance energy transfer (FRET) pair YFP/
CFP. The dynamic range of the sensors is 100 μM to 10 mM,
which appeared identical to the physiological range observed
in E. coli. We optimized the peptide lengths of the binding
domain to obtain a sensor with a maximal ratio change of 0.95
upon 2OG binding and demonstrated the feasibility of this
sensor for the visualization of metabolites both in vitro and
in vivo.
Keywords Genetically encoded biosensor . Fluorescent
protein . FRET . 2-Oxoglutarate . In vivo imaging
Introduction
2-Oxoglutarate (2OG) is derived from the Krebs cycle (Zhao
et al. 2010), which is a highly conserved central metabolic
pathway, and is at the interface between carbon and nitrogen
metabolism. The central carbon intermediate 2OG also serves
as the sole carbon skeleton for the assimilation of nitrogen,
and it participates in the generation of glutamate through the
glutamine synthetase/glutamate synthase (GS/GOGAT) sys-
tem. GS assimilates ammonia by converting glutamate to
glutamine. GOGAT then transfers the amido group of gluta-
mine to 2OG to form two glutamates. Other nitrogen-
containing compounds derive nitrogen from glutamate and
glutamine by secondary amino transfers. In a wide range of
Bacteria and Archaea, 2OG, which is the donor for ammonia
assimilation, signals nitrogen deficiency, whereas glutamine,
which is the fully aminated product, often signals nitrogen
sufficiency. From this perspective, in addition to its impor-
tance as a metabolite, 2OG also transmits critical signals in
metabolic activities (Martinez-Argudo et al. 2005). In the
cytosol of living cells, the signal transduction proteins GlnB
and GlnK, which belong to the PII superfamily (Leigh and
Dodsworth 2007), sense cellular 2OG or glutamine as an
indicator of the nitrogen state. High levels of cellular 2OG,
an indicator of nitrogen deficiency, inhibit the GlnB signal
system. The physiological 2OG concentrations in Escherichia
coli have been estimated to be in the 0.1–0.9 mM range under
nitrogen-sufficient conditions (Senior 1975). The convention-
al 2OG quantification method requires the use of cell extracts
and is thus incompatible with studying dynamics in intact
individual cells; furthermore, it can only provide the averaged
2OG pool concentration of many cells.
Recently, there have been efforts to directly measure and
visualize metabolites in cell by using genetically encoded
fluorescence resonance energy transfer (FRET)-based biosen-
sors, which can be targeted to subcellular compartments to
specifically analyze concentration changes within a specific
compartment of an intact live cell (Fehr et al. 2005). A series
of genetically encoded nanosensors has been constructed that
utilizes FRET technology for noninvasive and temporally and
spatially resolved monitoring of signal molecules in vivo. The
genetically encoded FRET biosensors consist of a recognition
C. Zhang :Z.<H. Wei :B.<C. Ye (*)
Laboratory of Biosystems and Microanalysis, State Key Laboratory
of Bioreactor Engineering, East China University of Science and
Technology, Shanghai 200237, China
e-mail: bcye@ecust.edu.cn
Appl Microbiol Biotechnol (2013) 97:8307–8316
DOI 10.1007/s00253-013-5121-5
Springer-Verlag Berlin Heidelberg 2013
2. module that specifically binds a ligand and is sandwiched
between two variants of green fluorescent protein (GFP) (typ-
ically CFP and YFP) (Ewald et al. 2011). The efficiency of
fluorescence energy transfer between two fluorophores is
highly dependent on their distance and orientation (Jares-
Erijman and Jovin 2006; Piston and Kremers 2007).
Conformational changes caused by ligand binding to this
recognition module induce changes in FRET efficiency be-
tween the donor and acceptor pair because of the alteration in
distance between the fluorophores. With this strategy, fluores-
cent biosensors have been engineered using many types of
protein modules (e.g., enzymes, membrane receptors, and
ligand-binding proteins) as substrate-recognition modules to
image signaling molecules in living cells, such as glutamate
(Hires et al. 2008; Okumoto et al. 2005), hydrogen peroxide
(Yano et al. 2010), cAMP (DiPilato et al. 2004; Ponsioen et al.
2004), ATP (Imamura et al. 2009), cGMP (Honda et al. 2001;
Nikolaev et al. 2006), phosphoinositides (Cicchetti et al.
2004), inositol 1,4,5-triphosphate (IP3) (Tanimura et al.
2009), diacylglycerol (Sato et al. 2006), and bacterial
quorum-sensing signaling molecules (Rajamani et al. 2007).
Recently, various bacterial periplasmic binding proteins
(PBPs) from gram-negative bacteria, which undergo a confor-
mational change upon ligand binding, have successfully been
used to develop FRET nanosensors for central metabolites
such as glutamate, maltose, ribose, arabinose, sucrose, galac-
tose, and glucose (Fehr et al. 2002, 2003; Knetsch et al. 2002;
Lager et al. 2003; John et al. 2008).
In this study, we constructed a genetically encoded fluores-
cent biosensor for 2OG, employing the 2OG-binding domain
GAF of the NifA protein derived from the aerobic soil-
dwelling organism Azotobacter vinelandii. The 2OG-sensing
protein NifA belongs to a family of enhancer-binding proteins
(EBPs) that activates transcription by RNA polymerase con-
taining the sigma factor (Martinez-Argudo et al. 2004). NifA
is a multidomain protein consisting of an amino terminus
GAF domain, which is a ubiquitous signaling motif found in
signaling, and sensory proteins from all three kingdoms of life
(Aravind and Ponting 1997; Ho et al. 2000), a central catalytic
(AAA+) domain required to couple nucleotide hydrolysis to
activation of the σ54
-RNA polymerase holoenzyme, and a
carboxyl-terminal DNA-binding domain (Buck et al. 2000;
Morett and Segovia 1993). Upon the binding of 2OG to the
amino-terminal GAF domain, NifA induces a conformational
change and inhibits the binding of NifL to NifA. Mutations
conferring resistance to NifL are located in both the GAF and
the AAA + domains of NifA. Because it is unclear whether the
AAA + domain is necessary for the conformation change, we
chose two different parts of NifA, the GAF domain and GAF-
AAA + domain, as detector domains to create FRET-based
biosensors. The two sensors both exhibited ratio changes on
binding to 2OG in vitro, which led to the conclusion that
ATPase (AAA + domain) is not vital for the conformational
change in the GAF domain. In the presence of ligands, the
biosensors showed a concentration-dependent decrease in
FRETefficiency. We also systematically engineered the linker
moiety by inserting peptide connectors with different lengths.
The resulting biosensor with an optimized linker was used to
monitor the dynamic in vivo responses of E. coli to the
addition of different carbon sources and to image 2OG in
intact individual cells by using a confocal microscope. This
reporter, OGsor, shows the cellular 2OG dynamics in E. coli
cells upon metabolic challenges.
Materials and methods
Construction of plasmids
The restriction sites for four enzymes — BamHI, EcoRI, SacI
and SalI — in the pET-28a (+) vector were chosen for tandem
fusion of YFP, the 2OG-binding domain (GAF or GAF-
AAA+), and CFP to construct a FRET biosensor. CFP and
YFP (mutants of EGFP,GenBank Accession #U55762.1)
were cloned from the commercially available plasmids
pECFP-N1 (Clontech catalog #6900-1) and pEYFP-N1
(Clontech catalog #6006-1). A candidate gene encoding the
2OG reaction domains GAF and GAF-AAA + included in the
NifA-encoding gene (NC_012560.1) was amplified from the
genome of A. vinelandii (strain number 10088) purchased
from the Agricultural Culture Collection of China (ACCC),
Beijing, by polymerase chain reaction (PCR) amplification
(TakaRa, Japan). The restriction endonucleases were obtained
from New England Biolabs (Ipswich, MA, USA). All the
chemicals, including 2OG, L-glutamic acid, and L-glutamine,
were of analytical grade and were purchased from Amresco
(Solon, OH, USA). E. coli DH5α was used as the cloning host
and E. coli BL21 (DE3)pLysS was used as the protein pro-
duction host, and they were purchased from TransGen
Biotech (Beijing, China).
In vitro assays
E. coli BL21 (DE3) pLysS expressing OGsor was grown for
3 h in LB medium at 37 °C before induction by the addition of
0.5 mM isopropyl-β-D-thiogalactopyranoside (IPTG) over-
night. The cell pellet was suspended in 50 mM PBS
(pH=8.0) buffer before sonication, and all the analytes were
dissolved in the same buffer and adjusted to a final pH of 8.0.
Fluorescence was measured in a fluorescence microplate read-
er (Bio-Tek Instrument, Winooski, VT, USA) by using a black
96-well microplate (Fluotrac 200, Greiner, Germany).
Emission wavelengths of 478 and 528 nm, or a continuous
spectrum from 460 to 600 nm, were monitored using excita-
tion at 440 nm. The blank measurement was obtained from a
well containing only OGsor with a control buffer. FRET levels
8308 Appl Microbiol Biotechnol (2013) 97:8307–8316
3. have been represented as the ratio of the emission intensities at
528 and at 478 nm when the sensors were excited at 440 nm.
The signal intensity with 2OG was defined as the change in
the 528/478 ratio. The dissociation constants (Kd) were deter-
mined by fitting the titration curves to a single-site-binding
isotherm: R=Rapo+(Rsat−Rapo) × X/(Kd+X) (Ewald et al.
2011), where X is the ligand concentration, R denotes ratio,
Rapo is the ratio in the absence of ligand, and Rsat is the ratio at
saturation with ligand. All ratio values were derived from the
averages of at least three titration experiments.
2OG pool measurements
For 2OG measurement, 1 ml of cells was collected and im-
mediately washed with 1 ml of the medium. After the tube was
centrifuged, it was placed into liquid nitrogen immediately to
terminate in vivo metabolism and was then placed in water
maintained at room temperature. This early-stage protocol
should be performed as quickly as possible to decrease 2OG
consumption. The shift between liquid nitrogen and room-
temperature water was repeated three times to kill the cells.
Before sonication, the cells were suspended in 5 ml of 50 %
methanol. The pool value in nanomoles per milliliter of cells
at 1.0 OD600 was converted directly into a millimolar internal
concentration (Okano et al. 2010). 2OG was measured using a
Shimadzu Prominence HPLC system (LC-20AT and SPD-
20A UV/vis fluorescence detector), where 20 μl of the sample
was injected into the HPLC column, which was a C18
reversed-phase main column (ODS-4, 5 μm, 4.0×250 mm),
and maintained at 30 °C during separation. The elution buffer
was 20 mM K+
phosphate buffer (pH 7.0). The flow rate was
0.4 ml/min and the detector was set at 233 nm.
In vivo assays
E. coli BL21 (DE3) pLysS expressing OGsor was grown for
3 h in LB medium at 37 °C before induction by the addition of
0.5 mM IPTG overnight. Cultures were stored overnight at
4 °C for sufficient maturation of fluorescence protein, and the
fluorescence was measured in a fluorescence microplate read-
er (Bio-Tek Instrument) using black 96-well microplates
(Fluotrac 200; Greiner, Germany). Emission wavelengths of
478 and 528 nm, or a continuous spectrum from 460 to
600 nm, were monitored with excitation at 440 nm. The cells
were then starved in carbon-free M9 medium containing
50 mg/l kanamycin sulfate (Kaper et al. 2008) for 4 h at
37 °C, and 190-μl cultures were transferred to 96-well plates.
Subsequently, 10 μl of glucose, 2OG, citrate (all final con-
centrations of 10 mM), or carbon-free M9 was added manu-
ally to the cultures. The ratio change before and after the
addition of the compounds was determined using a fluores-
cence microplate reader and shaking at 170 rpm between
readings. The fluorescence emission at 478 and 528 nm (ex-
citation wavelength, 440 nm; bandwidth, 2 nm) was recorded.
Live cell imaging
E. coli BL21 (DE3) pLysS expressing OGsor was prepared as
mentioned in the “In vivo assays” section. Before live cell
imaging, E. coli cells were transferred to a cover slide and
immobilized in 2 % alginate and Ca2+
in a total volume of
10 μl (Fehr et al. 2002). Carbon sources (all final concentra-
tions, 10 mM) were added (volume, 1 μl) on top of the
alginate-embedded cells. Images were acquired using a Zeiss
710 laser scanning confocal microscopy (LSCM) system on a
Zeiss Axio Observer Z1 inverted microscope with a Plan-
Apochromat 63×1.4 NA oil immersion objective. The dual
emission intensity ratio was recorded with 458 nm excitation
and two emission filters (480 nm/40 for CFP and 535 nm/30
for YFP). Pseudocolor images indicate the change in the YFP/
CFP ratio after addition of the carbon source. Considering that
exposure of a single cell to high laser power would lead to
photobleaching, a field containing approximately 50 E. coli
cells was chosen for laser excitation, but even under this
condition, photobleaching occurred after detection for 10 min.
Results
Design and characterization of FRET-based biosensors
To develop a FRET sensor for in vivo real-time monitoring of
2OG, we screened many 2OG-binding domains and finally
focused on the GAF domain for its specific binding of 2OG
and conformational changes and found that the monomer
form is suitable for FRET sensor construction. We excluded
GlnB, GlnK (homotrimer), and NifI1/NifI2 (heterohexamer)
from the PII superfamily because polymerization may affect
FRET efficiency. The intact GAF domain of NifA from A.
vinelandii was used as the binding domain, and it was
sandwiched directly with enhanced cyan FP (CFP) and yellow
FP (YFP). NifA contains three domains: an N-terminal GAF
domain, a catalytic (AAA+) domain, and a C-terminal DNA-
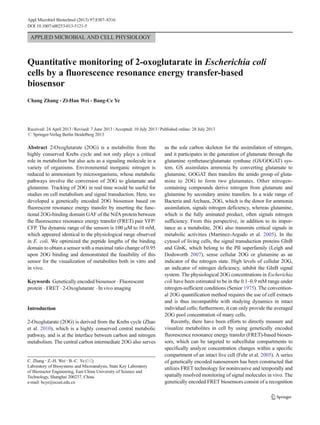
binding HTH domain (Fig. 1a). It is known that 2OG binding
of the GAF domain can be allosterically transduced into a
conformational change in NifA. Conformational change in the
GAF domain is likely to lead to a change in FRET efficiency
between CFP and YFP in the sandwich configuration de-
scribed above. Two FRET-based biosensors were generated
by flanking the GAF domain (for OGsor-G) and GAF-AAA +
domain (for OGsor-GA) with CFP and YFP to investigate the
FRET efficiency responding to 2OG (Fig. 1b,c). The tandem
fused proteins were expressed in E. coli BL21 (DE3) pLysS
(Chen et al. 2004). Two OGsors were excited at 440 nm, and
their emission spectra showed two peaks corresponding to
Appl Microbiol Biotechnol (2013) 97:8307–8316 8309
4. CFP and YFP. Addition of 2OG resulted in an increase in CFP
emission and a decrease in YFP emission. The ratio between
the YFP and CFP emission intensities of the two OGsors
changed upon addition of 2OG, which demonstrates that the
conformation change in the 2OG-recognition domain GAF is
translated into a change in FRET efficiency (Fig. 1d,e). The
decrease in the 528/478 ratio induced by 2OG suggests that
2OG binding may transform GAF domain into an open con-
formation from a relatively closed form, thereby resulting in
low FRET efficiency (Fig. 1f).
Fluorescence analyses of OGsor-G and OGsor-GA showed
that the 528/478 ratios without 2OG were 1.38 and 2.32,
respectively. When the 2OG concentration was changed from
10 μM to 10 mM, the emission ratios for the OGsors de-
creased, following sigmoid curves (Fig. 2a and Table 1), and
the maximum changes in the ratios were calculated as −0.16
and −0.42, respectively. OGsor-GA exhibited a ratio change
of 18 % (in % Rapo), which represents an improvement of
approximately 50 % over the 12 % ratio change observed for
OGsor-G. The 528/478 ratio changed upon addition of 2OG
in a concentration-dependent and saturable manner. The dy-
namic response range of the OGsor sensors was 100 μM–
10 mM. The dissociation constant (Kd) values of OGsor-G and
OGsor-GA for 2OG were found to be 687.4 and 635.8 μM,
respectively (Table 1). The dynamic ranges of the OGsors
corresponded to the physiological range observed in E. coli,
which varies from 100 μM under conditions of nitrogen
excess to 1 mM under conditions of nitrogen limitation.
To test the specificity of the OGsors for 2OG, a panel of
related metabolite compounds consisting of citrate, isocitrate,
glutamate, and glutamine was applied to the OGsor sensors.
OGsor-G and OGsor-GA were both highly selective for 2OG
and did not exhibit apparent ratio changes in the presence of
other metabolites (Fig. 2b,c) present at their physiological
concentrations in E. coli (Bennett et al. 2009).
Optimization for the improved 2OG sensor
The response magnitude and dynamic range of the FRET
signal can be efficiently increased by inserting peptide linkers
between the fluorescent protein and binding domain (Ha et al.
2007). In this study, peptide linkers were genetically fused to
FRET-based 2OG sensors to improve the response. A set of
OGsors with varying numbers of linker units (Gly4Ser) was
tested. No obvious improvement was observed, which implies
that the short linker moiety had a negligible effect on the
FRET efficiency of OGsors because these linkers did not
sufficiently change the distance or fluorophore dipole orien-
tation between YFP and CFP. Another approach for optimi-
zation is to change the fluorophore dipole orientation
(Ansbacher et al. 2012; Iqbal et al. 2008) which would change
the energy transfer efficiency. A previous study took a more
rigorous approach that used a circularly permuted GFP
(cpGFP) to vary the relative orientation of the transition
dipoles of the two chromophores and thereby achieve an
obvious optimization effect (Nagai et al. 2004). Compared
with OGsor-G (Table 1), OGsor-GA exhibited a better ratio
change (50 % increase in % Rapo), which could be considered
as a type of linker moiety optimization. Thus, the improve-
ment in OGsor-GA may have resulted from the 2-domain
configuration of the ATPase AAA + domain (201 amino
acids) attached to the GAF domain. To further maximize the
Fig. 1 Schematic representation of NifA (a), OGsor-G (b), and OGsor-
GA (c). Fluorescence emission spectra of OGsor-G (d) with (dotted line)
and without (solid line) 1 mM (final concentration) 2OG. The FRET
sensor OGsor-G was analyzed, and the fluorescence emission was
recorded using an excitation wavelength of 440 nm in a fluorescence
plate reader. The FRET sensor OGsor-GA (e) was detected in the same
manner. f Energy transfer illustration: 2OG binding caused a conforma-
tional change that decreased the energy transferred from CFP to YFP
8310 Appl Microbiol Biotechnol (2013) 97:8307–8316
5. response magnitude of OGsor, we chose the AAA + domain
as a displacement target based on the GAF-AAA + domain to
obtain a series of 2OG sensors (Fig. 3a and Table 2), with a 20-
amino-acid sequence used as a longer linker unit at the C
terminal. This displacement approach has great potential to
change both the distance and orientation between
fluorophores. Among these OGsors, OGsor-G3 yielded an
increase in the 528/478 ratio, which indicates that OGsor-G3
formed a structure upon binding of 2OG that brought the two
fluorophores closer or that the energy transfer efficiency was
enhanced. OGsor-G5 showed no response to 2OG, possibly
because of a rigid structure, whereas OGsor-G9 attained the
highest ratio change, i.e., a 258 % Δratio increase (in % Rapo)
relative to OGsor-G (Fig. 3d).
Molecular imaging and analysis of 2OG in E. coli cells
FRET sensors allow the collection of real-time data to study
the kinetics of metabolite accumulation. In this study, we also
tested the ability of the OGsor to detect intracellular 2OG
levels in living E. coli cells in vivo under different culture
conditions. 2OG is a key intermediate in central metabolism
and is located at the interface between the Krebs cycle and the
assimilatory pathway of nitrogen. The effect of carbon on
cellular 2OG levels was investigated first using a medium-
shift scheme. E. coli BL21 (DE3) pLysS cells expressing
OGsor-G9 in LB medium were transferred to carbon-free
M9 medium. The emission spectra of cells in LB and M9
media are shown in Fig. 4a. The carbon-free culture resulted in
an increase in the emission ratio from 1.67 to 2.27, which
indicates a drop in the intracellular 2OG level and quick
depletion of 2OG upon removal of carbon. Glucose, as a
favored carbon source, can be converted to 2OG through the
glycolysis pathway and Krebs cycle. We next monitored the
dynamics of 2OG levels in E. coli cells after the addition of
exogenous citrate and glucose. Citrate was used as the control
for the ratio monitoring experiments, as E. coli cells do not
metabolize citrate as a carbon source under aerobic conditions
(Pos et al. 1998). Figures 2 and 4b show that citrate and
glucose had no effect on the YFP/CFP emission ratio of the
2OG-specific FRET sensor OGsor. Citrate and glucose were
added at concentrations of up to 10 mM to the E. coli cells in
M9 medium. Figure 4c shows the time-dependent change in
the emission ratio following the addition of carbon com-
pounds. The addition of glucose induced an increase in CFP
intensity and a decrease in YFP intensity, which rapidly de-
creased the YFP/CFP emission ratio (i.e., an increase in the
2OG level was indicated). As expected, glucose was immedi-
ately internalized and metabolized through glycolysis, which
then activated the Krebs cycle. These results suggest that the
2OG pool was subjected to quick accumulation in response to
glucose availability. Interestingly, the intracellular 2OG level
reached an apparent peak at 30 min after the addition of
glucose and then slowly decreased. The slow decrease in the
2OG level was likely the result of exhaustion of glucose and a
cellular response to increased cellular 2OG. In contrast to the
Table 1 Characterization of the biosensors OGsor-G and OGsor-GA
Sensor Kd (μM) Rapo Rsat Ratio change (% Rapo)
OGsor-G 687.4 1.38 1.22 −0.16 (12 %)
OGsor-GA 635.8 2.32 1.90 −0.42 (18 %)
Fig. 2 a Binding curve of 2OG
with the FRET nanosensors
OGsor-G and OGsor-GA. The
emission ratio of 528/478 nm was
determined at different 2OG
concentrations. Data were fitted
to a single site-binding curve
(black line) as described in the
“Materials and methods” section.
The substrate specificity of the
two FRETsensors was compared.
The ratio change for OGsor-G (b)
and OGsor-GA (c) was tested in
the presence of various elements
at physiological concentration
levels in E. coli, i.e., 2OG
(1 mM), citrate (1 mM), isocitrate
(1 mM), glutamate (100 mM),
and glutamine (10 mM). Data
were analyzed in triplicate, and
error bars indicate standard
deviations
Appl Microbiol Biotechnol (2013) 97:8307–8316 8311
6. results for glucose, the addition of citrate had almost no effect
on the intracellular 2OG level. Considering the complicated
environment in the in vivo context, we also used E. coli cells
expressing tandem fused YFP and CFP proteins as a negative
control that showed no obvious ratio change upon the addition
of carbon sources to exclude the possibility of a direct effect of
the chromophores.
To determine whether environmental changes in 2OG
concentrations affect the cellular steady-state levels of
2OG, we also monitored changes in 2OG levels in living
E. coli cells after the addition of 2OG. The time-
dependent decrease in the emission ratio following the
addition of 10 mM 2OG is shown in Fig. 4c. Exogenous
2OG addition induced a decrease in the YFP/CFP emis-
sion ratio (i.e., an increase in the intracellular 2OG
level), which indicates the transport of 2OG across the
membrane. Addition of 2OG up to concentrations of
100 μM induced an increase in intracellular 2OG levels
(Fig. 4f), which decreased the emission ratio. As shown
in Fig. 4c, the intracellular 2OG levels in E. coli cells
have a lag of approximately 5 min after the addition of
10 mM exogenous 2OG, which reflects the time required
to activate and initiate the transport of extracellular 2OG.
In contrast, glucose had an immediate marked effect on
intracellular 2OG levels.
Changes in the intracellular 2OG level in response to the
addition of glucose and 2OG were confirmed by measurement
of 2OG pool concentrations with the HPLC method (Fig. 4d).
The 2OG pool concentration decreased by 3-fold from 1.09 to
0.35 mM in E. coli cells moved from LB medium to M9
medium, and then increased by more than 6-fold from 0.35
to 2.63 mM or 2.14 mM at 30 min after addition of 10 mM
glucose or 2OG to the M9 medium. These results are consis-
tent with the FRET ratio data in Fig. 4b and c.
Fig. 3 a Schematic representation of the GAF constructs used for FRET
experiments. Every 20-amino-acid sequence was regarded as a linker unit
attached to the GAF domain. b Signal change in 2OG sensors. Δratio/
Rapo for the eight FLIP sensors (relative to the original OGsor-G [blue]);
OGsor-G-5 is not shown. Negative values indicate a decrease in the
fluorescence intensity ratio (528 nm/478 nm) upon ligand addition;
positive values indicate an increase in the ratio. c Ratio change for the
eight FLIP sensors (relative to the original OGsor-G [blue]). d Normal-
ized 2OG titration curves for OGsor-G-9 (green), OGsor-G-3 (brown),
and OGsor-G-5 (cyan) in contrast with the original OGsor-G (blue) and
OGsor-GA (purple). Data were analyzed in triplicate, and error bars
indicate standard deviations
Table 2 Characterization of optimized biosensors
Sensor AA Rapo Rsat Kd Δratio Δratio/Rapo (%)
OGsor-G 0 1.38 1.22 687.4 −0.16 12
OGsor-G1 20 1.17 0.90 631.4 −0.27 23
OGsor-G2 40 1.24 0.88 579.1 −0.36 29
OGsor-G3 60 1.54 1.69 1923 0.15 10
OGsor-G4 80 1.04 0.77 564.9 −0.27 26
OGsor-G5 100 1.08 1.08 ND 0 0
OGsor-G6 120 1.04 0.75 473.2 −0.29 28
OGsor-G7 140 1.41 0.89 456.7 −0.52 37
OGsor-G8 160 1.48 0.86 381.0 −0.62 42
OGsor-G9 180 2.21 1.26 693.7 −0.95 43
8312 Appl Microbiol Biotechnol (2013) 97:8307–8316
7. To titrate the response to extracellular glucose and 2OG,
cells expressing OGsor-G9 were further challenged with vary-
ing concentrations of glucose and 2OG (0.1, 1, 5, and
10 mM). Figure 4e and f shows the changes in the YFP/CFP
emission ratio over time with increasing glucose and 2OG
concentrations. The ratio was concentration dependent, which
indicates that intracellular 2OG levels were correlated with
glucose availability and extracellular 2OG concentration.
The ratio measurements were also obtained for single E.
coli cells by using confocal microscopy. Glucose and 2OG
were added to cells expressing OGsor-G9, and images were
taken every 30 s for 9 min (Fig. 4g and h). The ratio images
showed a time-dependent decrease in the fluorescence emis-
sion ratio in the cells, which was consistent with the results
obtained using a microplate reader and demonstrates the fea-
sibility of 2OG detection in E. coli at the level of a single
living cell.
Discussion
Visualizing and monitoring cell activity in vivo with high
spatial and temporal resolution is attractive because traditional
analysis methods destroy living cells to extract metabolites of
Fig. 4 a Comparison of BL21 (DE3)pLysS before (LB medium) and
after starvation (M9 medium). b Comparison of glucose and 2OG addi-
tion at different concentrations of OGsor-G-9 in vitro as described previ-
ously. c Real-time monitoring of the nanosensor responding to different
carbon sources (10 mM) in vivo. d 2OG pool measurements by HPLC
under different conditions of 2OG metabolism. Real-time monitoring of
the nanosensor responding to glucose (e) and 2OG (f) in vivo. The carbon
source was added to the well in increasing concentrations. Data were
analyzed in triplicate, and error bars indicate the standard deviation.
Confocal fluorescence image obtained after addition of 2OG (g) and
glucose (h), with the pseudocolor indicating a change in the YFP/CFP
ratio after carbon source addition. Scale bar, 1 μm
Appl Microbiol Biotechnol (2013) 97:8307–8316 8313
8. interest. Since the discovery of GFP, scientists have used site-
directed and random mutagenesis approaches to develop fluo-
rescent protein mutants and have created a family of proteins
that nearly span the complete fluorescence spectrum. These
fluorescent proteins have been used to construct genetically
encoded fluorescent biosensors for optical imaging of bio-
chemical and physiological functions in living cells
(Miranda et al. 2012; Salonikidis et al. 2011), and these
indicators allow noninvasive spatiotemporal tracing of intra-
cellular metabolism.
In the past decade, many fluorescent biosensors have been
developed for monitoring key in vivo metabolites involved in
carbon, nitrogen, and energy metabolism, including glucose,
glutamine, glutamate, ATP, ADP, cAMP, and NADH (Depry
et al. 2013). Recently, Ewald et al. described FRET-based
sensors to detect citrate, which is an important intermediate
in catabolic pathways involving glycolysis and the citric acid
cycle (Ewald et al. 2011). Additionally, 2OG is also derived
from the Krebs cycle, which is a highly conserved central
metabolic pathway, and is at the interface between carbon and
nitrogen metabolism. The central carbon intermediate 2OG
serves as the sole carbon skeleton for the assimilation of
nitrogen and participates in the generation of glutamate
through the GS/GOGAT system. On the other hand, the con-
served and ancient set of nitrogen sensor PII protein seems to
respond to 2OG (as an allosteric effector), which is an indica-
tor of the cellular nitrogen state. Thus, quantitatively tracing
2OG would be useful for studies on cell metabolism and
signal transduction.
In the present study, to monitor intracellular 2OG levels,
the 2OG-binding domain GAF of NifA protein was used to
construct a genetically encoded FRET biosensor by attaching
FP variants to each terminus of the GAF domain. Engineered
sensors always require optimization to achieve better perfor-
mance (Deuschle et al. 2005), such as site-directed mutagen-
esis of the binding pocket to generate mutants with binding
affinities that overlap with physiological concentrations
(Okumoto et al. 2005). Hires et al. (2008) performed system-
atic optimization of linkers to improve the sensitivity of the
sensor by 6.2-fold. Our FRET-based sensors were optimized
by insertion of peptide linkers with different lengths. The
resulting sensor OGsor-G9 exhibited a maximal average ratio
change ΔR of 0.95, which represented a 6-fold improvement
over the ratio change of 0.16 observed for OGsor-G, and
showed high selectivity for 2OG over other related com-
pounds. The dynamic response range of OGsor-G9 is
100 μM to 10 mM and thus spans 2 orders of magnitude,
which is consistent with the results for previously reported
sensors (Fehr et al. 2002, 2003). Thus, this sensor covers a
wide range of physiologically relevant 2OG concentrations.
We have demonstrated the value of this sensor by monitor-
ing intracellular 2OG levels in living E. coli cells under
various growth conditions. We found that 2OG accumulation
caused by glucose addition was faster than that by direct 2OG
addition. The reversible binding and dissociation between
OGsor and 2OG was monitored in E. coli cells through
addition and depletion of carbon sources in vivo, and we also
obtained a sequential concentration-dependent signal with
different concentrations of carbon sources. We have demon-
strated that the rate of 2OG uptake mediated by the 2OG
transporter KdgT (Partridge et al. 2006) and 2OG permease
KgtP (Seol and Shatkin, 1991) is very high and that addition
of 2OG itself has a significant effect on the intracellular 2OG
level and metabolism (Fig. 4f). FRET ratio changes in single
living E. coli cells responding to extracellular carbon were
visualized using confocal microscopy. Our results illustrate
that the OGsor is a powerful tool for evaluating the signal
transduction and cross-talk mechanisms of central carbon
metabolism and nitrogen metabolism in relation with the
nutritional states of the cell.
As mentioned previously, 2OG stands at the crossroads
between carbon and nitrogen metabolism, as important ele-
ments such as glutamate (Dulla et al. 2008; Hires et al. 2008)
and glutamine (Gruenwald et al. 2012; Yang et al. 2010) from
nitrogen metabolism and citrate (Ewald et al. 2011) from the
Krebs cycle have already been exploited by genetically
encoded fluorescent biosensors. It is therefore important to
detect changes in 2OG levels to shed further light on carbon
and nitrogen metabolism. 2OG also regulates many metabolic
activities such as nitrogen metabolism (Teixeira et al. 2010),
lipid absorption/metabolism, muscle performance, and
cancerogenesis (Harrison and Pierzynowski 2008). Recent
studies have also noted effects of 2OG on the condition of
astroglia (Fomenko et al. 2011) and on gene expression in
plant leaves (Araujo et al. 2012). With the attachment of a
proper signal sequence, OGsor could be used to monitor 2OG
in intracellular compartments of interest such as the plant
cytosol (Bogner and Ludewig 2007), mitochondria, or nuclei
and thus facilitate biological research.
Acknowledgments This study was supported by the China NSF
(21276079), SRFDP (no. 20120074110009), the Key Grant Project (no.
313019) of the Chinese Ministry of Education, and the Fundamental
Research Funds for the Central Universities.
References
Ansbacher T, Srivastava HK, Stein T, Baer R, Merkx M, Shurki A (2012)
Calculation of transition dipole moment in fluorescent
proteins—towards efficient energy transfer. Phys Chem Chem
Phys 14(12):4109–4117. doi:10.1039/c2cp23351g
Araujo WL, Tohge T, Nunes-Nesi A, Daloso DM, Nimick M, Krahnert I,
Bunik VI, Moorhead GB, Fernie AR (2012) Phosphonate analogs of
2-oxoglutarate perturb metabolism and gene expression in illumi-
nated Arabidopsis leaves. Front Plant Sci 3:114. doi:10.3389/fpls.
2012.00114
8314 Appl Microbiol Biotechnol (2013) 97:8307–8316
9. Aravind L, Ponting CP (1997) The GAF domain: an evolutionary link
between diverse phototransducing proteins. Trends Biochem Sci
22(12):458–459. doi:10.1016/S0968-0004(97)01148-1
Bennett BD, Kimball EH, Gao M, Osterhout R, Van Dien SJ, Rabinowitz
JD (2009) Absolute metabolite concentrations and implied enzyme
active site occupancy in Escherichia coli. Nat Chem Biol 5(8):593–
599. doi:10.1038/nchembio.186
Bogner M, Ludewig U (2007) Visualization of arginine influx into plant
cells using a specific FRET-sensor. J Fluoresc 17(4):350–360.
doi:10.1007/s10895-007-0192-2
Buck M, Gallegos MT, Studholme DJ, Guo Y, Gralla JD (2000) The
bacterial enhancer-dependent sigma(54) (sigma(N)) transcription
factor. J Bacteriol 182(15):4129–4136. doi:10.1128/JB.182.15.
4129-4136.2000
Chen D, Duggan C, Ganley JP, Kooragayala LM, Reden TB, Texada DE,
Langford MP (2004) Expression of enterovirus 70 capsid protein
VP1 in Escherichia coli. Protein Expr Purif 37(2):426–433. doi:10.
1016/j.pep.2004.06.027
Cicchetti G, Biernacki M, Farquharson J, Allen PG (2004) A ratiometric
expressible FRET sensor for phosphoinositides displays a signal
change in highly dynamic membrane structures in fibroblasts.
Biochemistry 43(7):1939–1949. doi:10.1021/bi035480w
Depry C, Mehta S, Zhang J (2013) Multiplexed visualization of dynamic
signaling networks using genetically encoded fluorescent protein-
based biosensors. Pflugers Arch 465(3):373–381. doi:10.1007/
s00424-012-1175-y
Deuschle K, Okumoto S, Fehr M, Looger LL, Kozhukh L, Frommer WB
(2005) Construction and optimization of a family of genetically
encoded metabolite sensors by semirational protein engineering.
Protein Sci 14(9):2304–2314. doi:10.1110/ps.051508105
DiPilato LM, Cheng X, Zhang J (2004) Fluorescent indicators of cAMP
and Epac activation reveal differential dynamics of cAMP signaling
within discrete subcellular compartments. Proc Natl Acad Sci U S A
101(47):16513–16518. doi:10.1073/pnas.0405973101
Dulla C, Tani H, Okumoto S, Frommer WB, Reimer RJ, Huguenard JR
(2008) Imaging of glutamate in brain slices using FRET sensors. J
Neurosci Methods 168(2):306–319. doi:10.1016/j.jneumeth.2007.
10.017
Ewald JC, Reich S, Baumann S, Frommer WB, Zamboni N (2011)
Engineering genetically encoded nanosensors for real-time in vivo
measurements of citrate concentrations. PLoS One 6(12):e28245.
doi:10.1371/journal.pone.0028245
Fehr M, Frommer WB, Lalonde S (2002) Visualization of maltose uptake
in living yeast cells by fluorescent nanosensors. Proc Natl Acad Sci
U S A 99(15):9846–9851. doi:10.1073/pnas.142089199
Fehr M, Lalonde S, Lager I, Wolff MW, Frommer WB (2003) In vivo
imaging of the dynamics of glucose uptake in the cytosol of COS-7
cells by fluorescent nanosensors. J Biol Chem 278(21):19127–
19133. doi:10.1074/jbc.M301333200
Fehr M, Okumoto S, Deuschle K, Lager I, Looger LL, Persson J,
Kozhukh L, Lalonde S, Frommer WB (2005) Development
and use of fluorescent nanosensors for metabolite imaging in
living cells. Biochem Soc Trans 33(Pt 1):287–290. doi:10.
1042/BST0330287
Fomenko OZ, Ushakova HO, Piierzhynovs'kyi SH (2011) Astroglia
proteins in the rat brain in experimental chronic hepatitis and 2-
oxoglutarate effect. Ukr Biokhim Zh 83(1):69–76
Gruenwald K, Holland JT, Stromberg V, Ahmad A, Watcharakichkorn D,
Okumoto S (2012) Visualization of glutamine transporter activities
in living cells using genetically encoded glutamine sensors. PLoS
One 7(6):e38591. doi:10.1371/journal.pone.0038591
Ha JS, Song JJ, Lee YM, Kim SJ, Sohn JH, Shin CS, Lee SG (2007)
Design and application of highly responsive fluorescence resonance
energy transfer biosensors for detection of sugar in living
Saccharomyces cerevisiae cells. Appl Environ Microbiol
73(22):7408–7414. doi:10.1128/AEM.01080-07
Harrison AP, Pierzynowski SG (2008) Biological effects of 2-
oxoglutarate with particular emphasis on the regulation of protein,
mineral and lipid absorption/metabolism, muscle performance, kid-
ney function, bone formation and cancerogenesis, all viewed from a
healthy ageing perspective state of the art—review article. J Physiol
Pharmacol 59(Suppl 1):91–106
Hires SA, Zhu Y, Tsien RY (2008) Optical measurement of synaptic
glutamate spillover and reuptake by linker optimized glutamate-
sensitive fluorescent reporters. Proc Natl Acad Sci U S A
105(11):4411–4416. doi:10.1073/pnas.0712008105
Ho YS, Burden LM, Hurley JH (2000) Structure of the GAF domain, a
ubiquitous signaling motif and a new class of cyclic GMP receptor.
EMBO J 19(20):5288–5299. doi:10.1093/emboj/19.20.5288
Honda A, Adams SR, Sawyer CL, Lev-Ram V, Tsien RY, Dostmann WR
(2001) Spatiotemporal dynamics of guanosine 3′,5′-cyclic
monophosphate revealed by a genetically encoded, fluorescent in-
dicator. Proc Natl Acad Sci U S A 98(5):2437–2442. doi:10.1073/
pnas.051631298
Imamura H, Nhat KP, Togawa H, Saito K, Iino R, Kato-Yamada Y, Nagai
T, Noji H (2009) Visualization of ATP levels inside single living
cells with fluorescence resonance energy transfer-based genetically
encoded indicators. Proc Natl Acad Sci U S A 106(37):15651–
15656. doi:10.1073/pnas.0904764106
Iqbal A, Arslan S, Okumus B, Wilson TJ, Giraud G, Norman DG, Ha T,
Lilley DM (2008) Orientation dependence in fluorescent energy
transfer between Cy3 and Cy5 terminally attached to double-
stranded nucleic acids. Proc Natl Acad Sci U S A 105(32):11176–
11181. doi:10.1073/pnas.0801707105
Jares-Erijman EA, Jovin TM (2006) Imaging molecular interactions in
living cells by FRET microscopy. Curr Opin Chem Biol 10(5):409–
416. doi:10.1016/j.cbpa.2006.08.021
John SA, Ottolia M, Weiss JN, Ribalet B (2008) Dynamic modulation of
intracellular glucose imaged in single cells using a FRET-based
glucose nanosensor. Pflugers Arch 456(2):307–322. doi:10.1007/
s00424-007-0395-z
Kaper T, Lager I, Looger LL, Chermak D, Frommer WB (2008)
Fluorescence resonance energy transfer sensors for quantitative
monitoring of pentose and disaccharide accumulation in bacteria.
Biotechnol Biofuels 1(1):11. doi:10.1186/1754-6834-1-11
Knetsch ML, Tsiavaliaris G, Zimmermann S, Ruhl U, Manstein DJ (2002)
Expression vectors for studying cytoskeletal proteins in
Dictyostelium discoideum. J Muscle Res Cell Motil 23(7–8):605–611
Lager I, Fehr M, Frommer WB, Lalonde S (2003) Development of a
fluorescent nanosensor for ribose. FEBS Lett 553(1–2):85–89.
doi:10.1016/S0014-5793(03)00976-1
Leigh JA, Dodsworth JA (2007) Nitrogen regulation in bacteria and
archaea. Annu Rev Microbiol 61:349–377. doi:10.1146/annurev.
micro.61.080706.093409
Martinez-Argudo I, Little R, Dixon R (2004) Role of the amino-terminal
GAF domain of the NifA activator in controlling the response to the
antiactivator protein NifL. Mol Microbiol 52(6):1731–1744. doi:10.
1111/j.1365-2958.2004.04089.x
Martinez-Argudo I, Little R, Shearer N, Johnson P, Dixon R (2005)
Nitrogen fixation: key genetic regulatory mechanisms. Biochem
Soc Trans 33(Pt 1):152–156. doi:10.1042/BST0330152
Miranda JG, Weaver AL, Qin Y, Park JG, Stoddard CI, Lin MZ, Palmer
AE (2012) New alternately colored FRET sensors for simultaneous
monitoring of Zn(2)(+) in multiple cellular locations. PLoS One
7(11):e49371. doi:10.1371/journal.pone.0049371
Morett E, Segovia L (1993) The sigma 54 bacterial enhancer-binding
protein family: mechanism of action and phylogenetic relationship
of their functional domains. J Bacteriol 175(19):6067–6074
Nagai T, Yamada S, Tominaga T, Ichikawa M, Miyawaki A (2004)
Expanded dynamic range of fluorescent indicators for Ca(2+) by
circularly permuted yellow fluorescent proteins. Proc Natl Acad Sci
U S A 101(29):10554–10559. doi:10.1073/pnas.0400417101
Appl Microbiol Biotechnol (2013) 97:8307–8316 8315
10. Nikolaev VO, Gambaryan S, Lohse MJ (2006) Fluorescent sensors for
rapid monitoring of intracellular cGMP. Nat Methods 3(1):23–25.
doi:10.1038/nmeth816
Okano H, Hwa T, Lenz P, Yan D (2010) Reversible adenylylation of
glutamine synthetase is dynamically counterbalanced during steady-
state growth of Escherichia coli. J Mol Biol 404:522–536. doi:10.
1016/j.jmb.2010.09.046
Okumoto S, Looger LL, Micheva KD, Reimer RJ, Smith SJ, Frommer WB
(2005) Detection of glutamate release from neurons by genetically
encoded surface-displayed FRET nanosensors. Proc Natl Acad Sci U
S A 102(24):8740–8745. doi:10.1073/pnas.0503274102
Partridge JD, Scott C, Tang Y, Poole RK, Green J (2006) Escherichia coli
transcriptome dynamics during the transition from anaerobic to
aerobic conditions. J Biol Chem 281(38):27806–27815. doi:10.
1074/jbc.M603450200
Piston DW, Kremers GJ (2007) Fluorescent protein FRET: the good, the
bad and the ugly. Trends Biochem Sci 32(9):407–414. doi:10.1016/
j.tibs.2007.08.003
Ponsioen B, Zhao J, Riedl J, Zwartkruis F, van der Krogt G, Zaccolo M,
Moolenaar WH, Bos JL, Jalink K (2004) Detecting cAMP-induced
Epac activation by fluorescence resonance energy transfer: Epac as a
novel cAMP indicator. EMBO Rep 5(12):1176–1180. doi:10.1038/
sj.embor.7400290
Pos KM, Dimroth P, Bott M (1998) The Escherichia coli citrate carrier
CitT: a member of a novel eubacterial transporter family related to
the 2-oxoglutarate/malate translocator from spinach chloroplasts. J
Bacteriol 180(16):4160–4165
Rajamani S, Zhu J, Pei D, Sayre R (2007) A LuxP-FRET-based reporter
for the detection and quantification of AI-2 bacterial quorum-
sensing signal compounds. Biochemistry 46(13):3990–3997.
doi:10.1021/bi602479e
Salonikidis PS, Niebert M, Ullrich T, Bao G, Zeug A, Richter DW (2011)
An ion-insensitive cAMP biosensor for long term quantitative
ratiometric fluorescence resonance energy transfer (FRET) measure-
ments under variable physiological conditions. J Biol Chem
286(26):23419–23431. doi:10.1074/jbc.M111.236869
Sato M, Ueda Y, Umezawa Y (2006) Imaging diacylglycerol dynamics at
organelle membranes. Nat Methods 3(10):797–799. doi:10.1038/
nmeth930
Senior PJ (1975) Regulation of nitrogen metabolism in Escherichia coli
and Klebsiella aerogenes: studies with the continuous-culture tech-
nique. J Bacteriol 123(2):407–418
Seol W, Shatkin AJ (1991) Escherichia coli kgtP encodes an alpha-
ketoglutarate transporter. Proc Natl Acad Sci U S A 88(9):3802–
3806
Tanimura A, Morita T, Nezu A, Shitara A, Hashimoto N, Tojyo Y (2009)
Use of fluorescence resonance energy transfer-based biosensors for
the quantitative analysis of inositol 1,4,5-trisphosphate dynamics in
calcium oscillations. J Biol Chem 284(13):8910–8917. doi:10.1074/
jbc.M805865200
Teixeira PF, Selao TT, Henriksson V, Wang H, Noren A, Nordlund S
(2010) Diazotrophic growth of Rhodospirillum rubrum with 2-
oxoglutarate as sole carbon source affects regulation of nitrogen
metabolism as well as the soluble proteome. Res Microbiol
161(8):651–659. doi:10.1016/j.resmic.2010.06.003
Yang H, Bogner M, Stierhof Y-D, Ludewig U (2010) H+
-independent
glutamine transport in plant root tips. Transport 5
Yano T, Oku M, Akeyama N, Itoyama A, Yurimoto H, Kuge S, Fujiki Y,
Sakai Y (2010) A novel fluorescent sensor protein for visualization
of redox states in the cytoplasm and in peroxisomes. Mol Cell Biol
30(15):3758–3766. doi:10.1128/MCB.00121-10
Zhao MX, Jiang YL, He YX, Chen YF, Teng YB, Chen Y, Zhang CC,
Zhou CZ (2010) Structural basis for the allosteric control of the
global transcription factor NtcA by the nitrogen starvation signal 2-
oxoglutarate. Proc Natl Acad Sci U S A 107(28):12487–12492.
doi:10.1073/pnas.1001556107
8316 Appl Microbiol Biotechnol (2013) 97:8307–8316