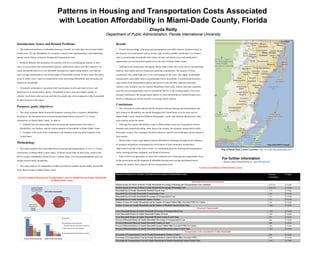
This study examines the relationship between housing and transportation costs for 65 communities in Miami-Dade County. It finds that locations with more affordable housing often have higher transportation costs, decreasing overall affordability. Housing is clustered, with affordable units located far from jobs and transit, forcing residents to spend more on transportation. While Miami-Dade has different characteristics than other areas studied, the relationships between housing, transportation, and affordability are similar. Strategies are needed that coordinate land use, housing, and transportation planning to improve location affordability.