The document describes an Energy Management Information System (EMIS) that collects, analyzes, and reports on energy consumption data from public buildings in Croatia. Some key points:
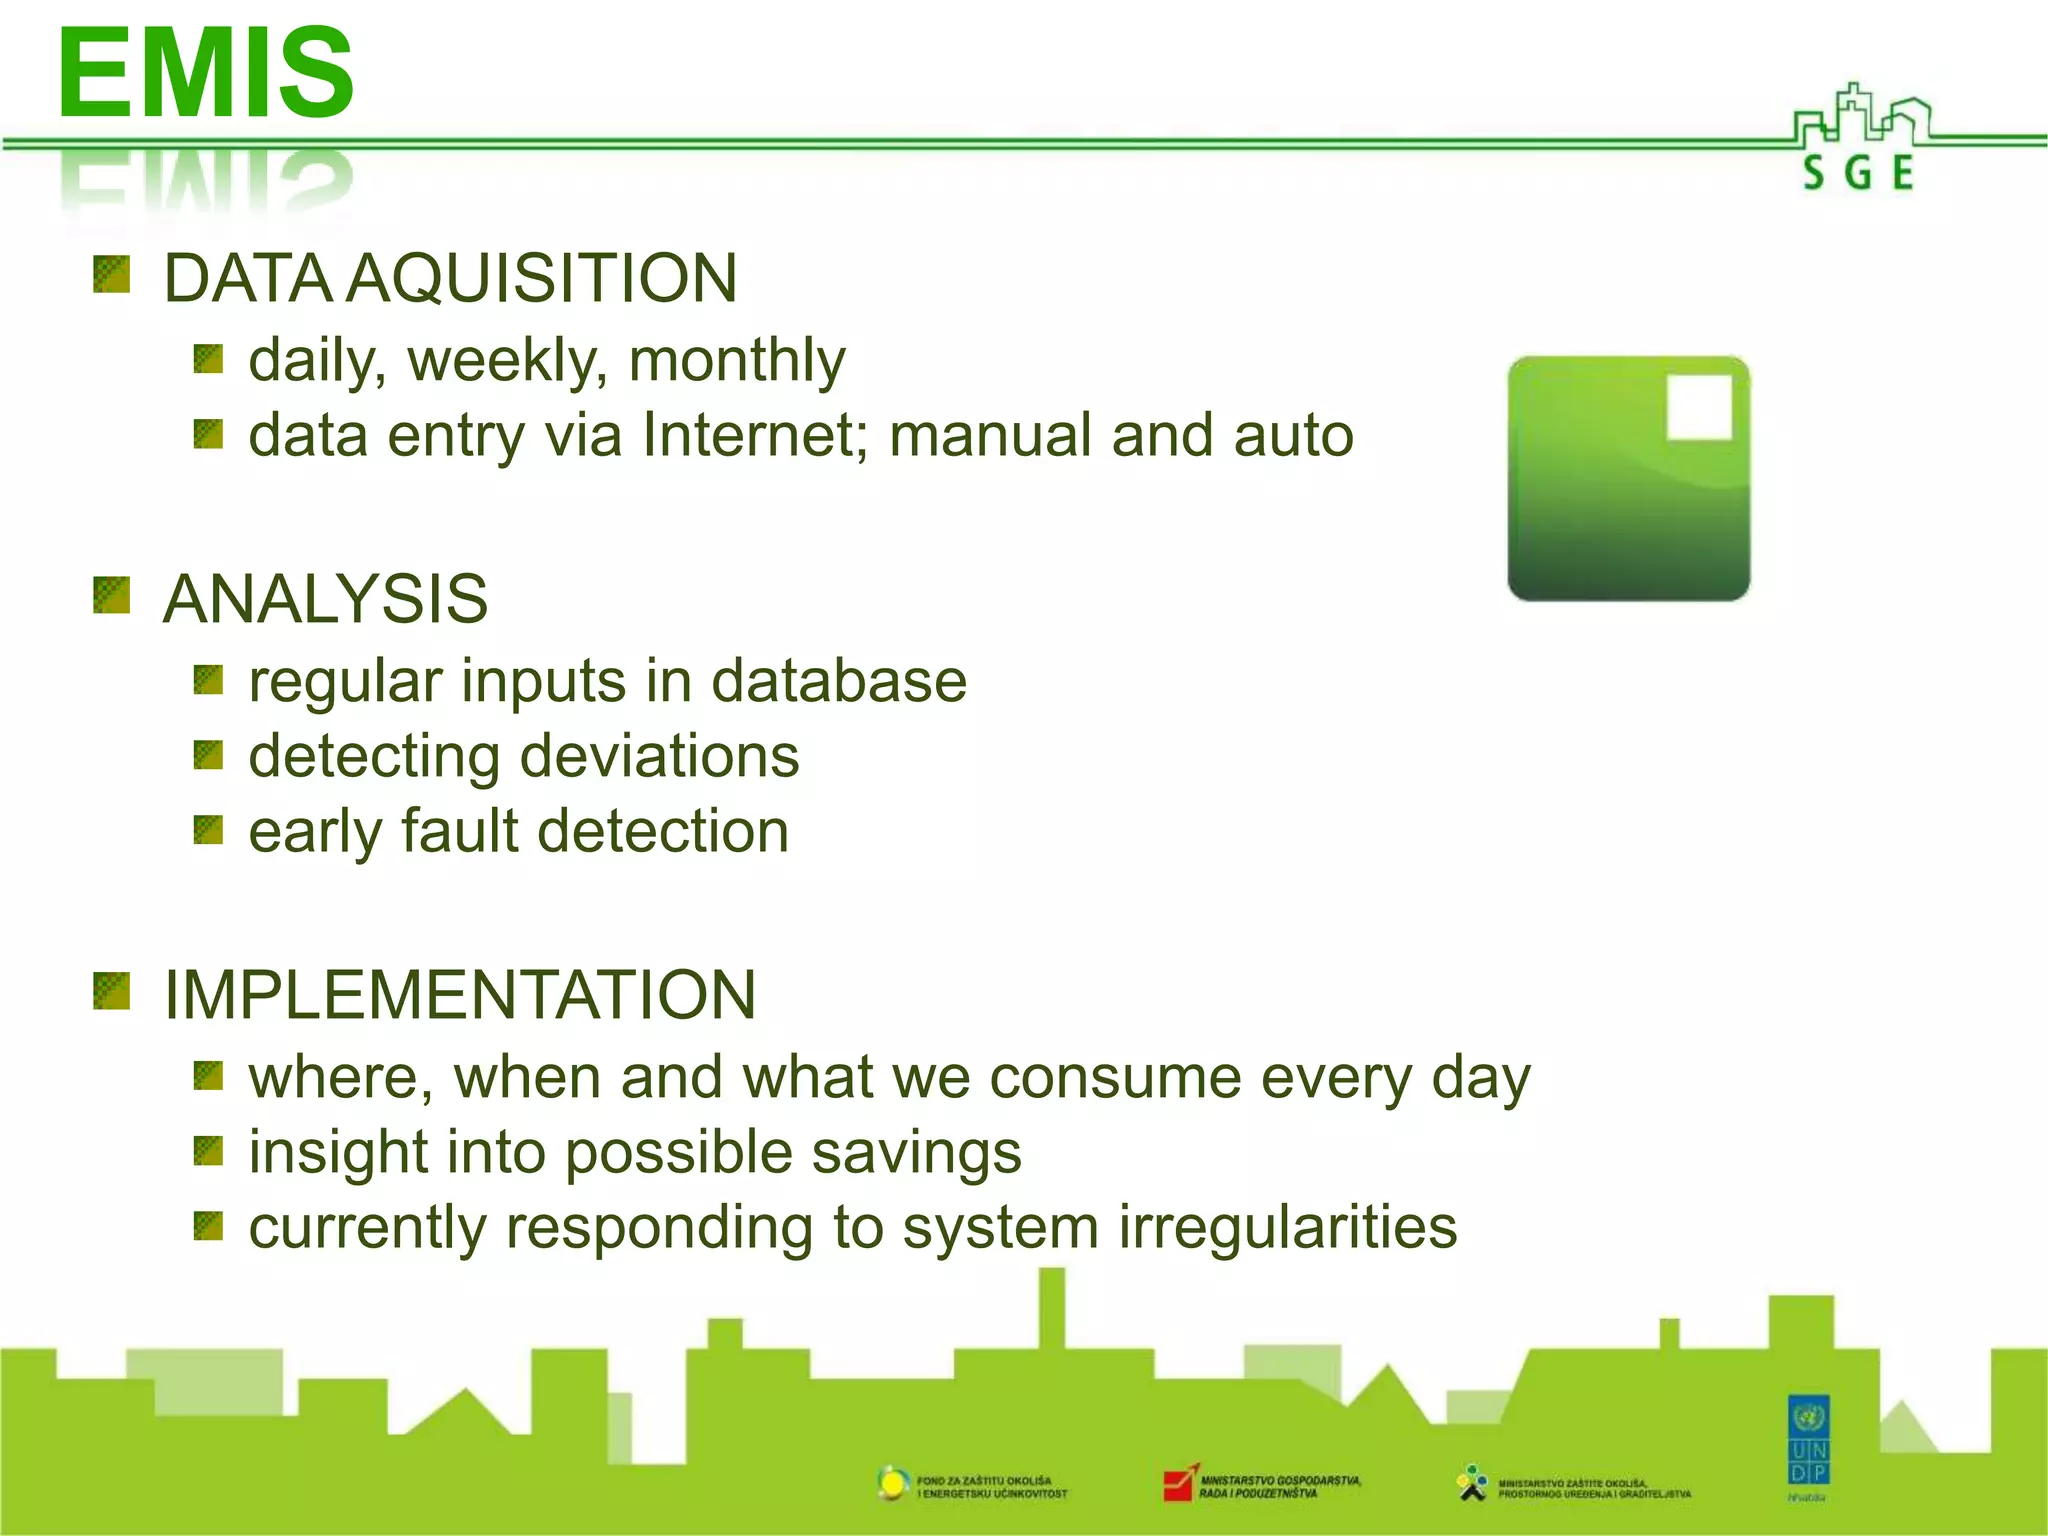
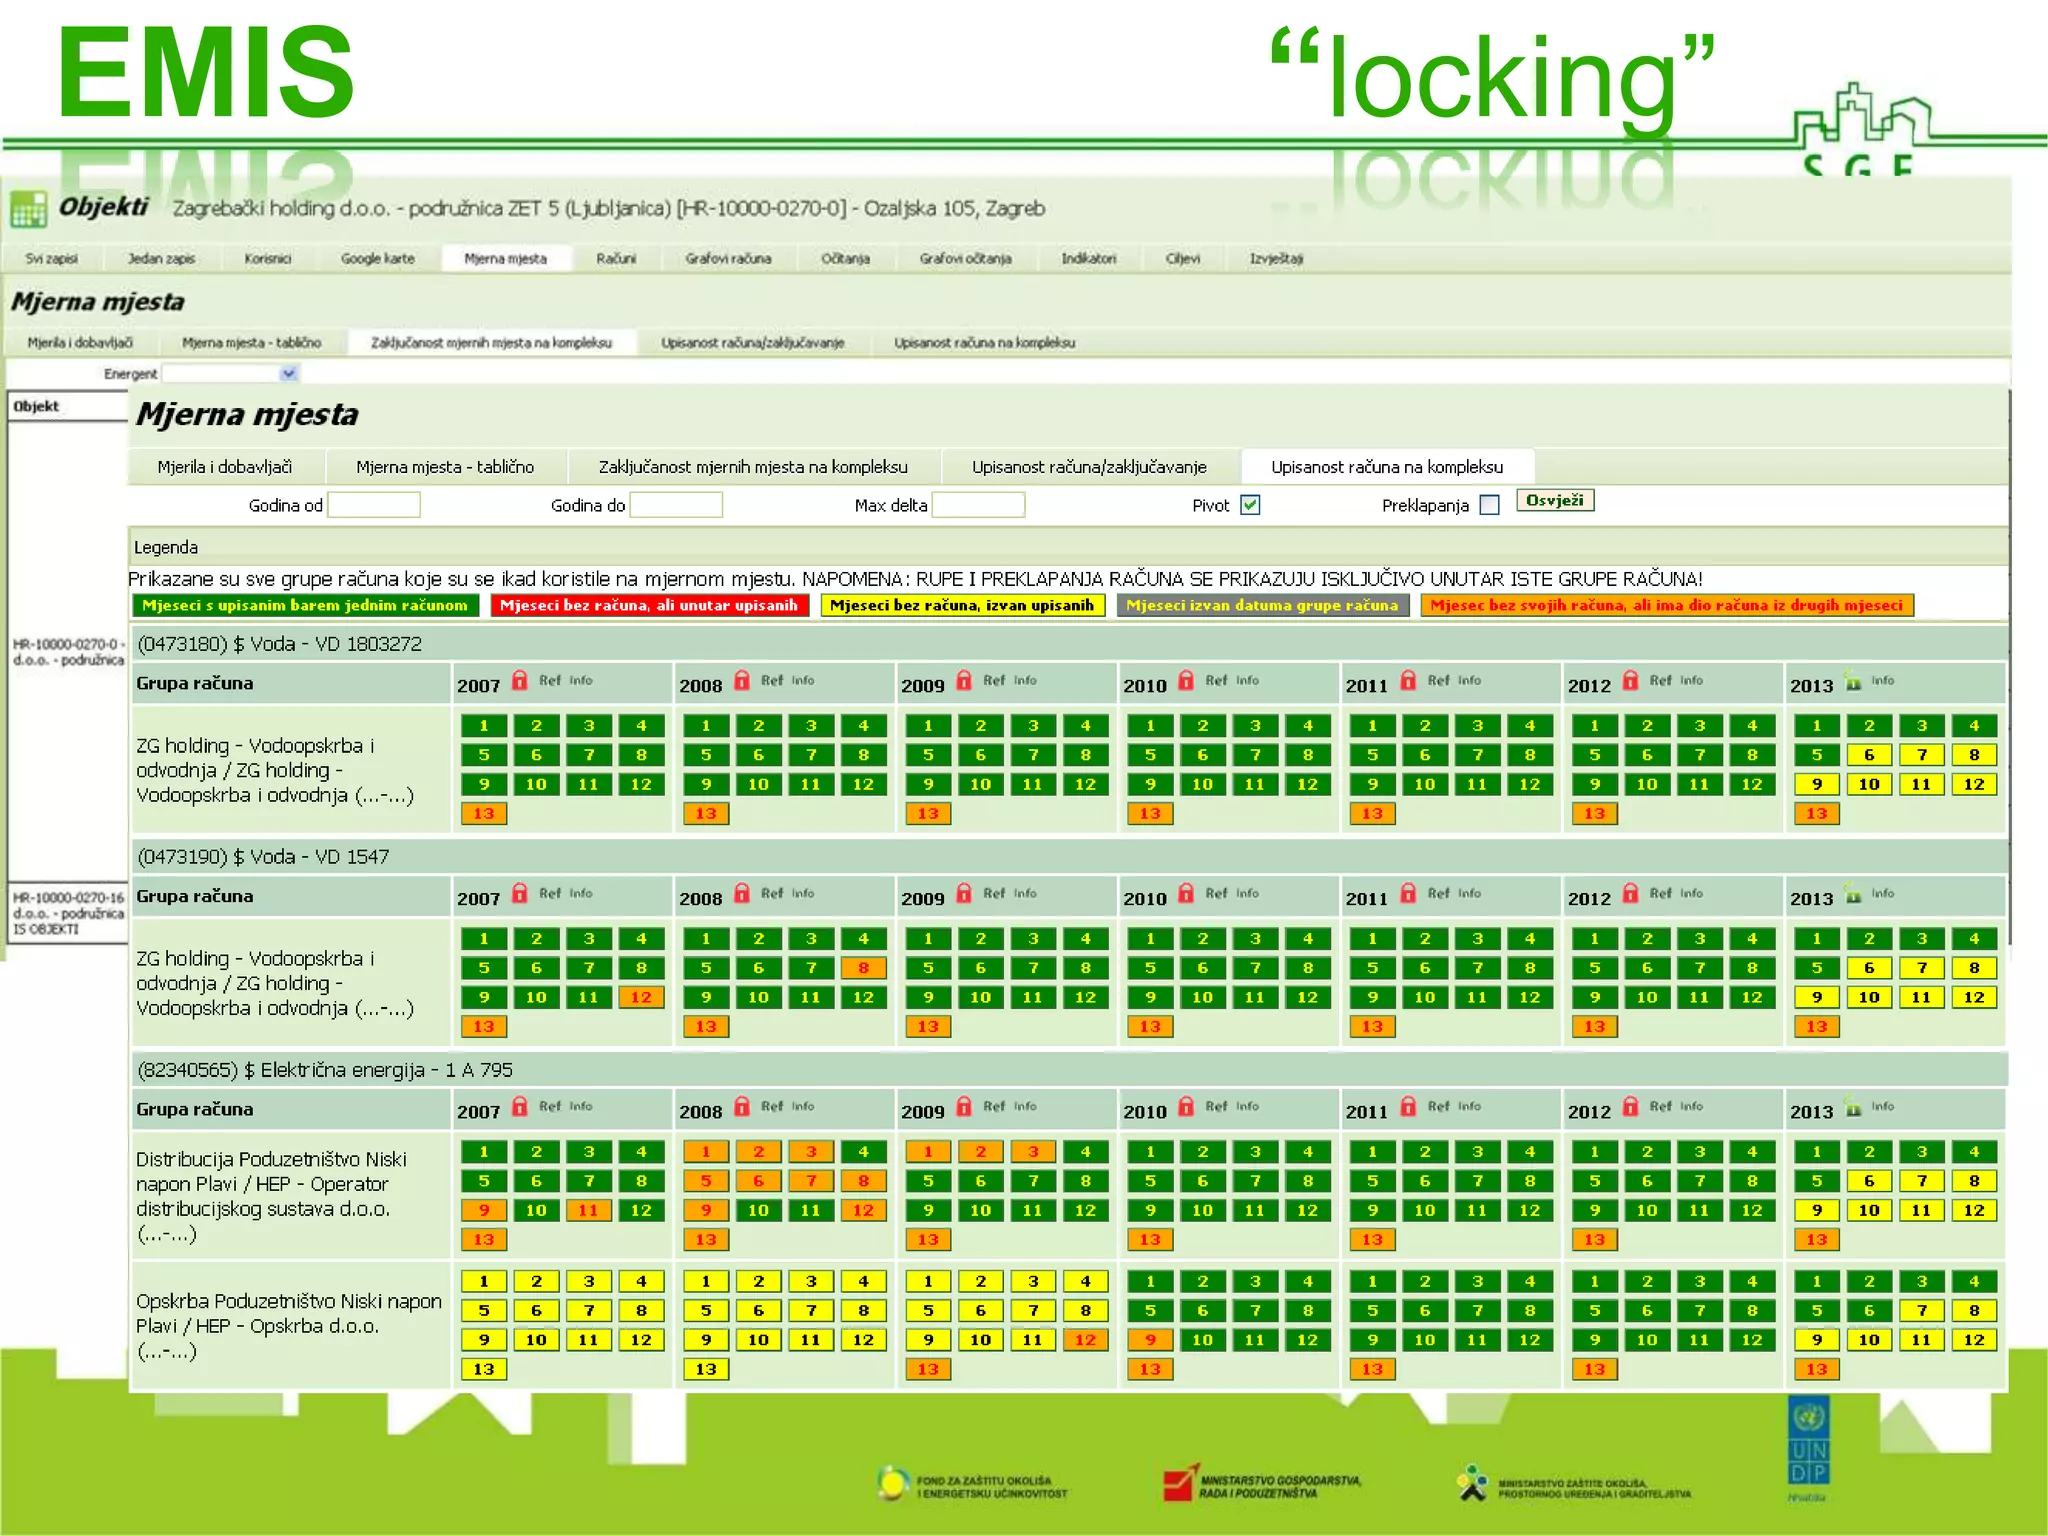
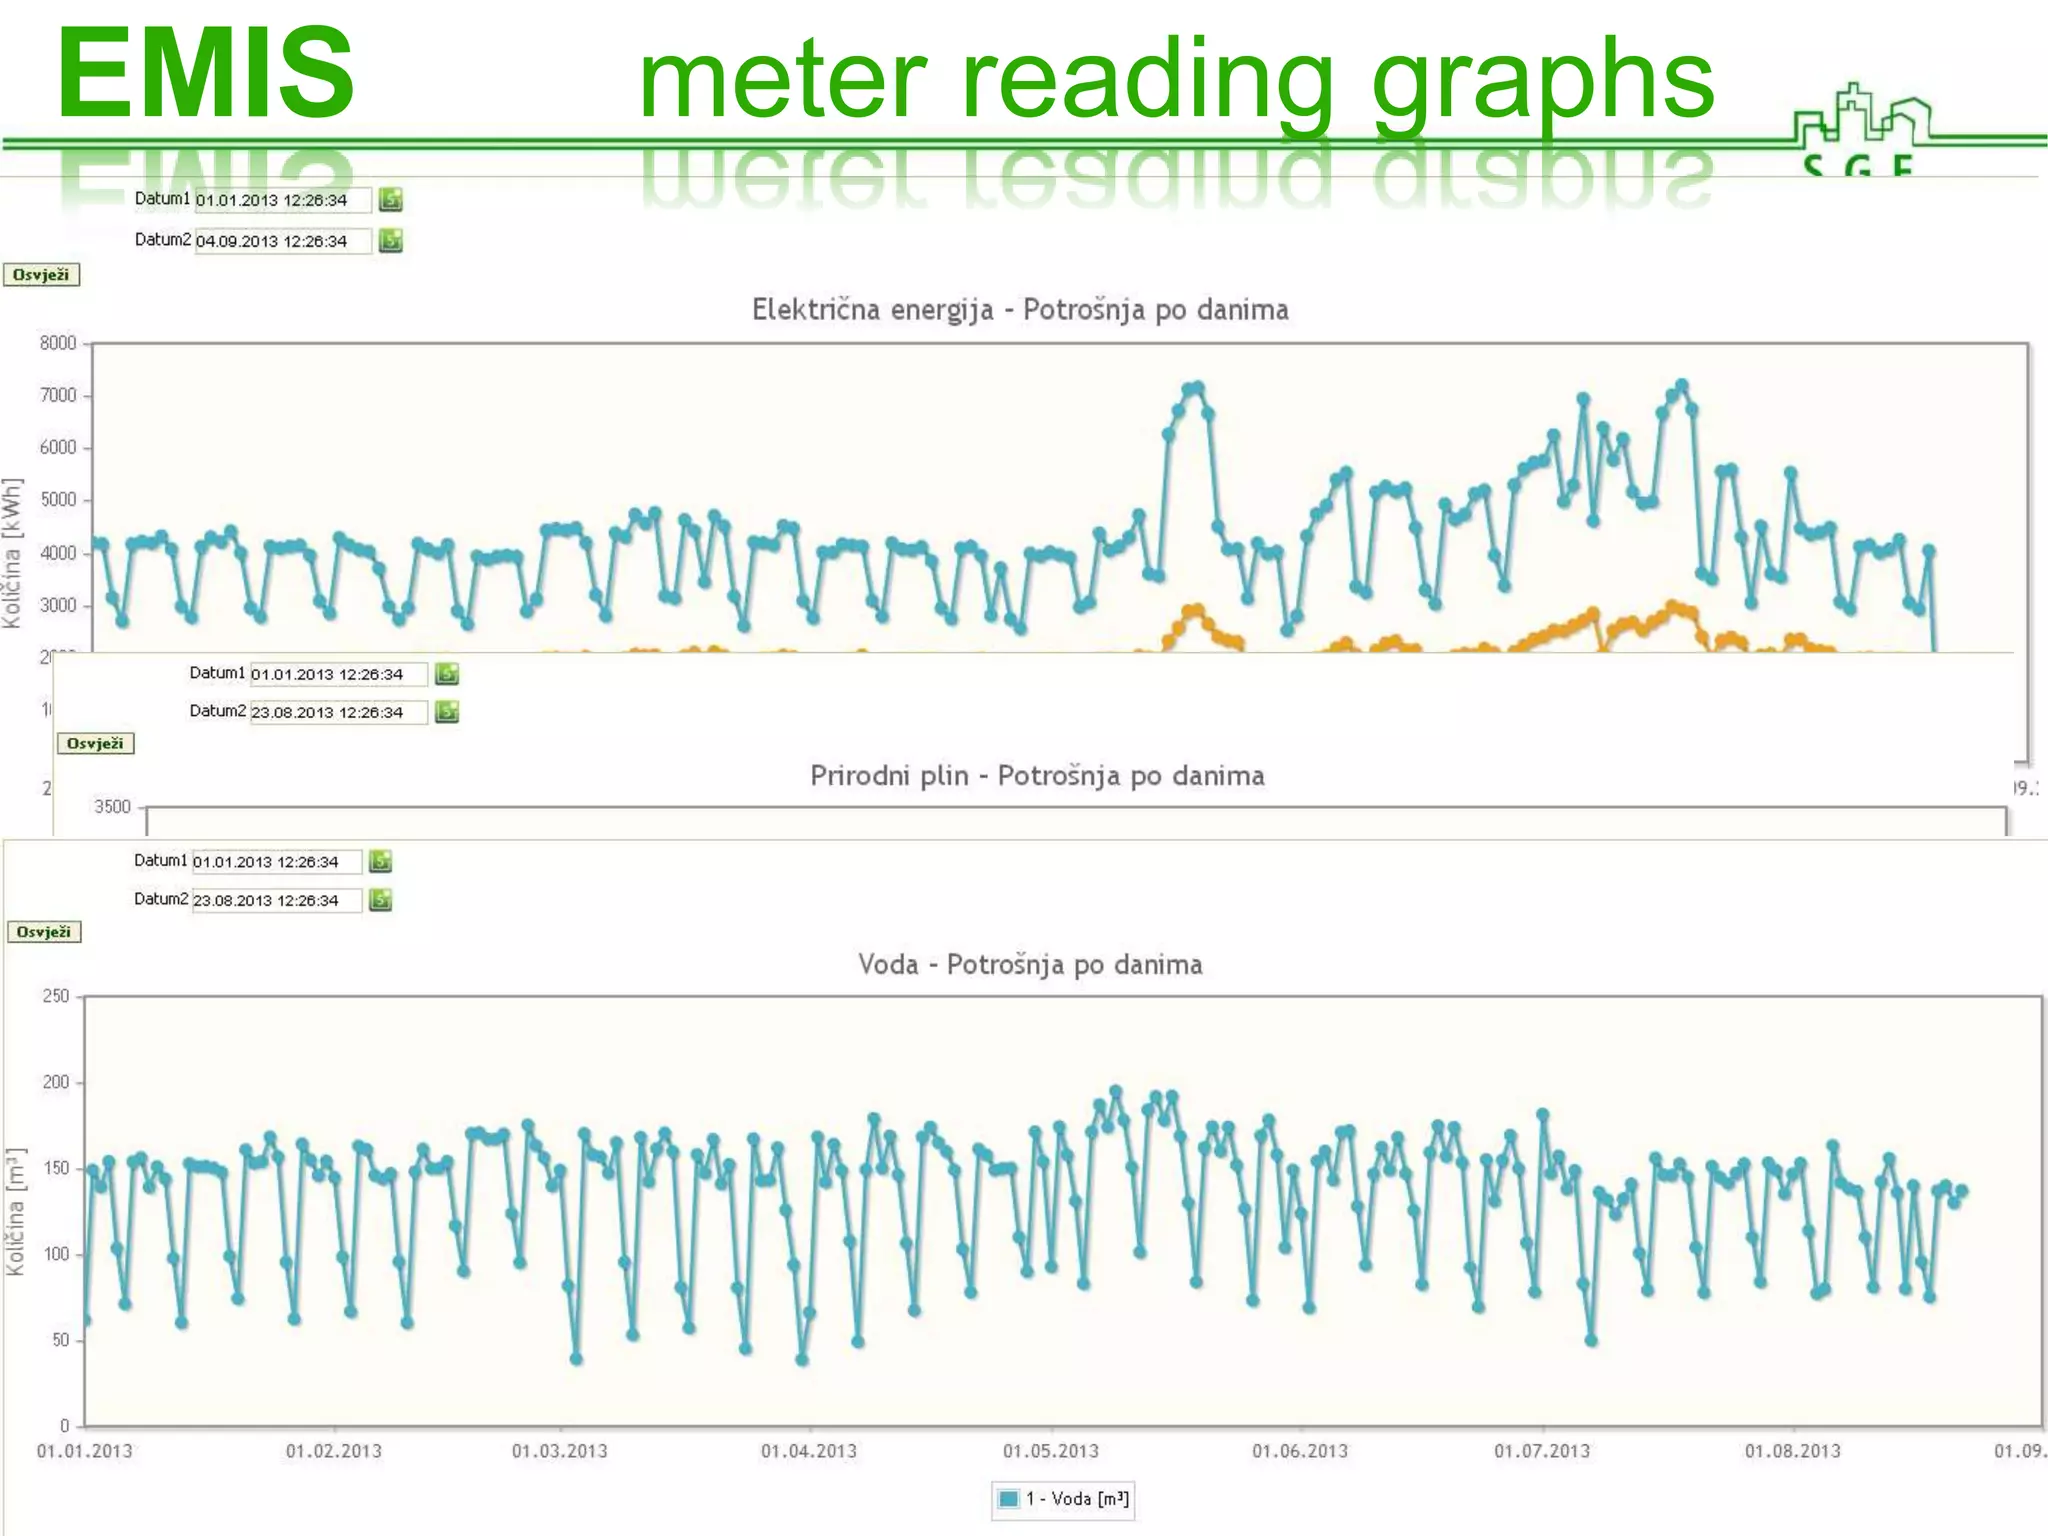
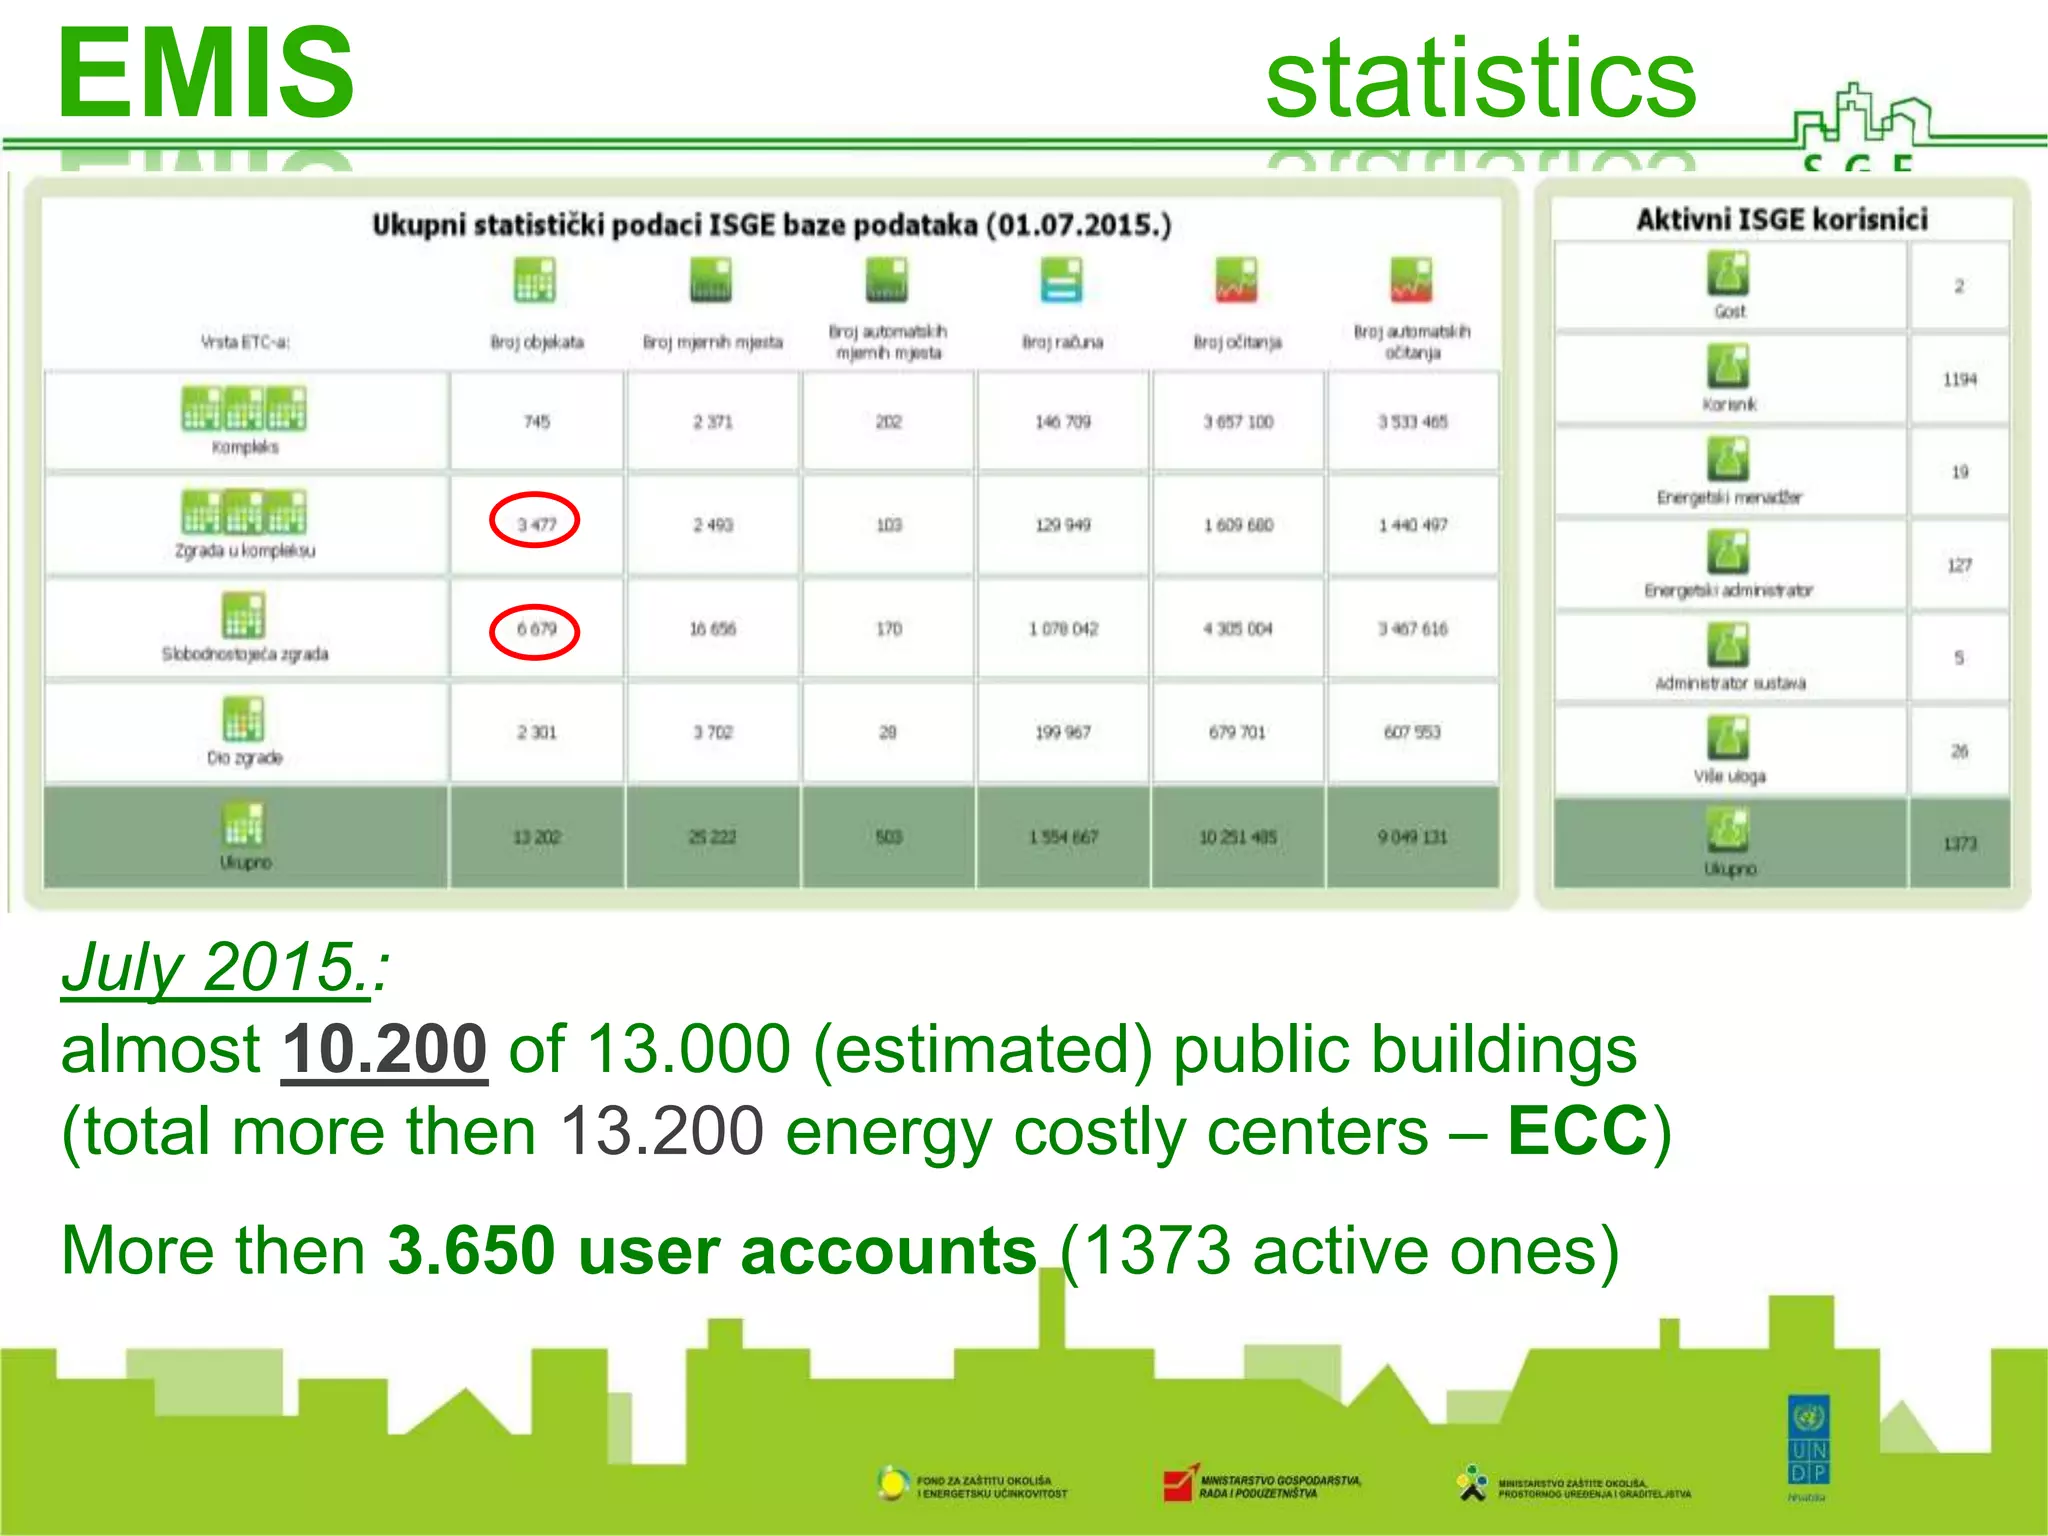
- EMIS collects daily/weekly/monthly consumption data from over 25,000 metering points across over 10,000 public buildings. It analyzes the data for deviations and faults.
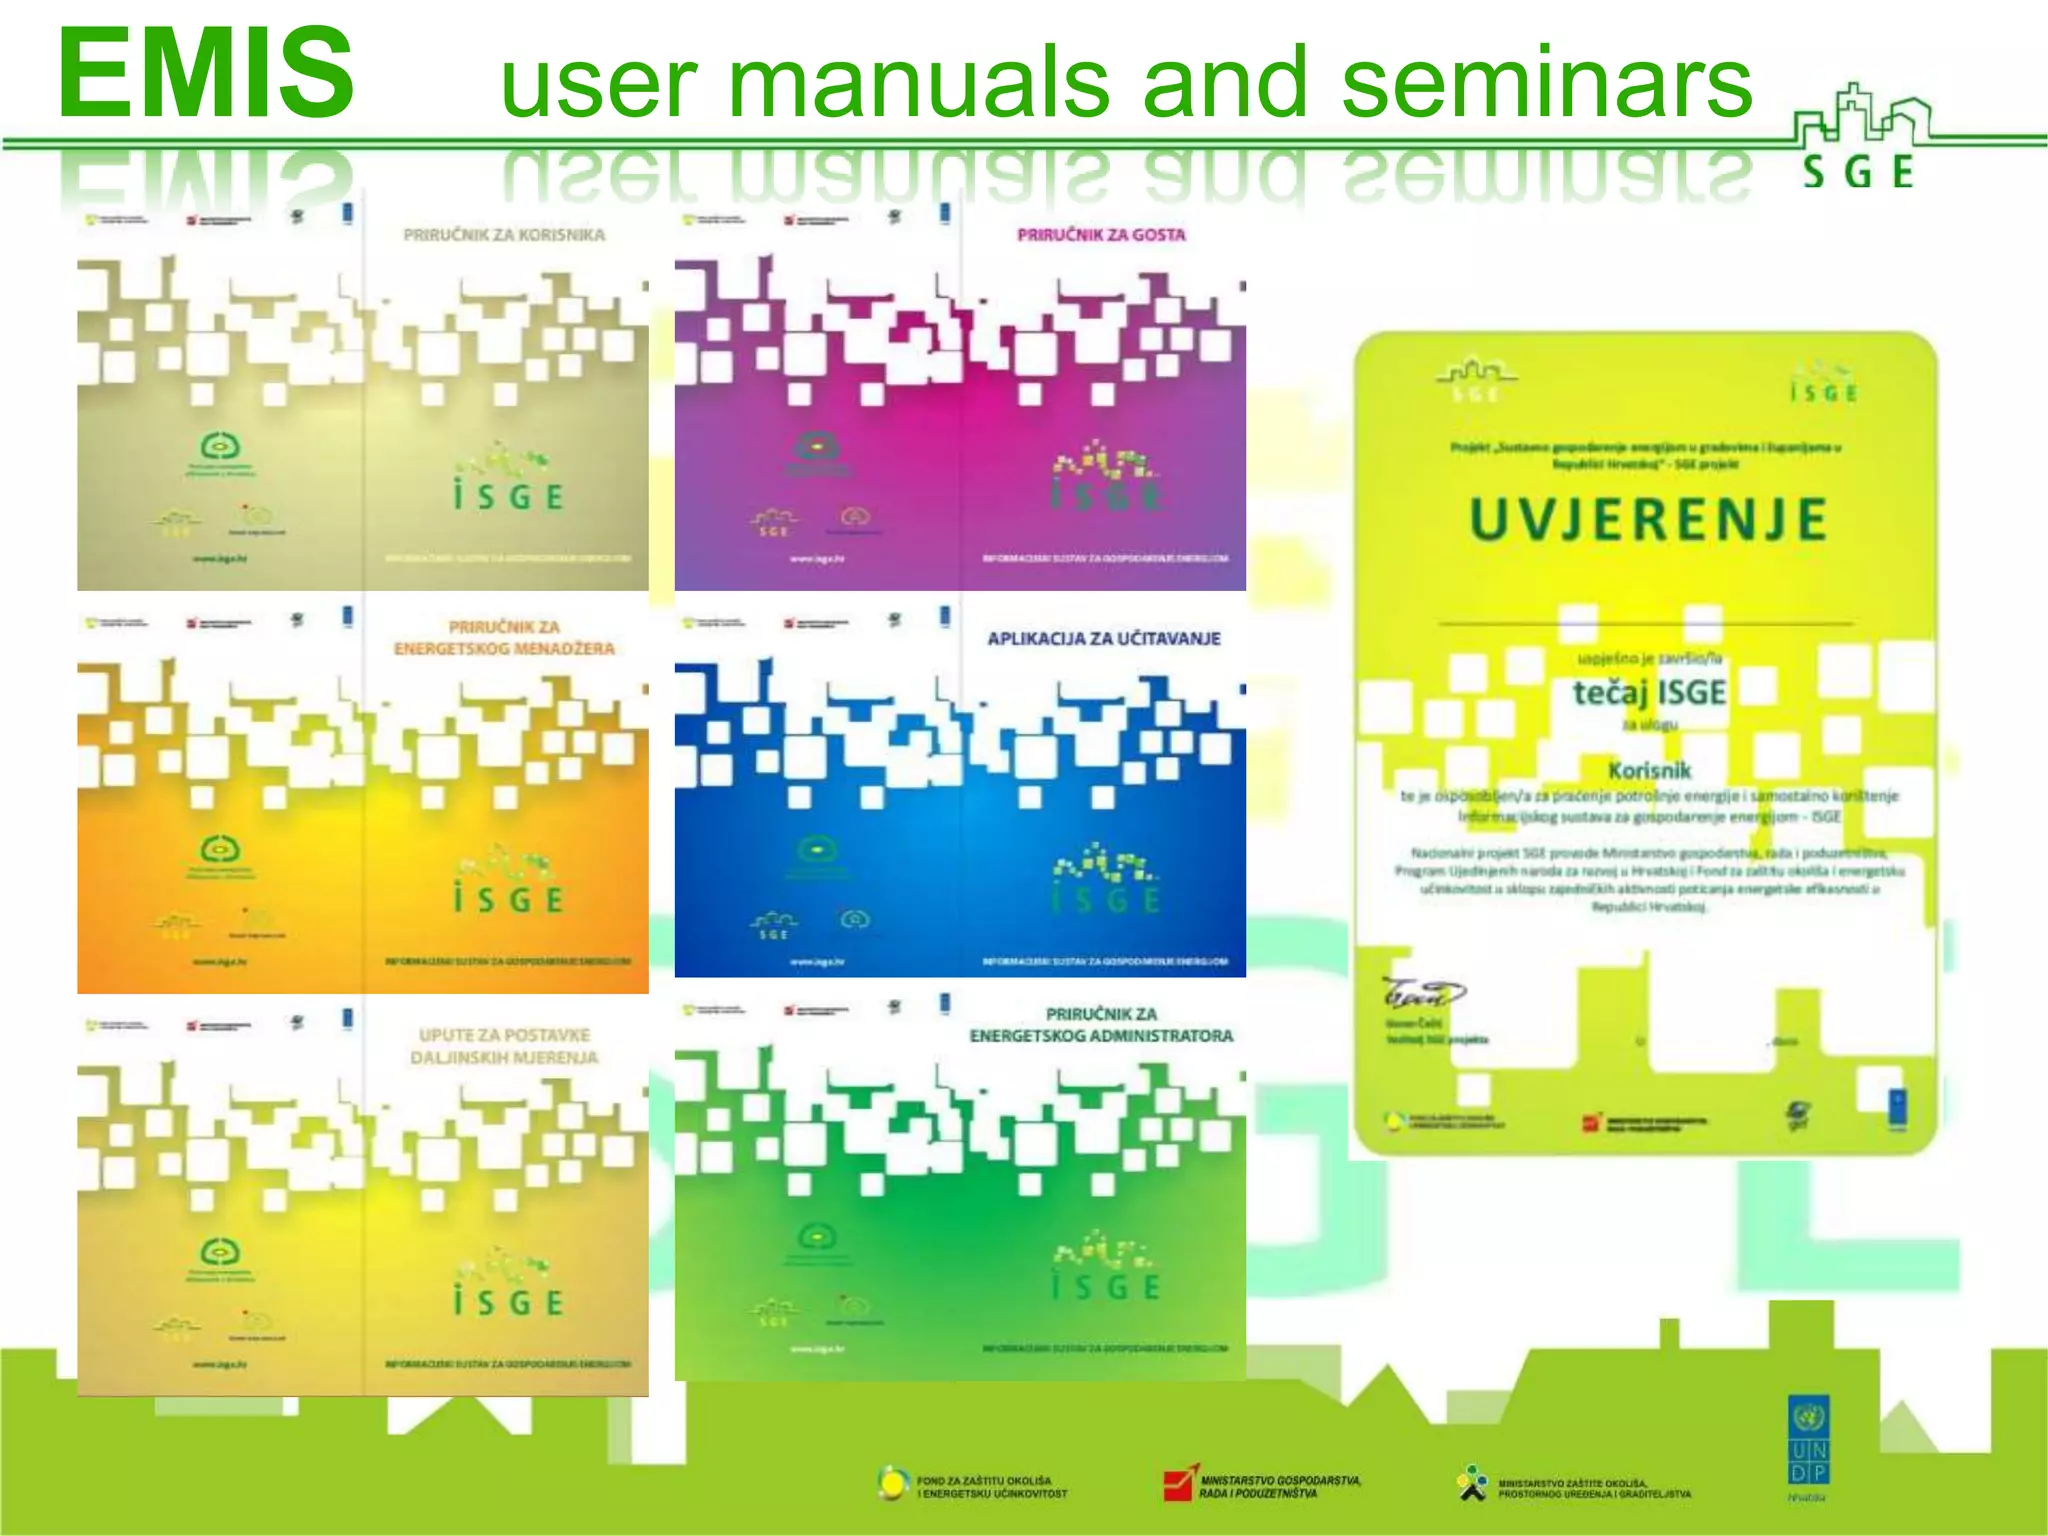
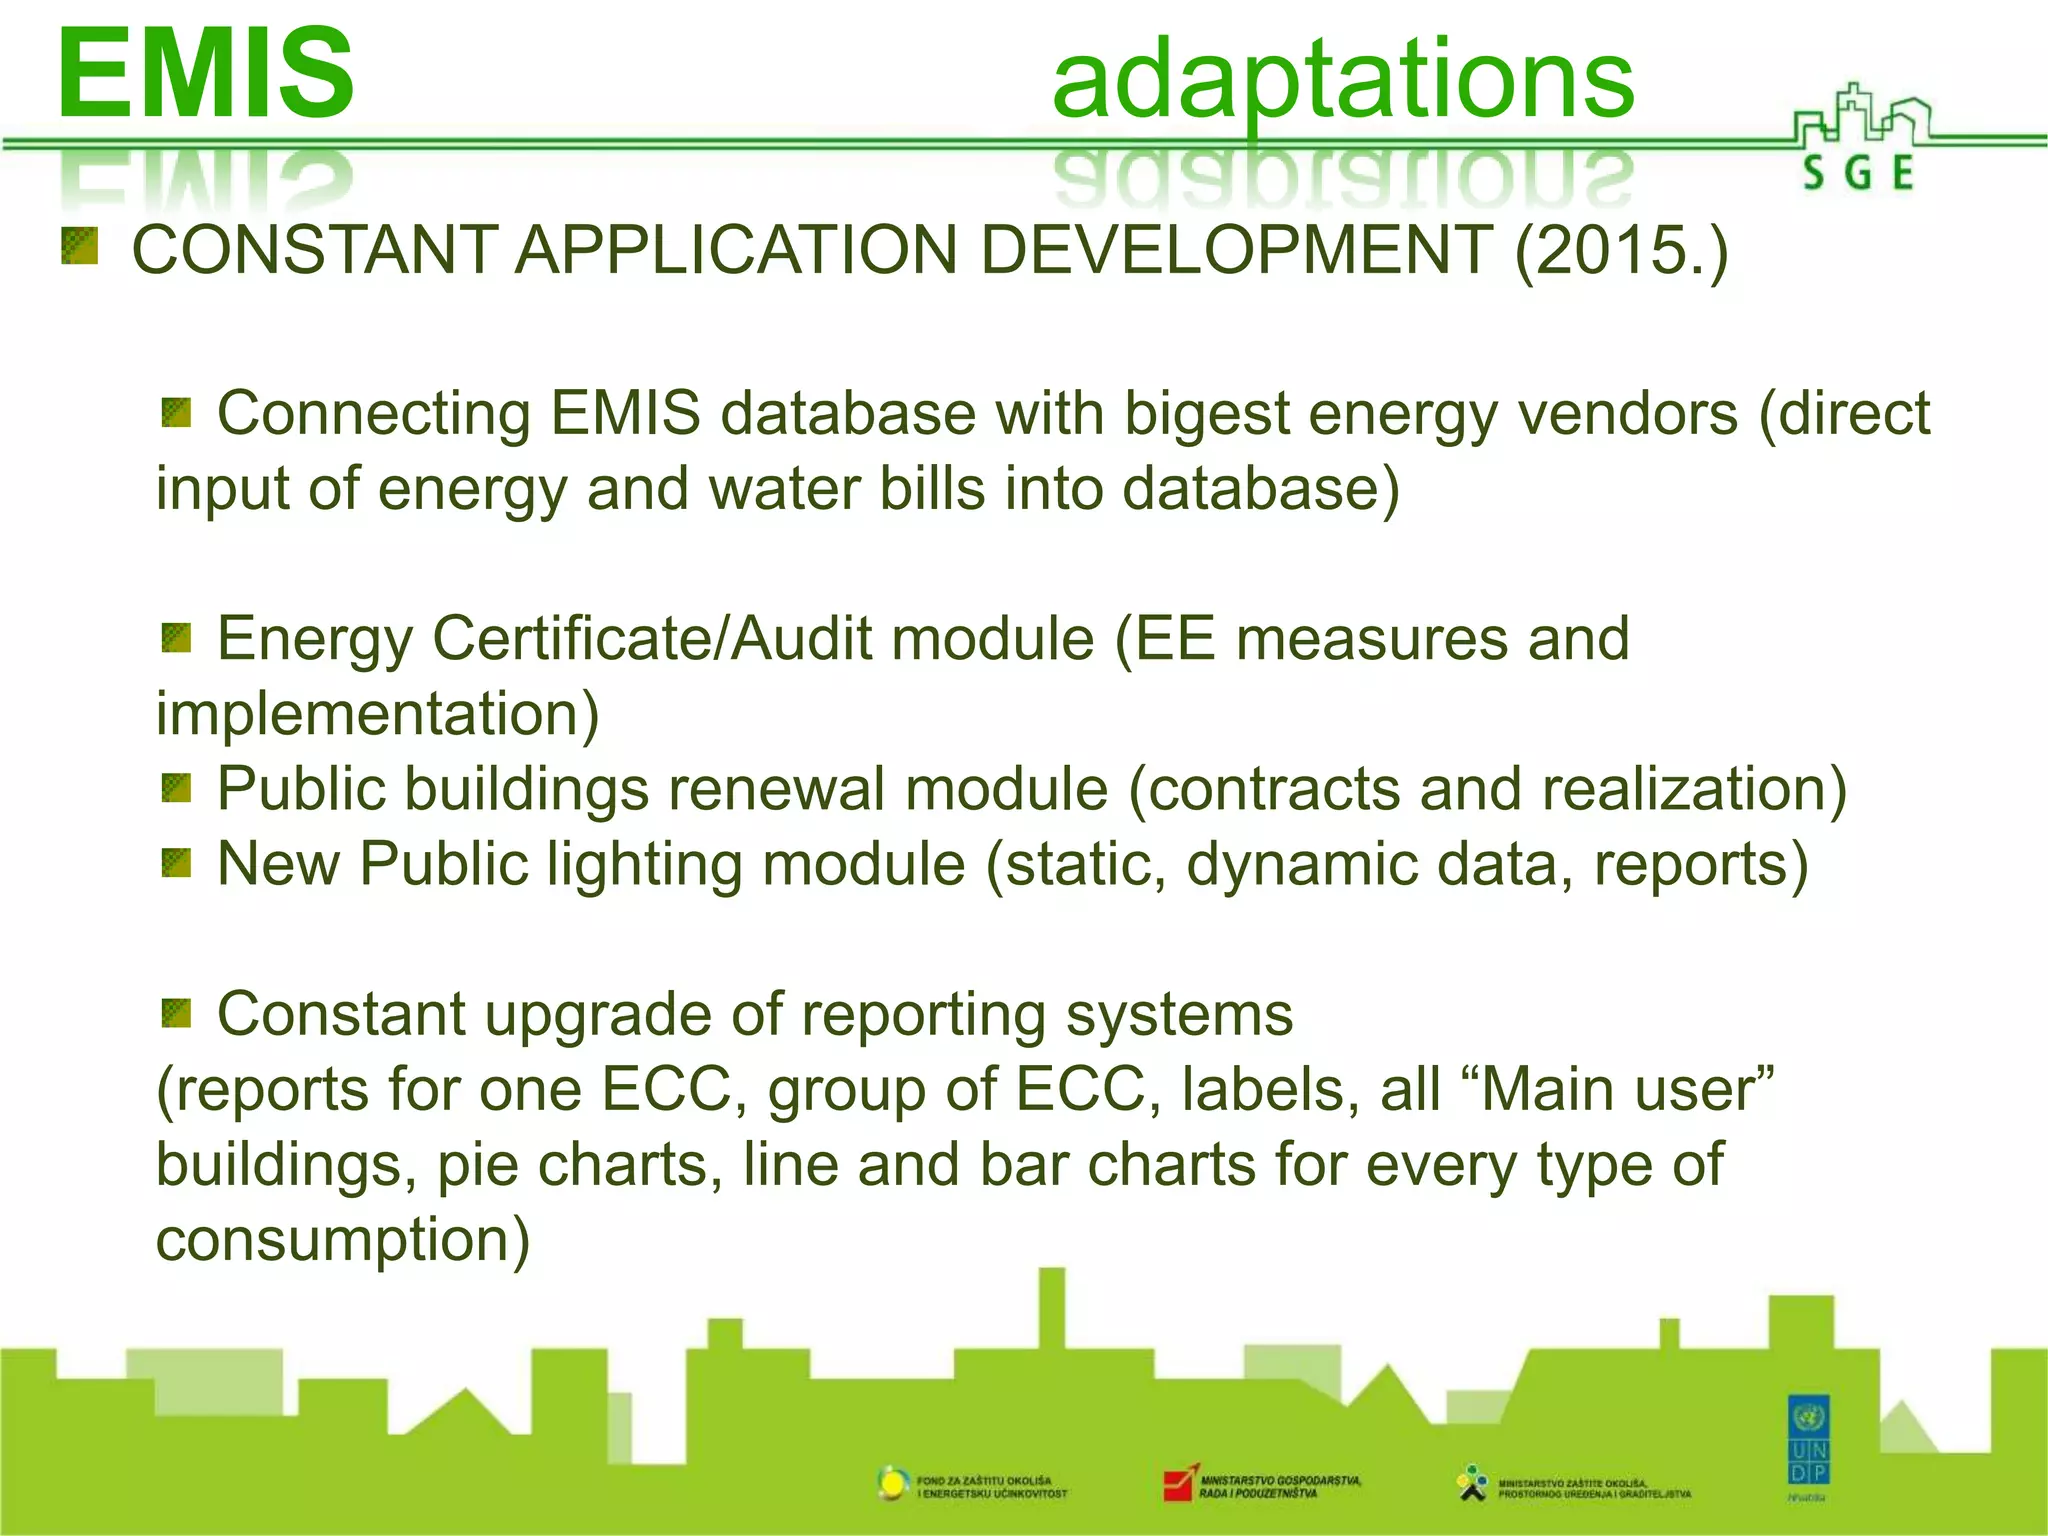
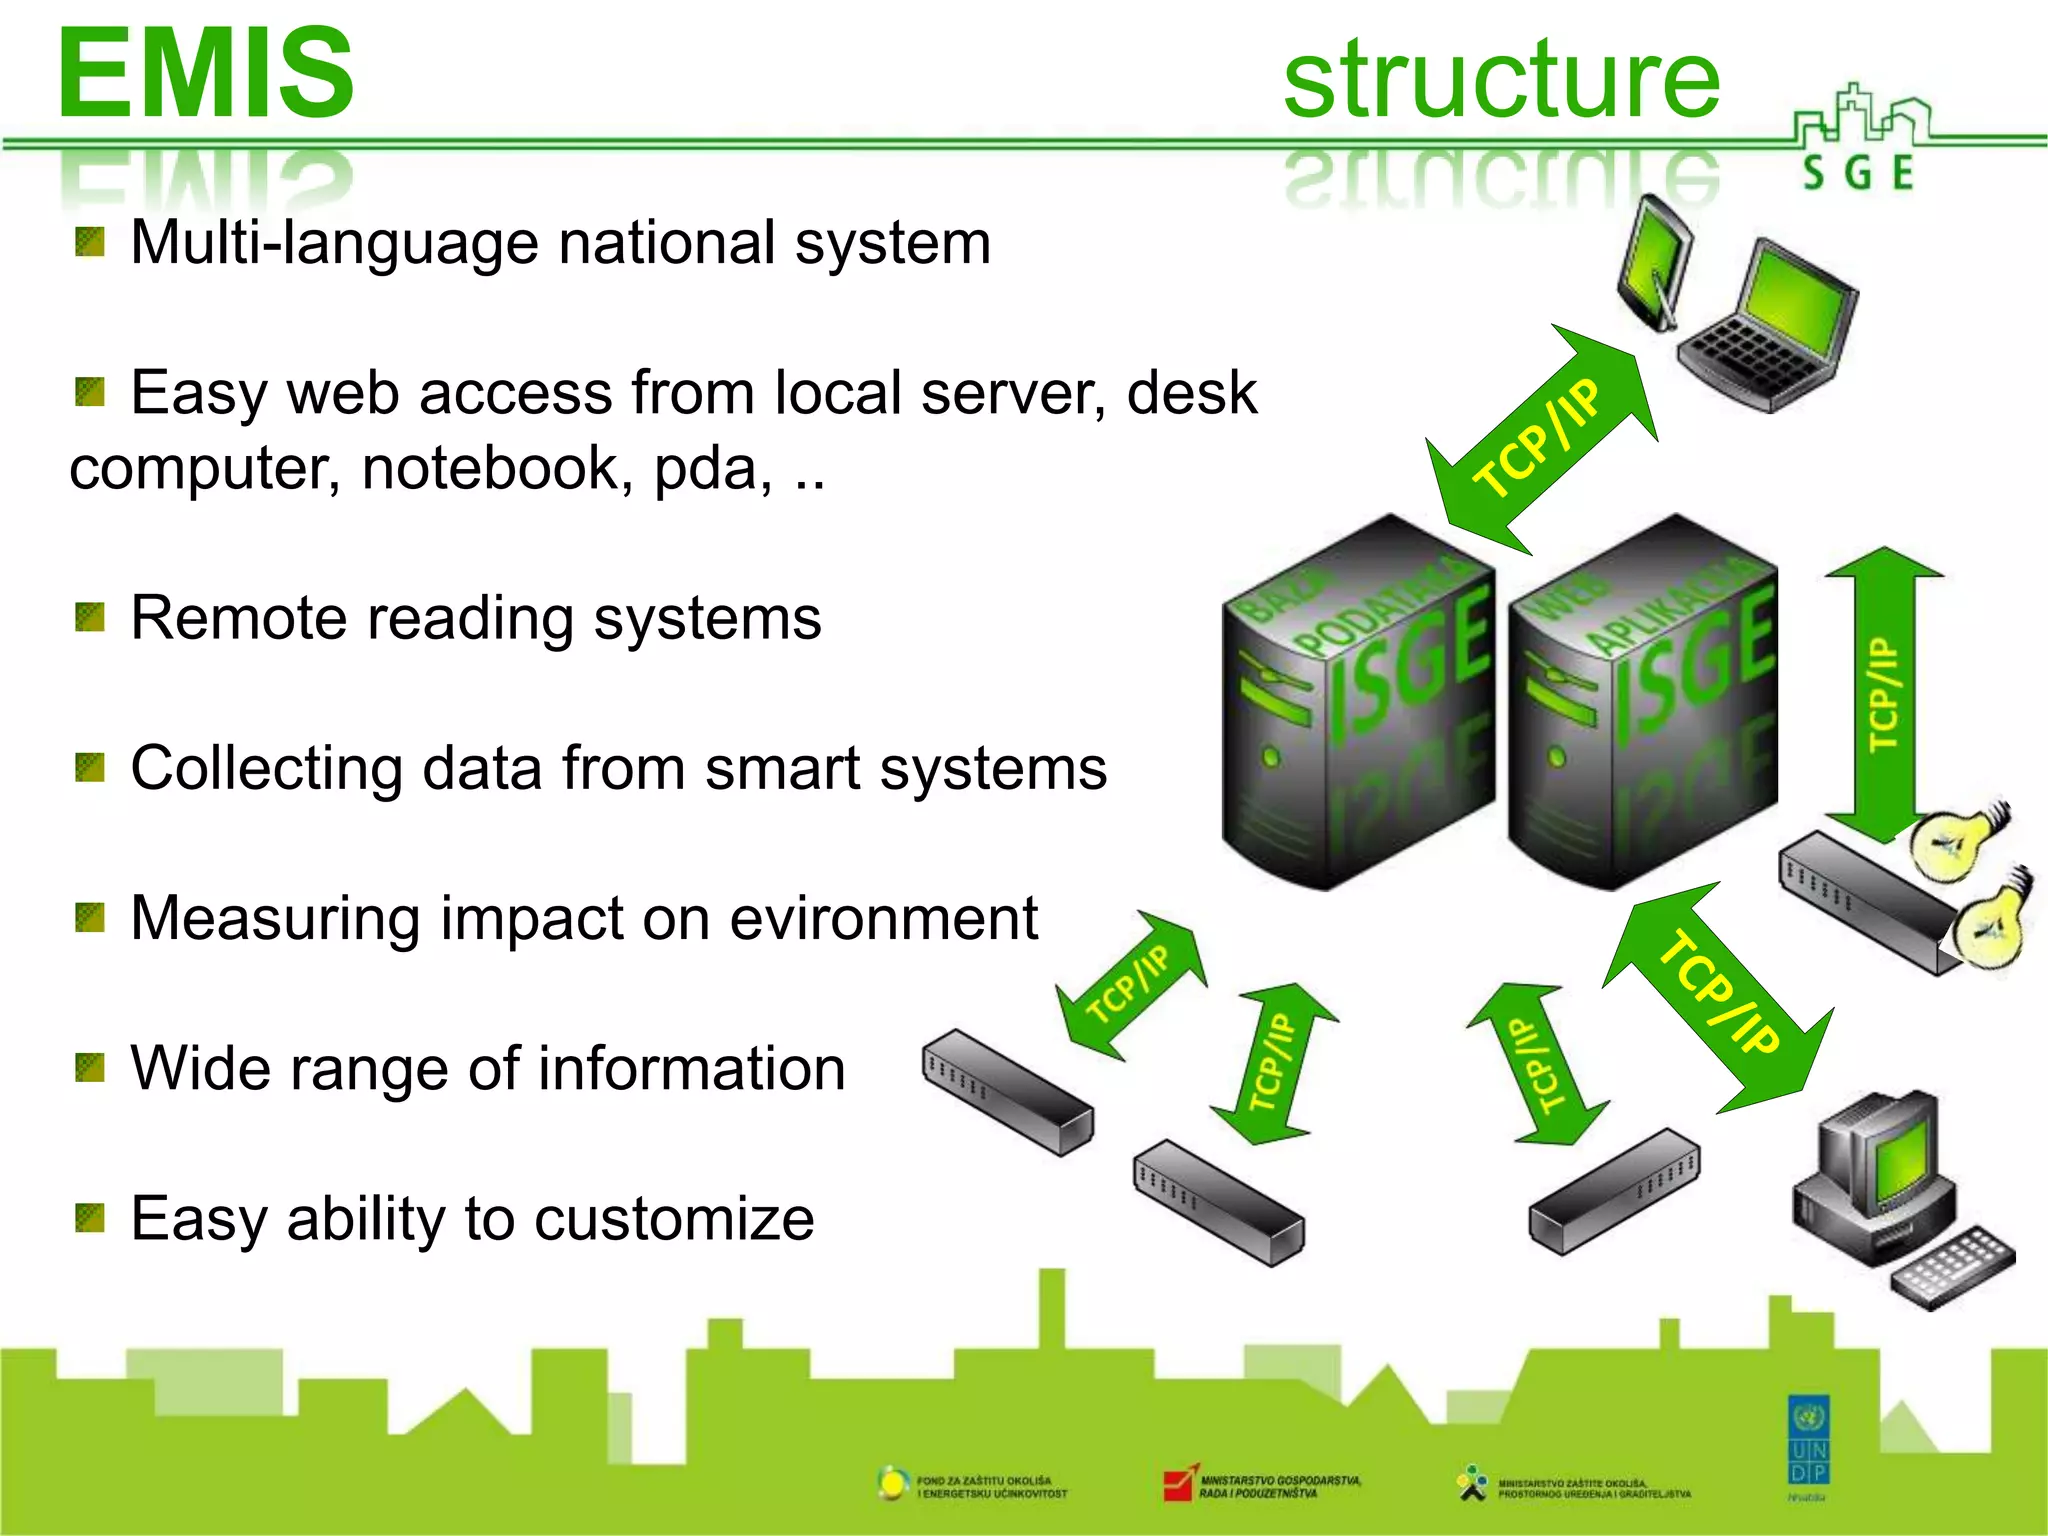
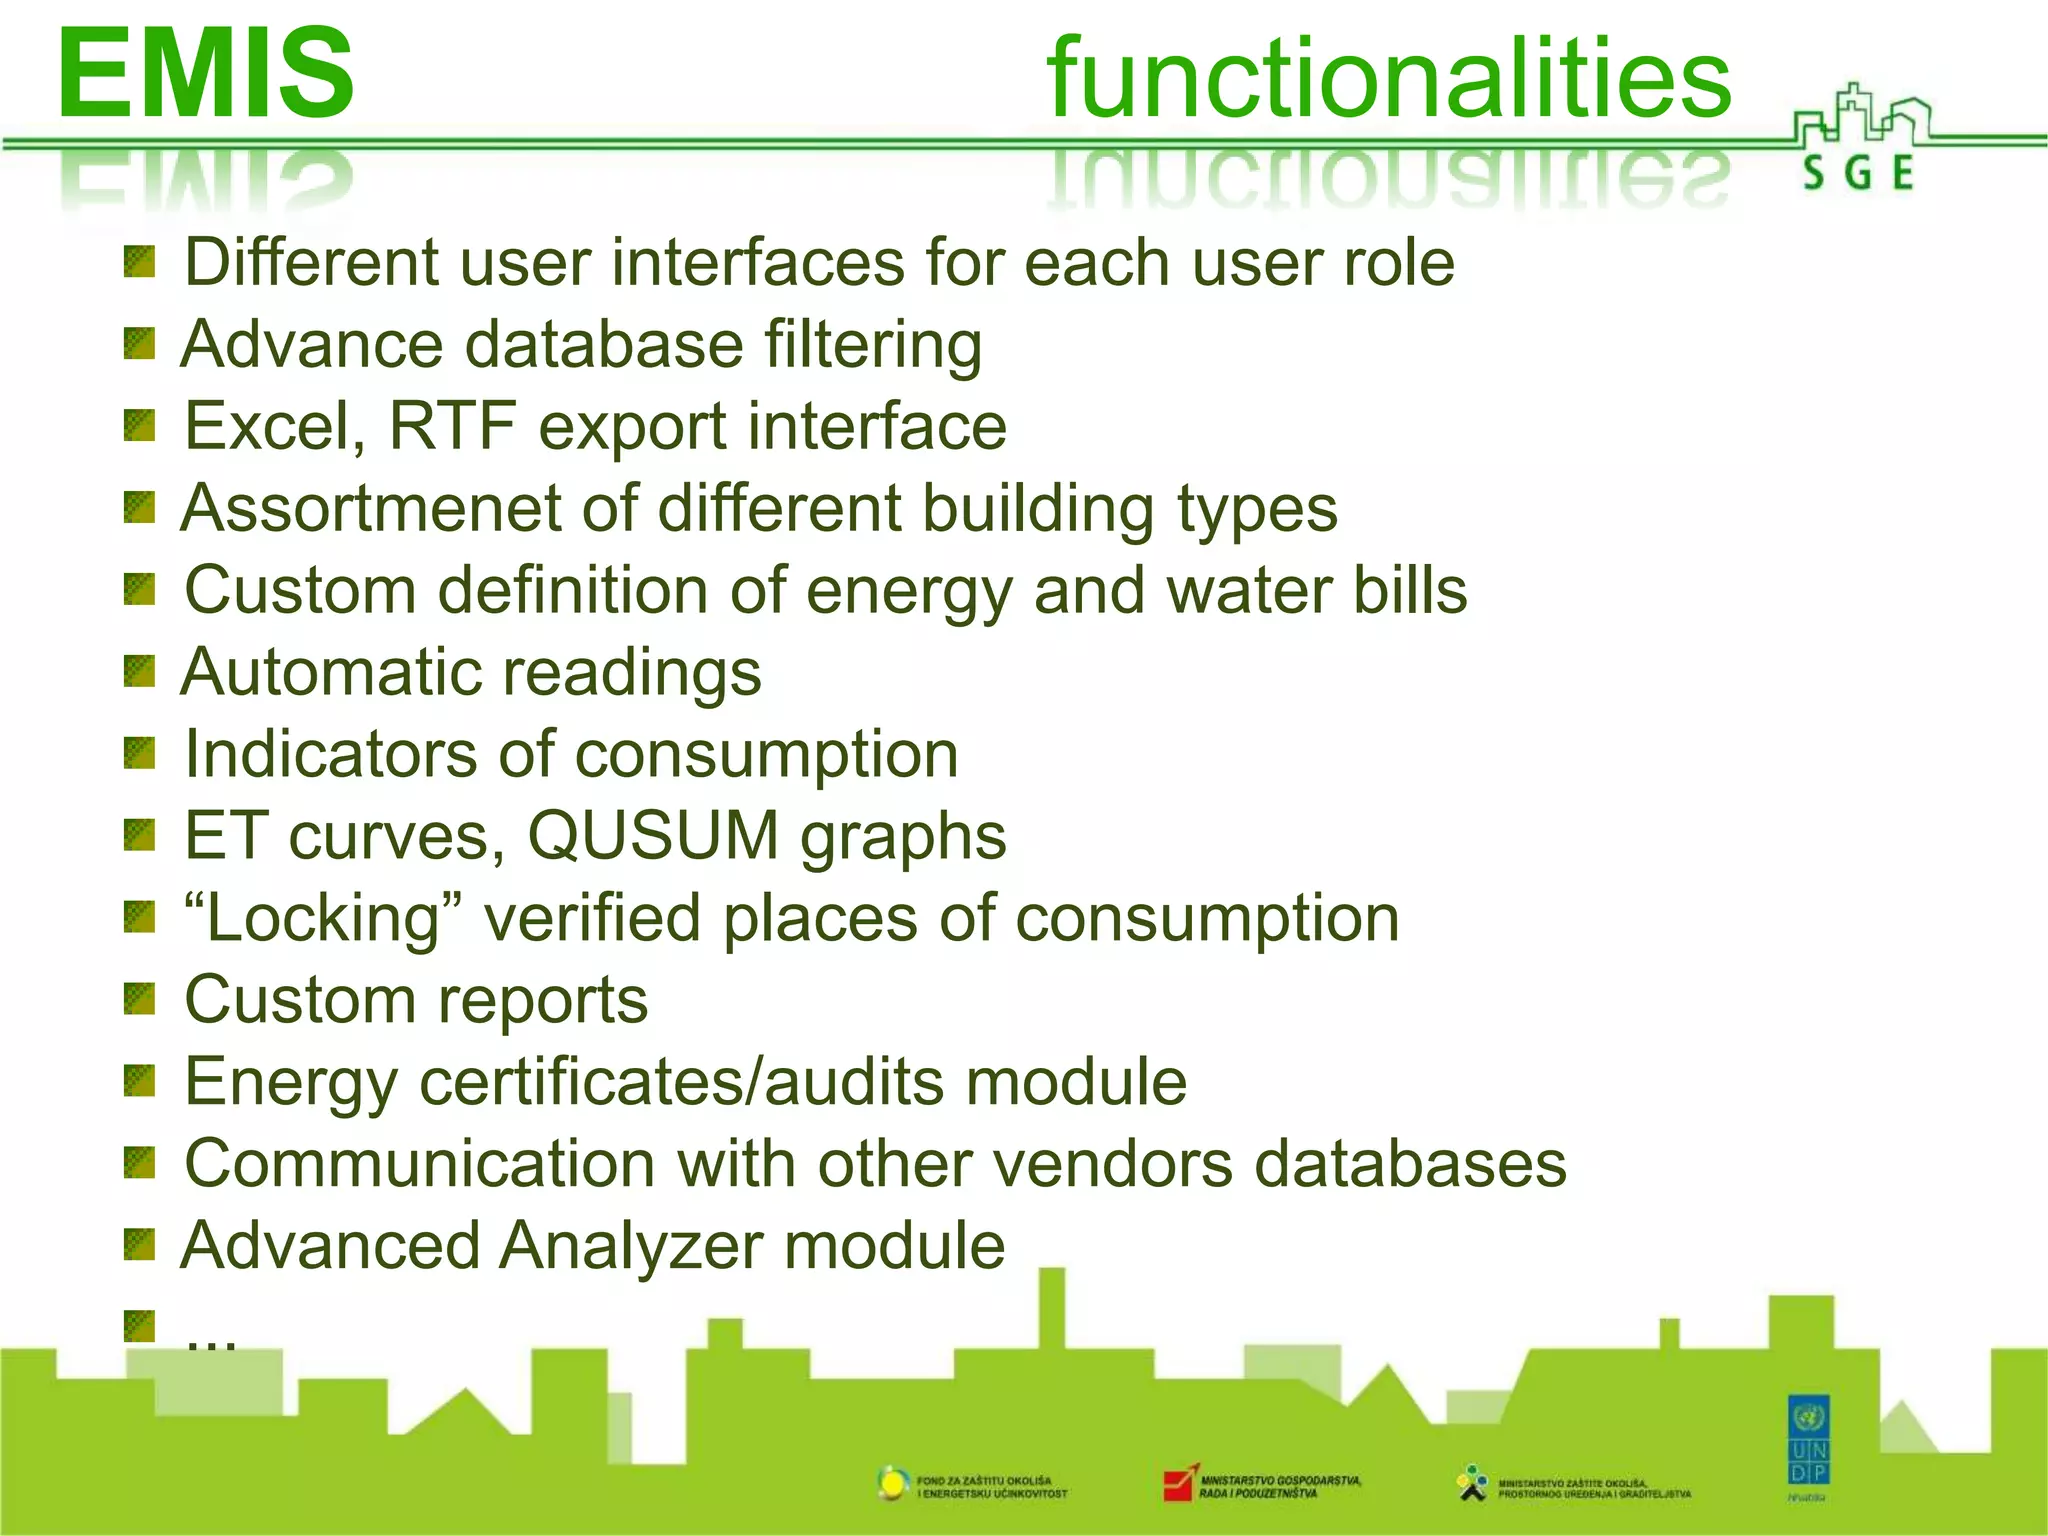
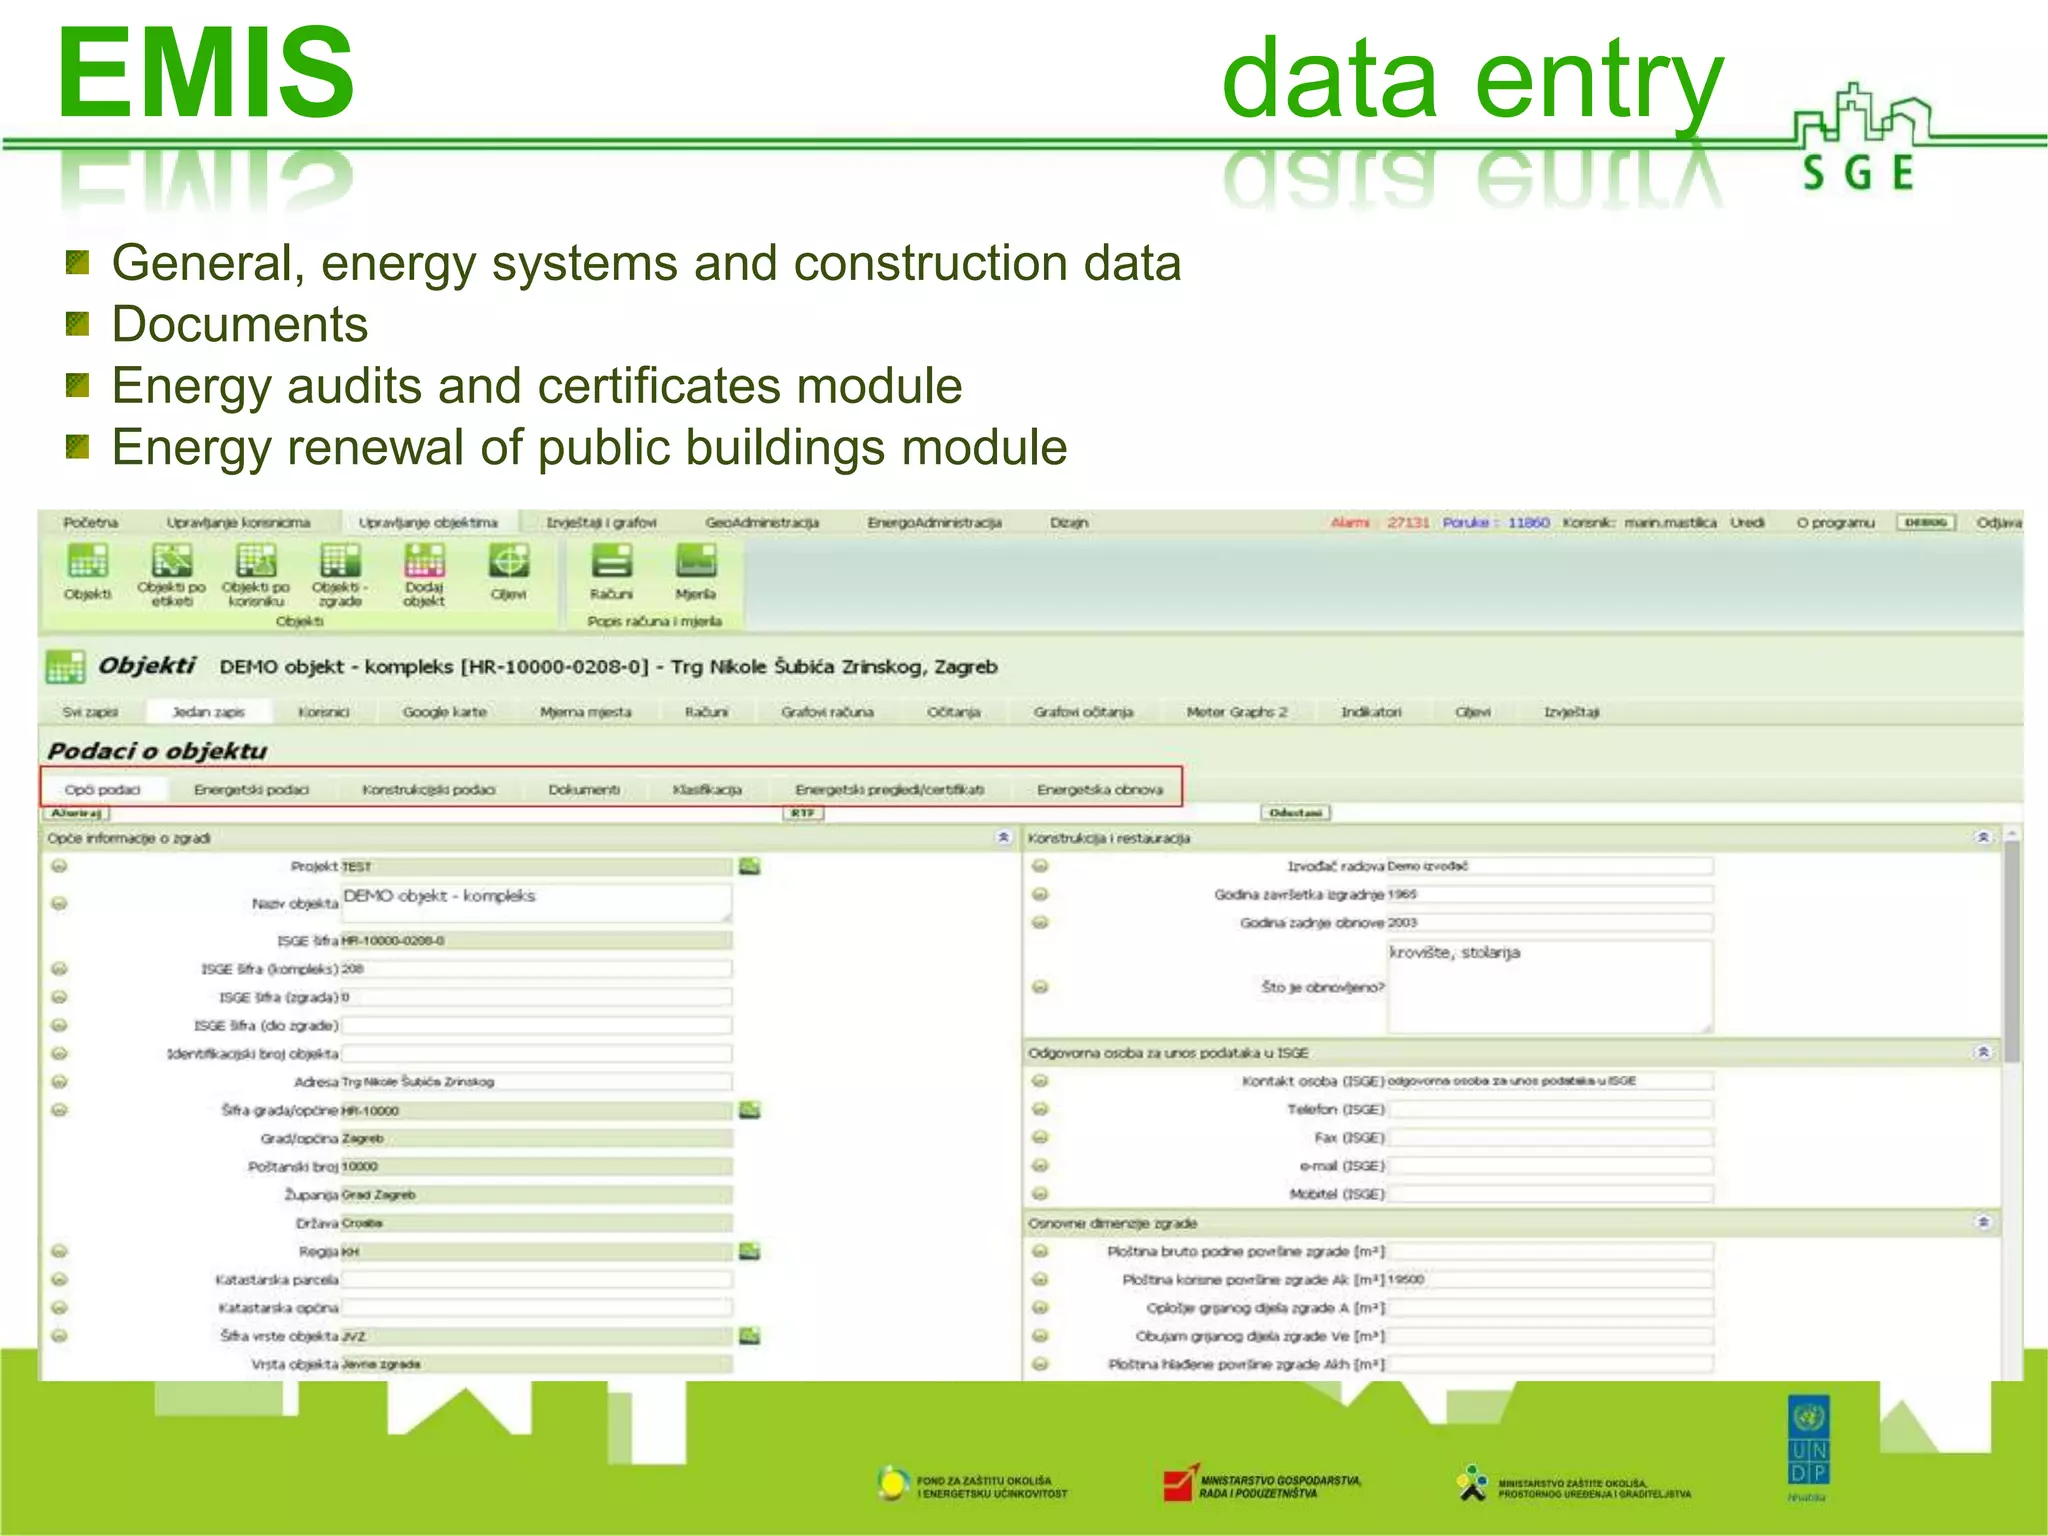
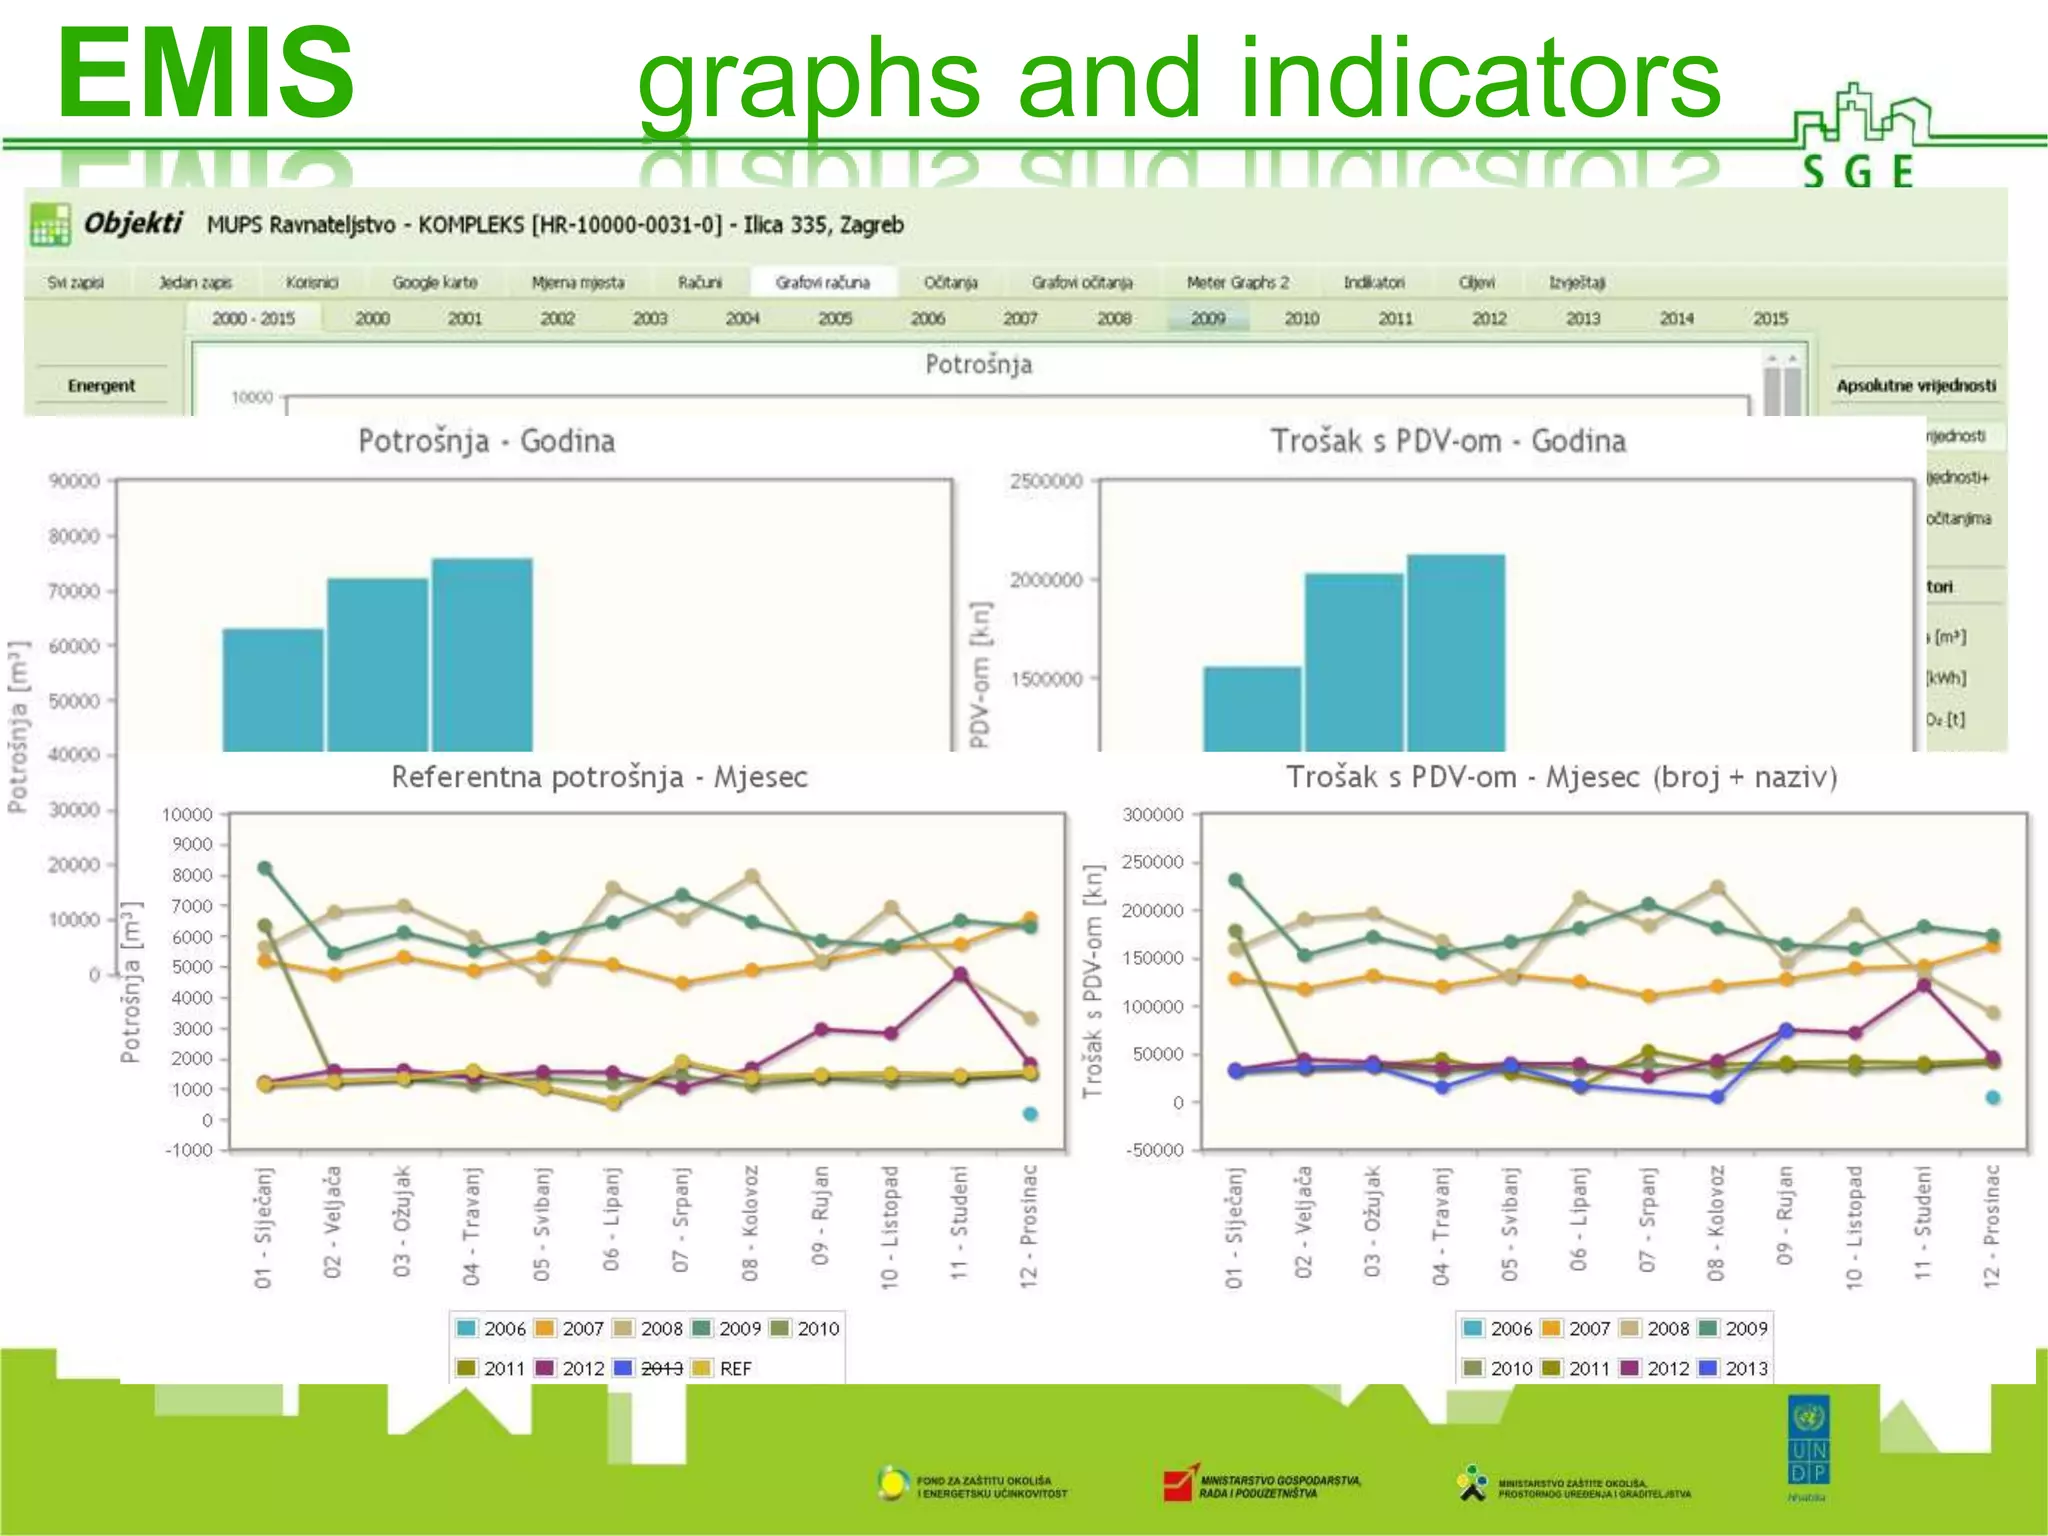
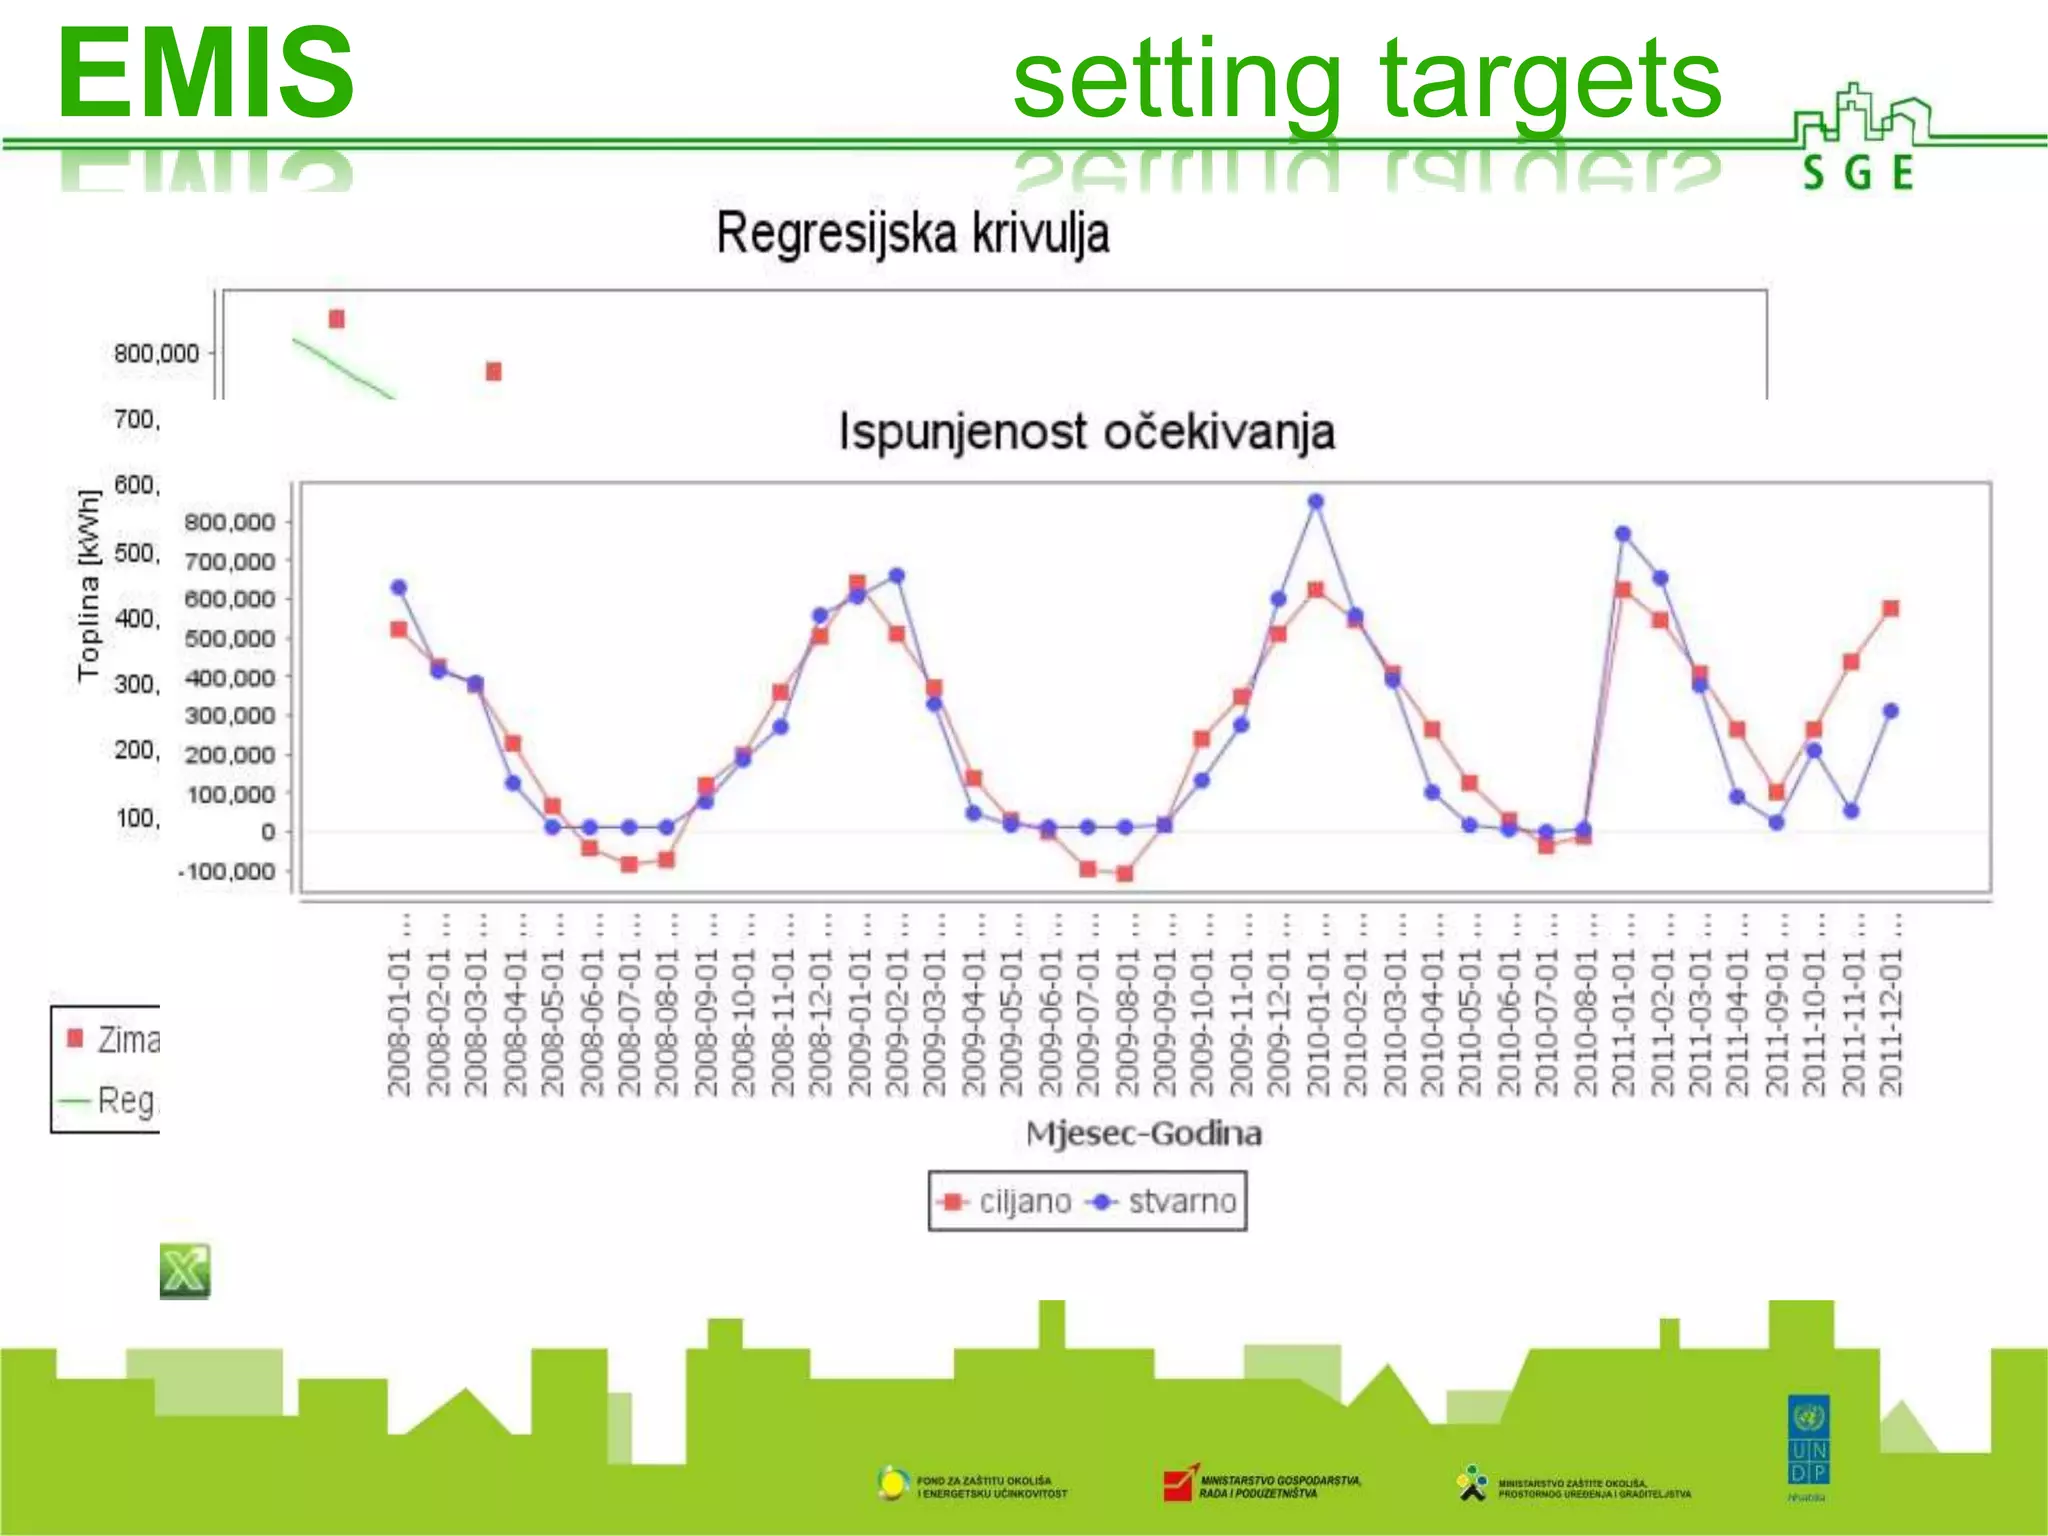
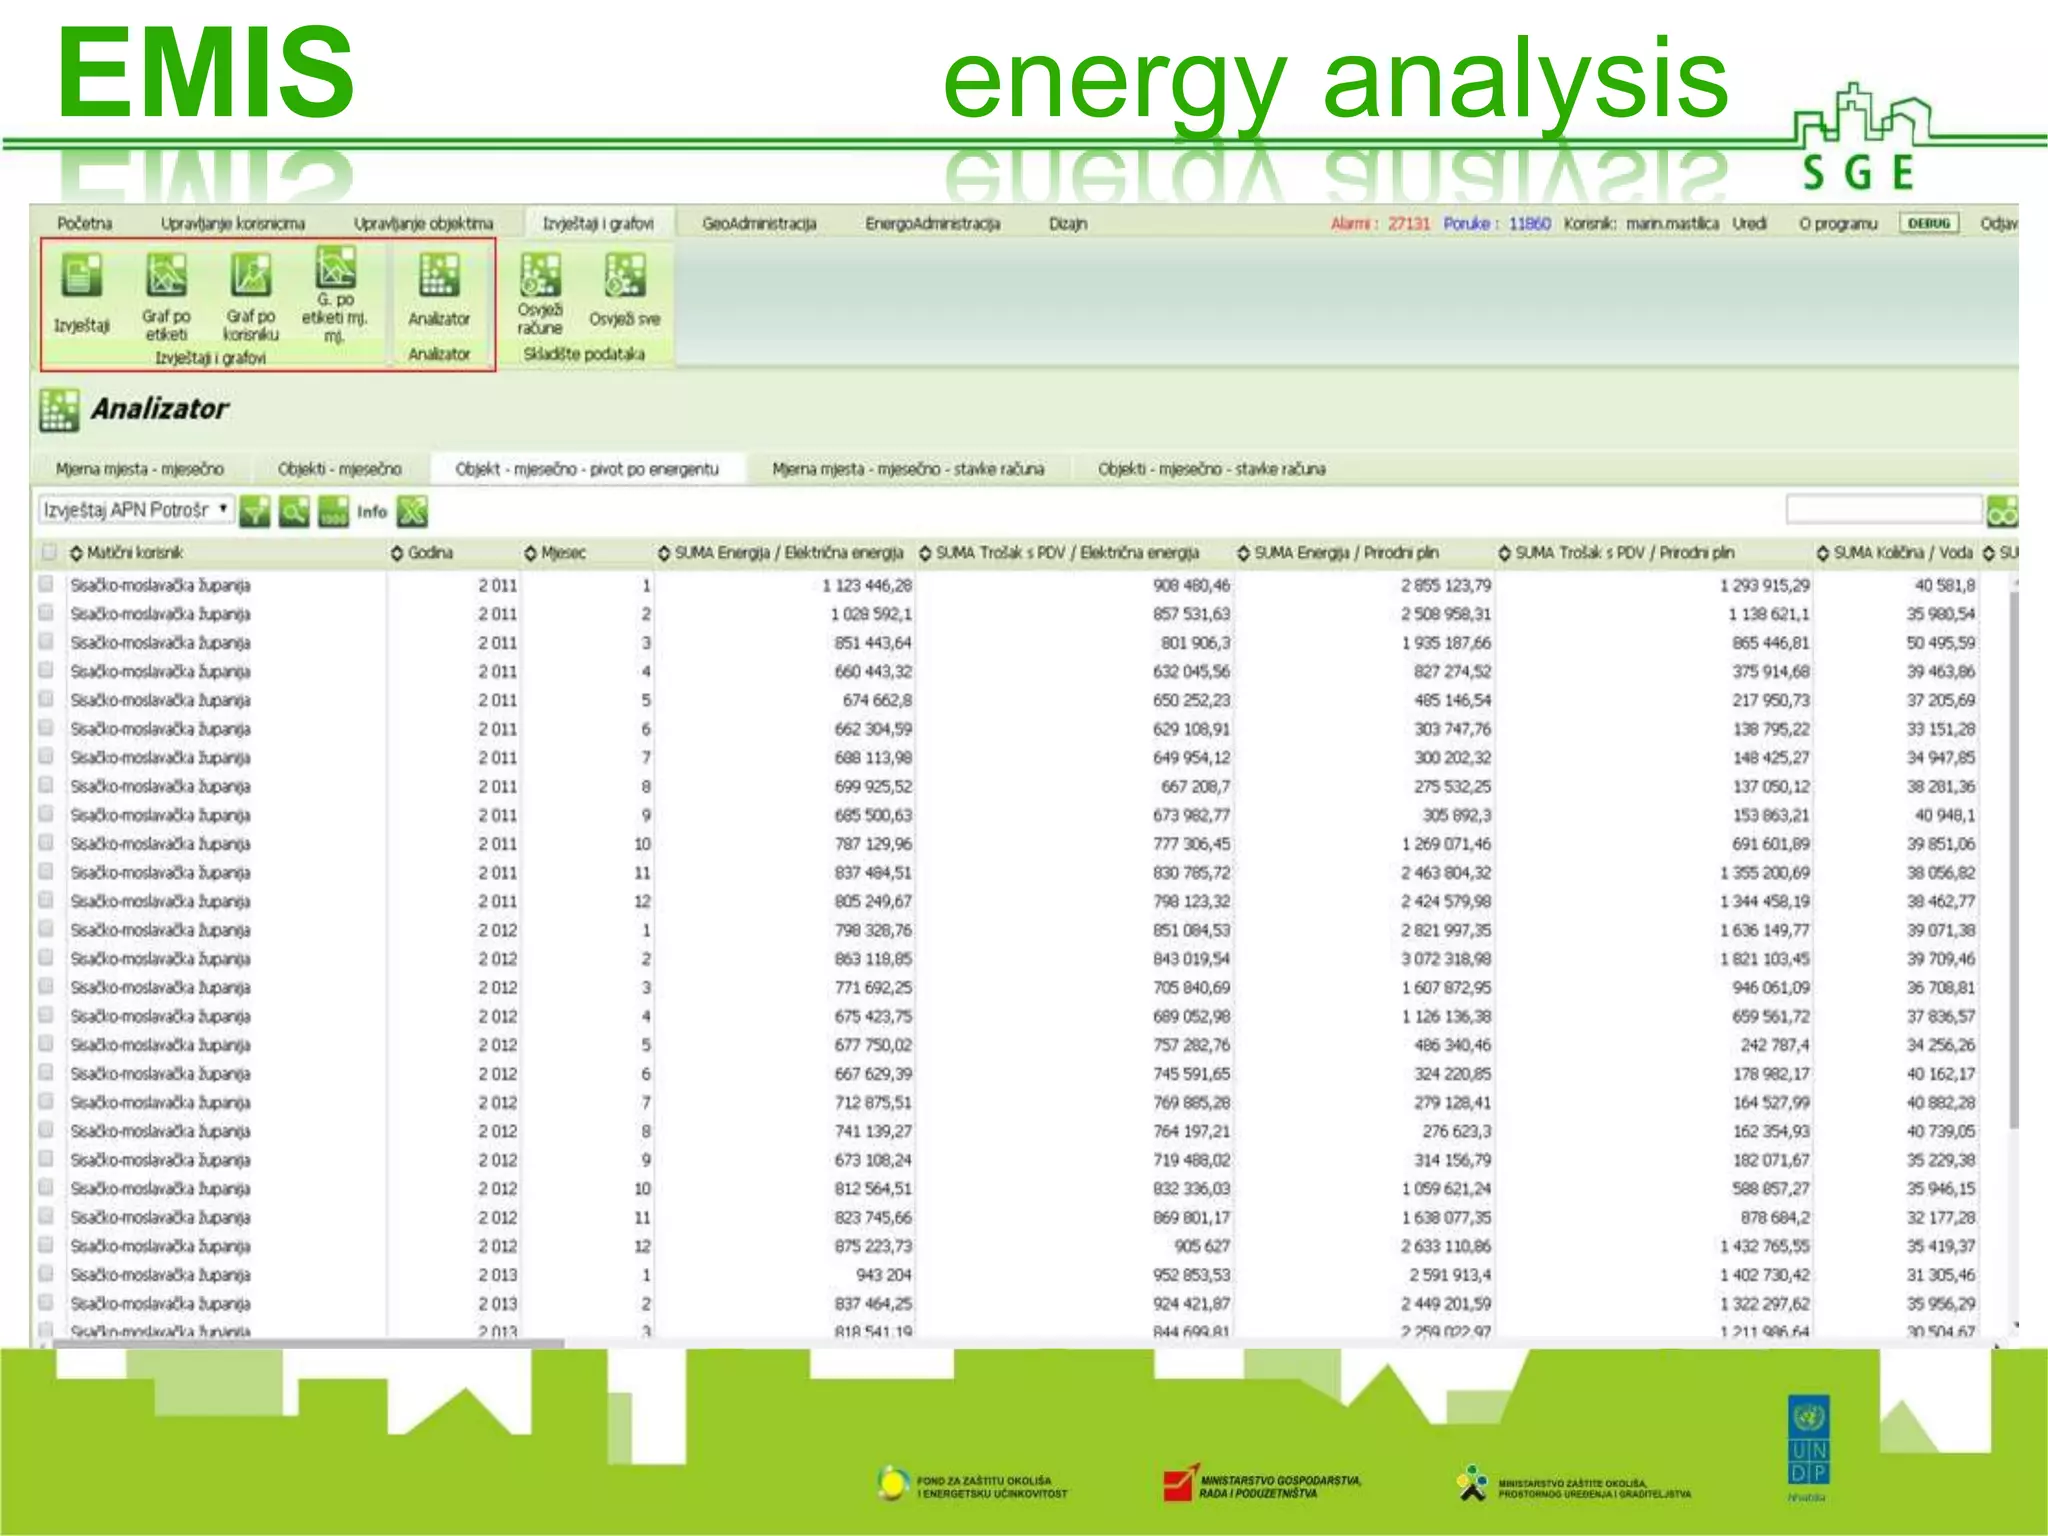
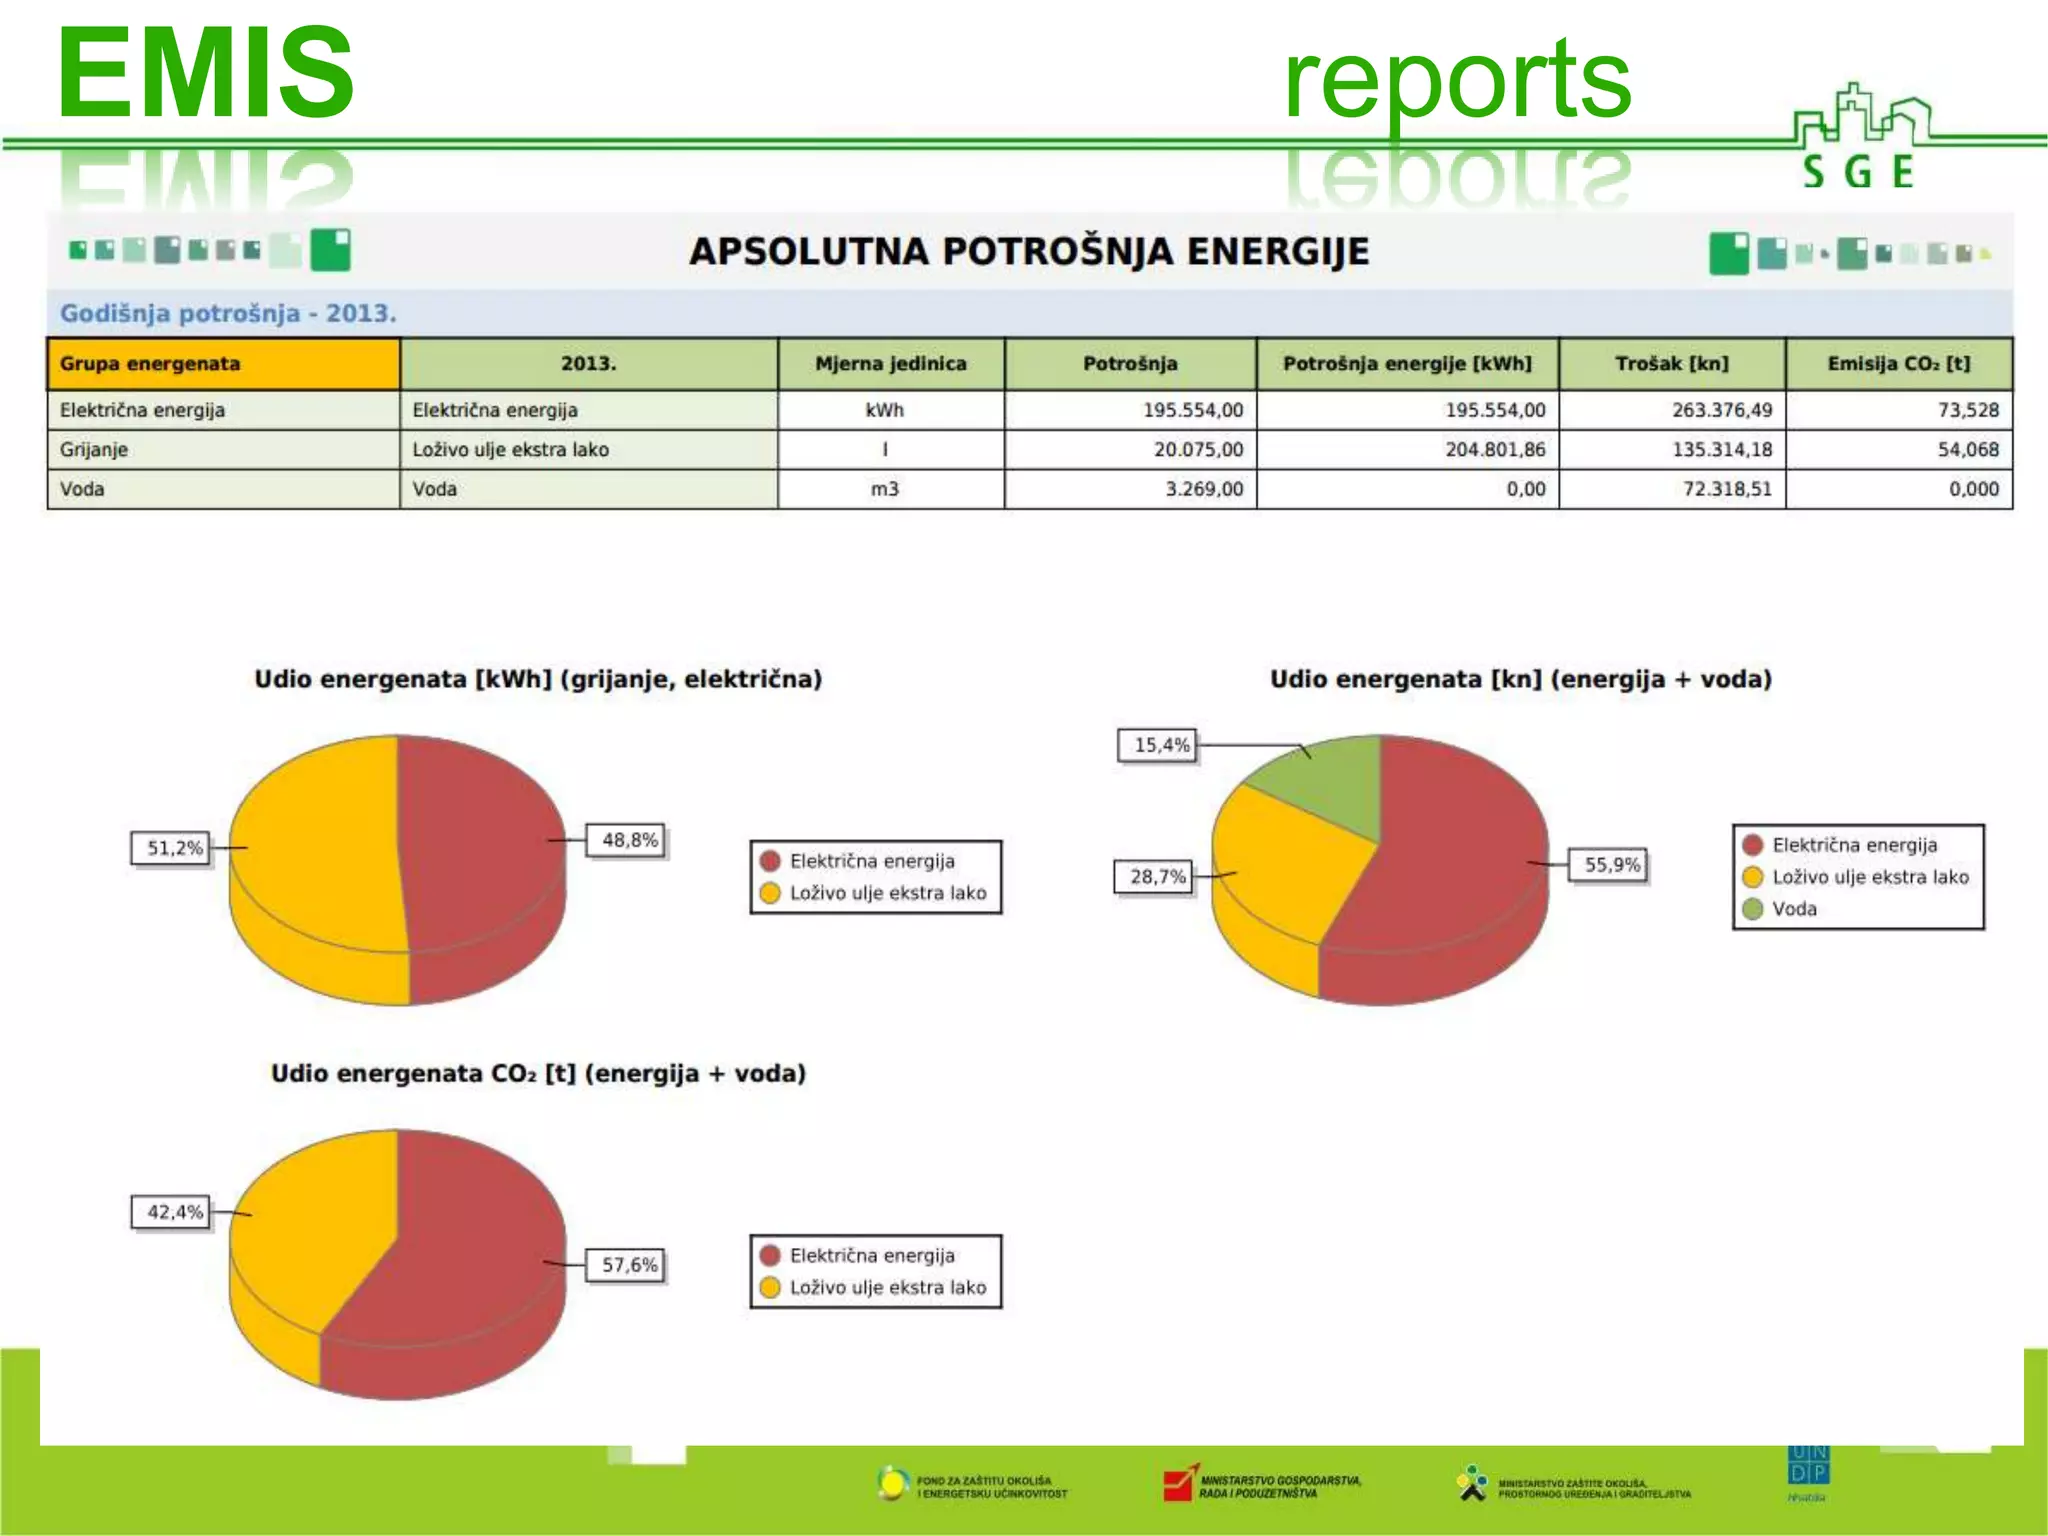
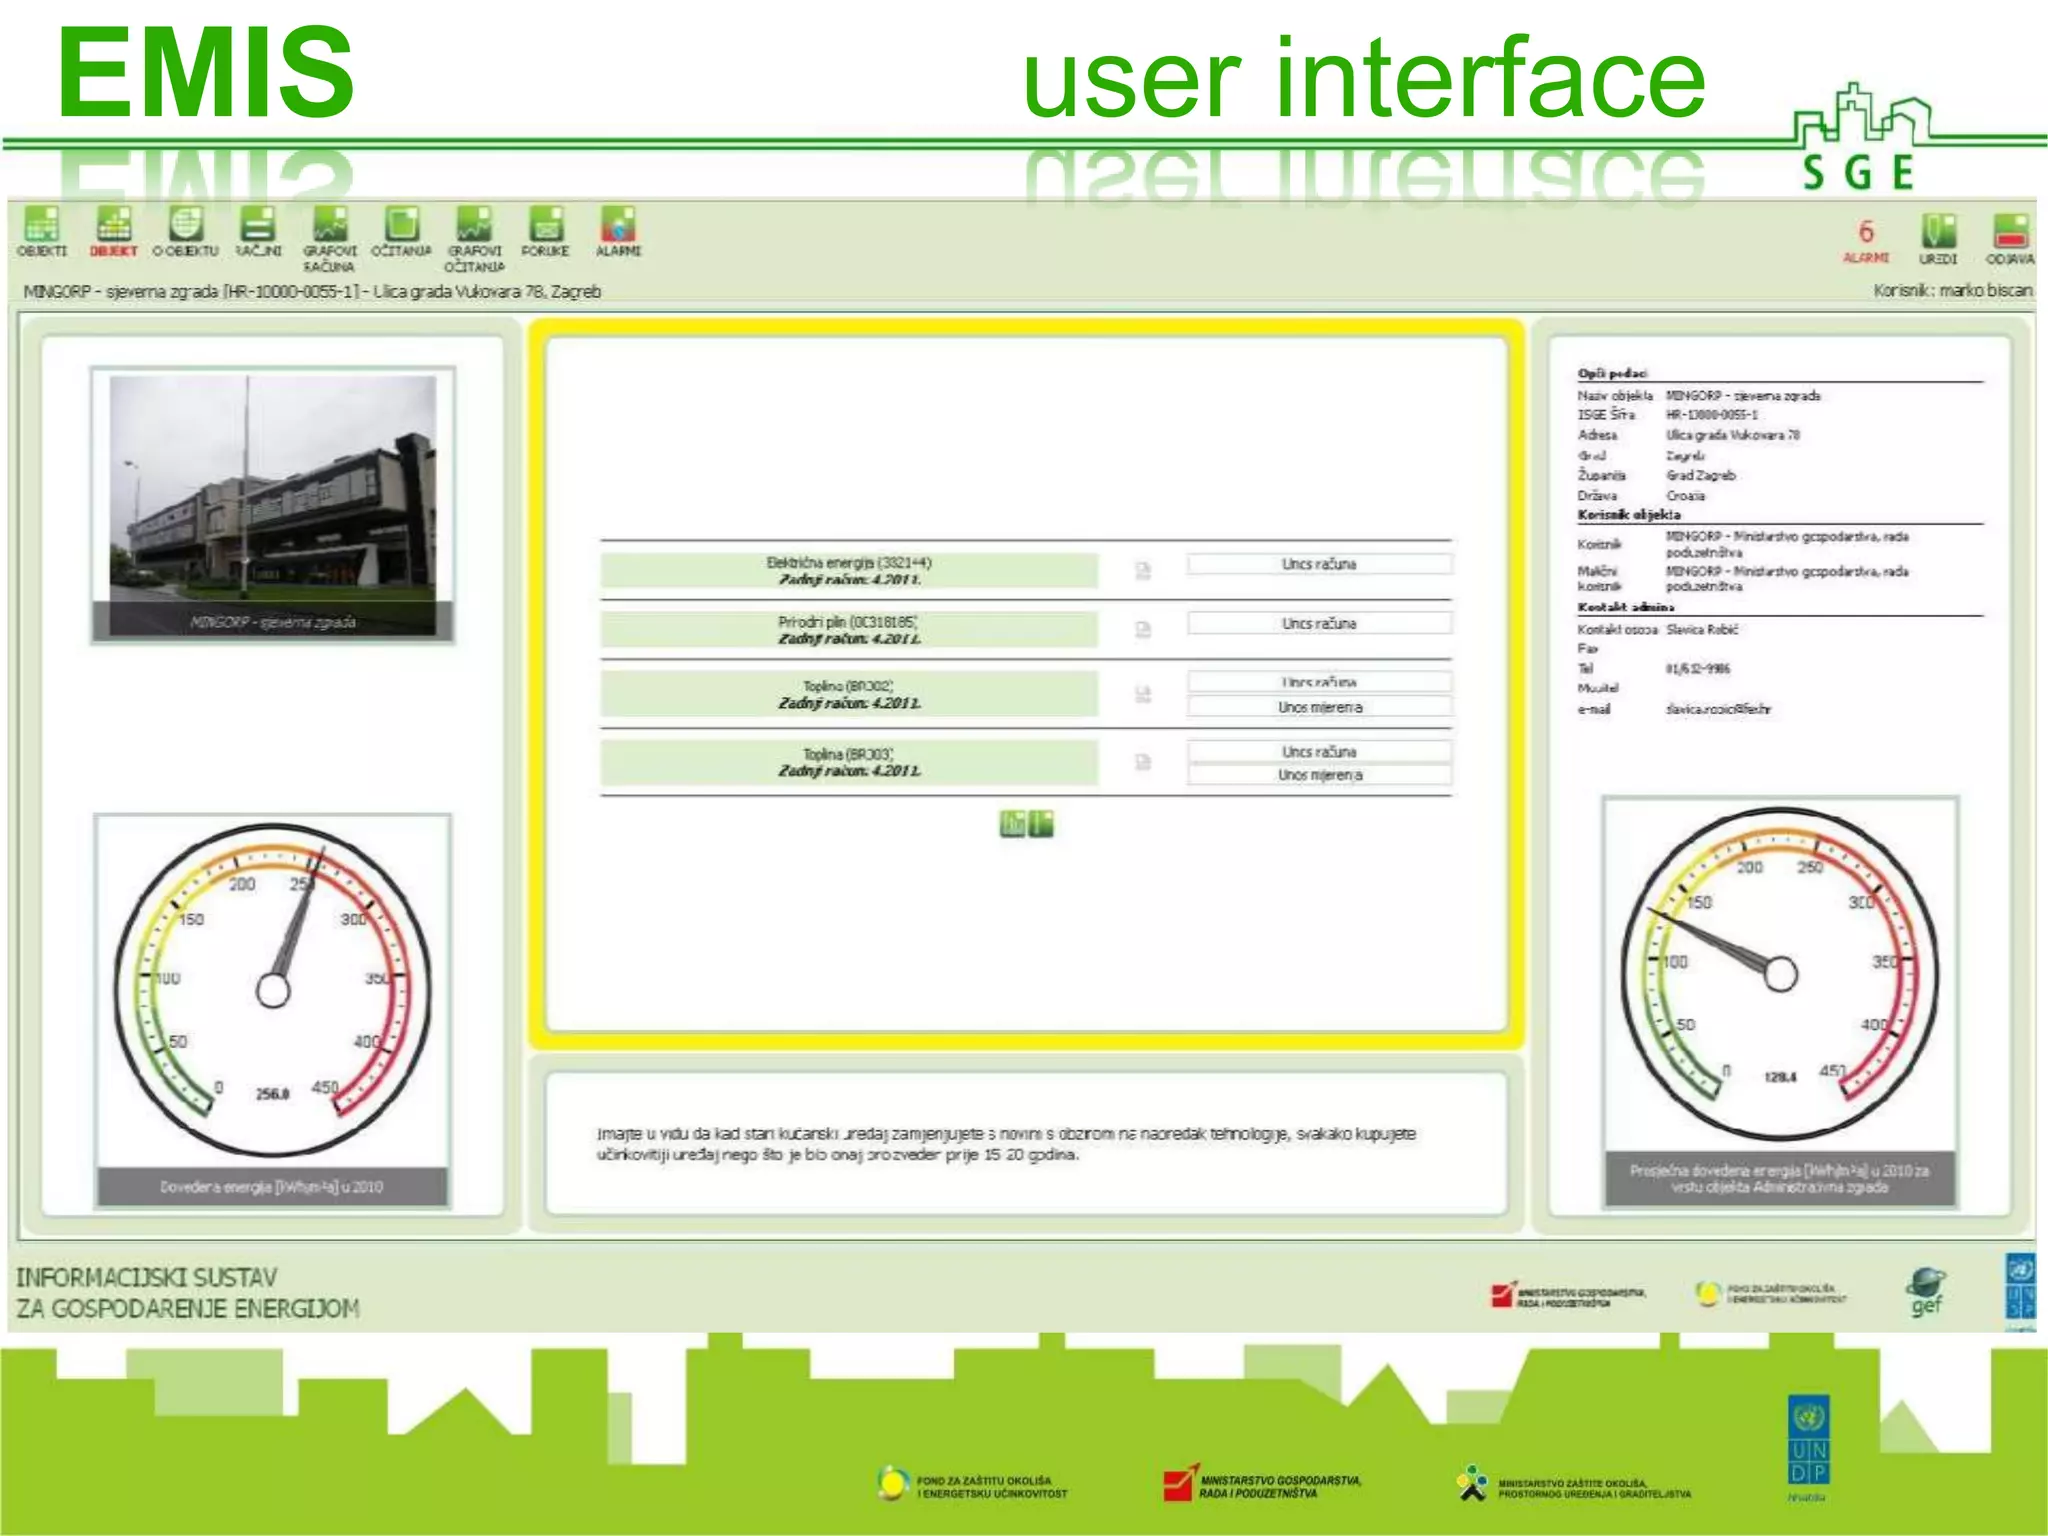
- The system provides different interfaces tailored to user roles. It features tools for data filtering, report generation, and consumption analysis.
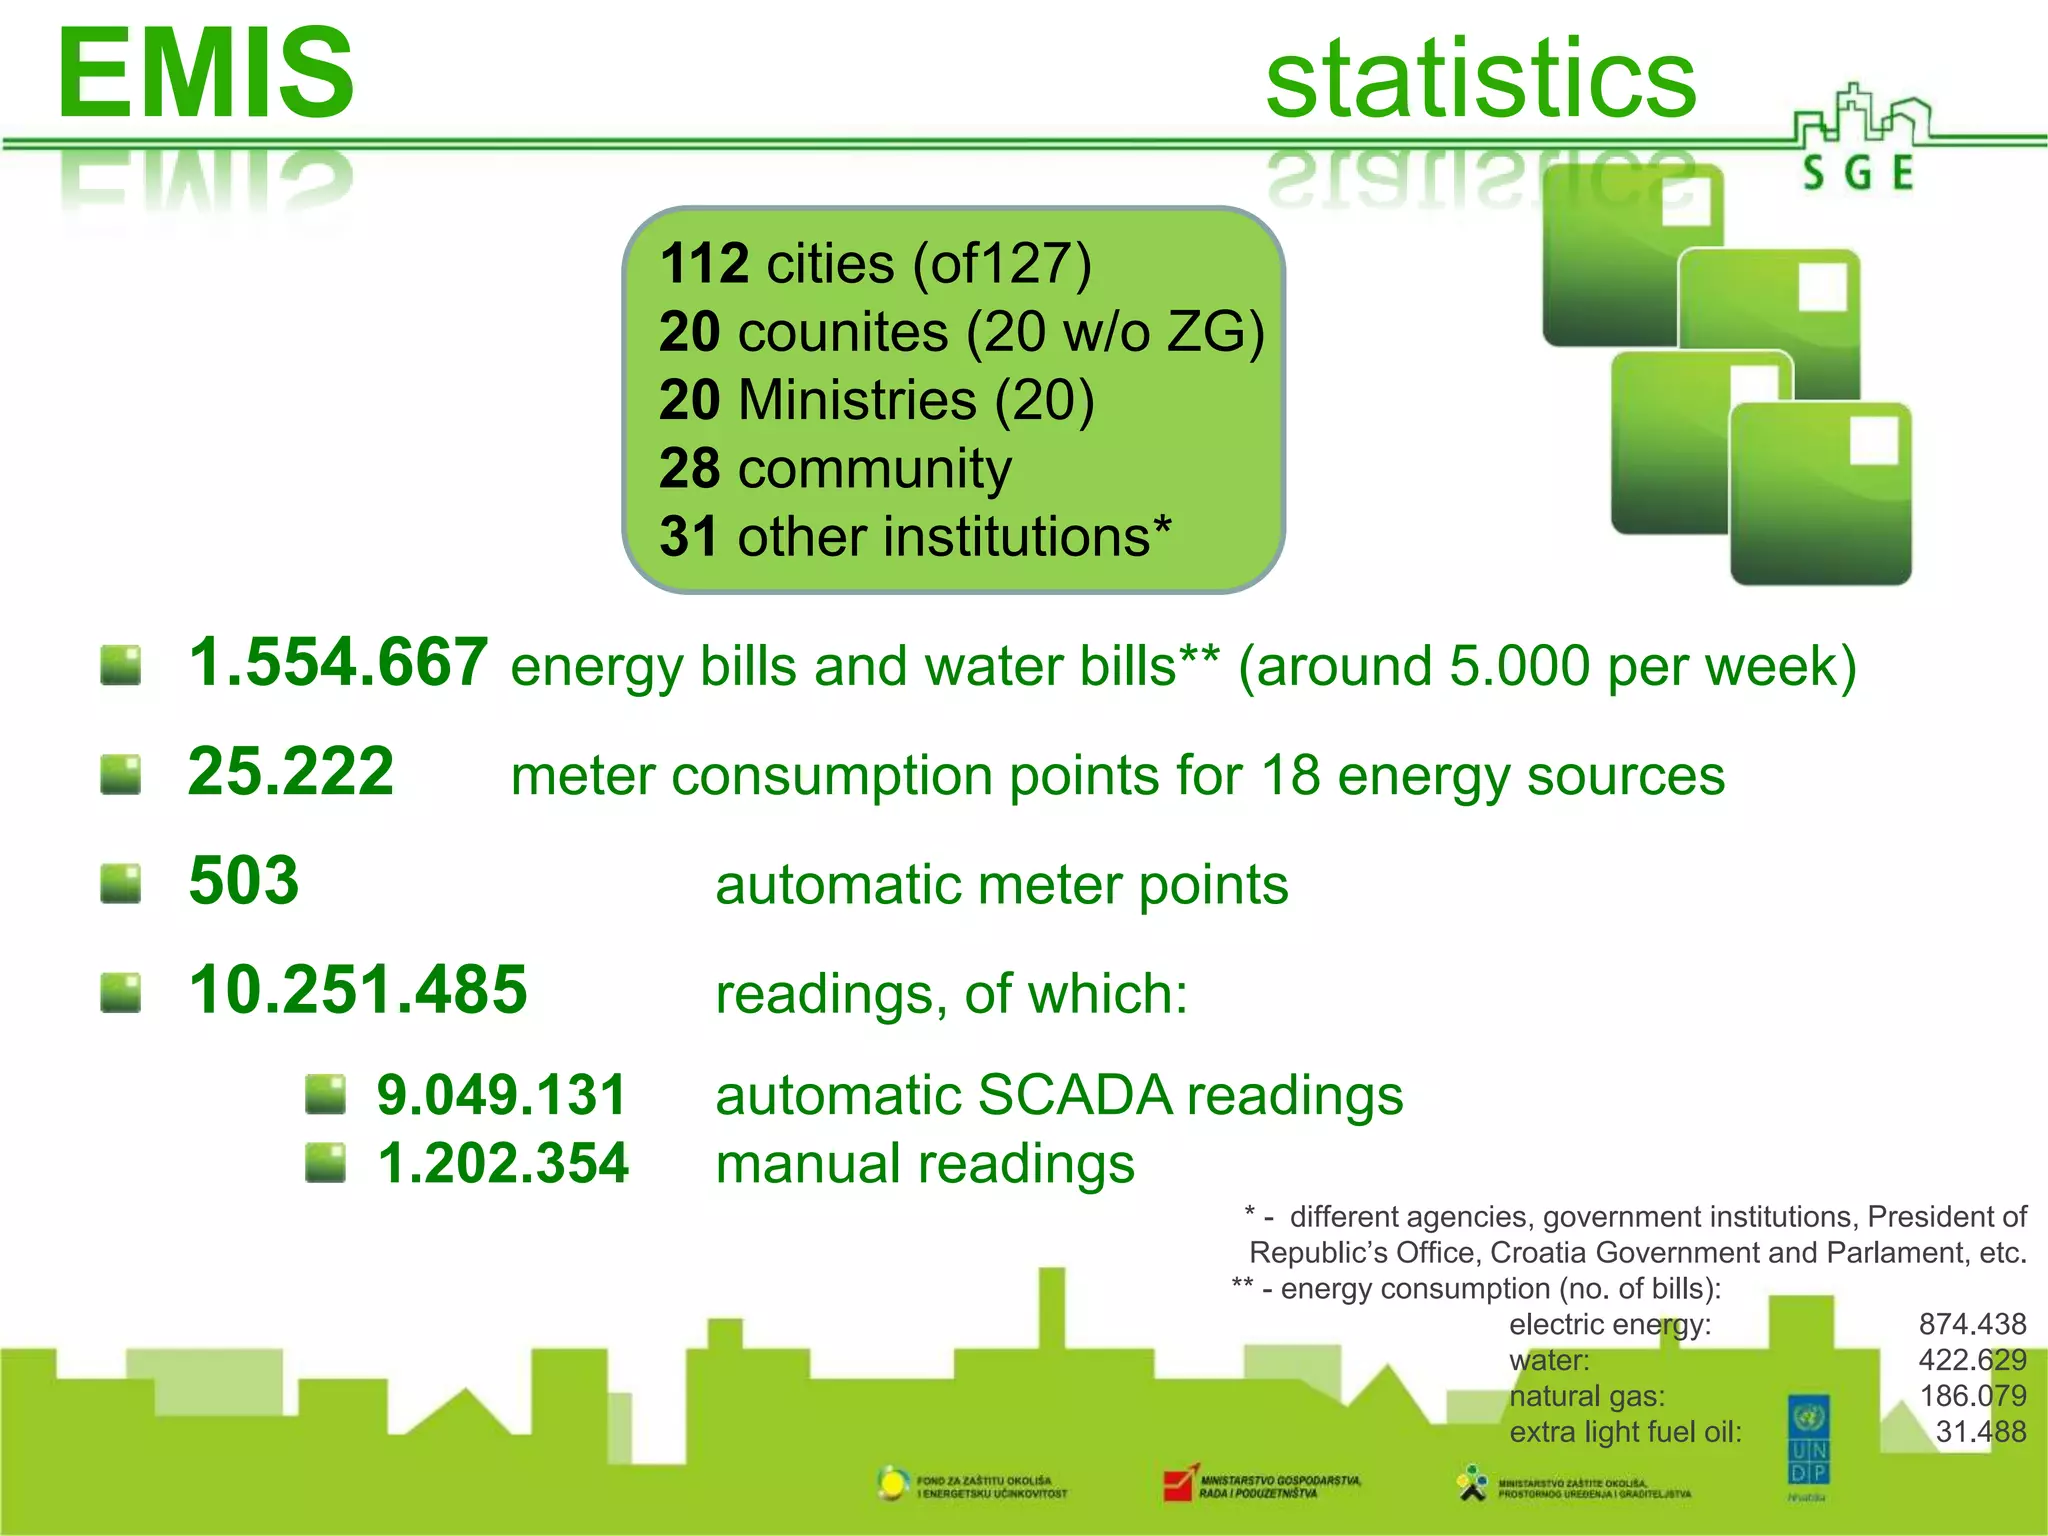
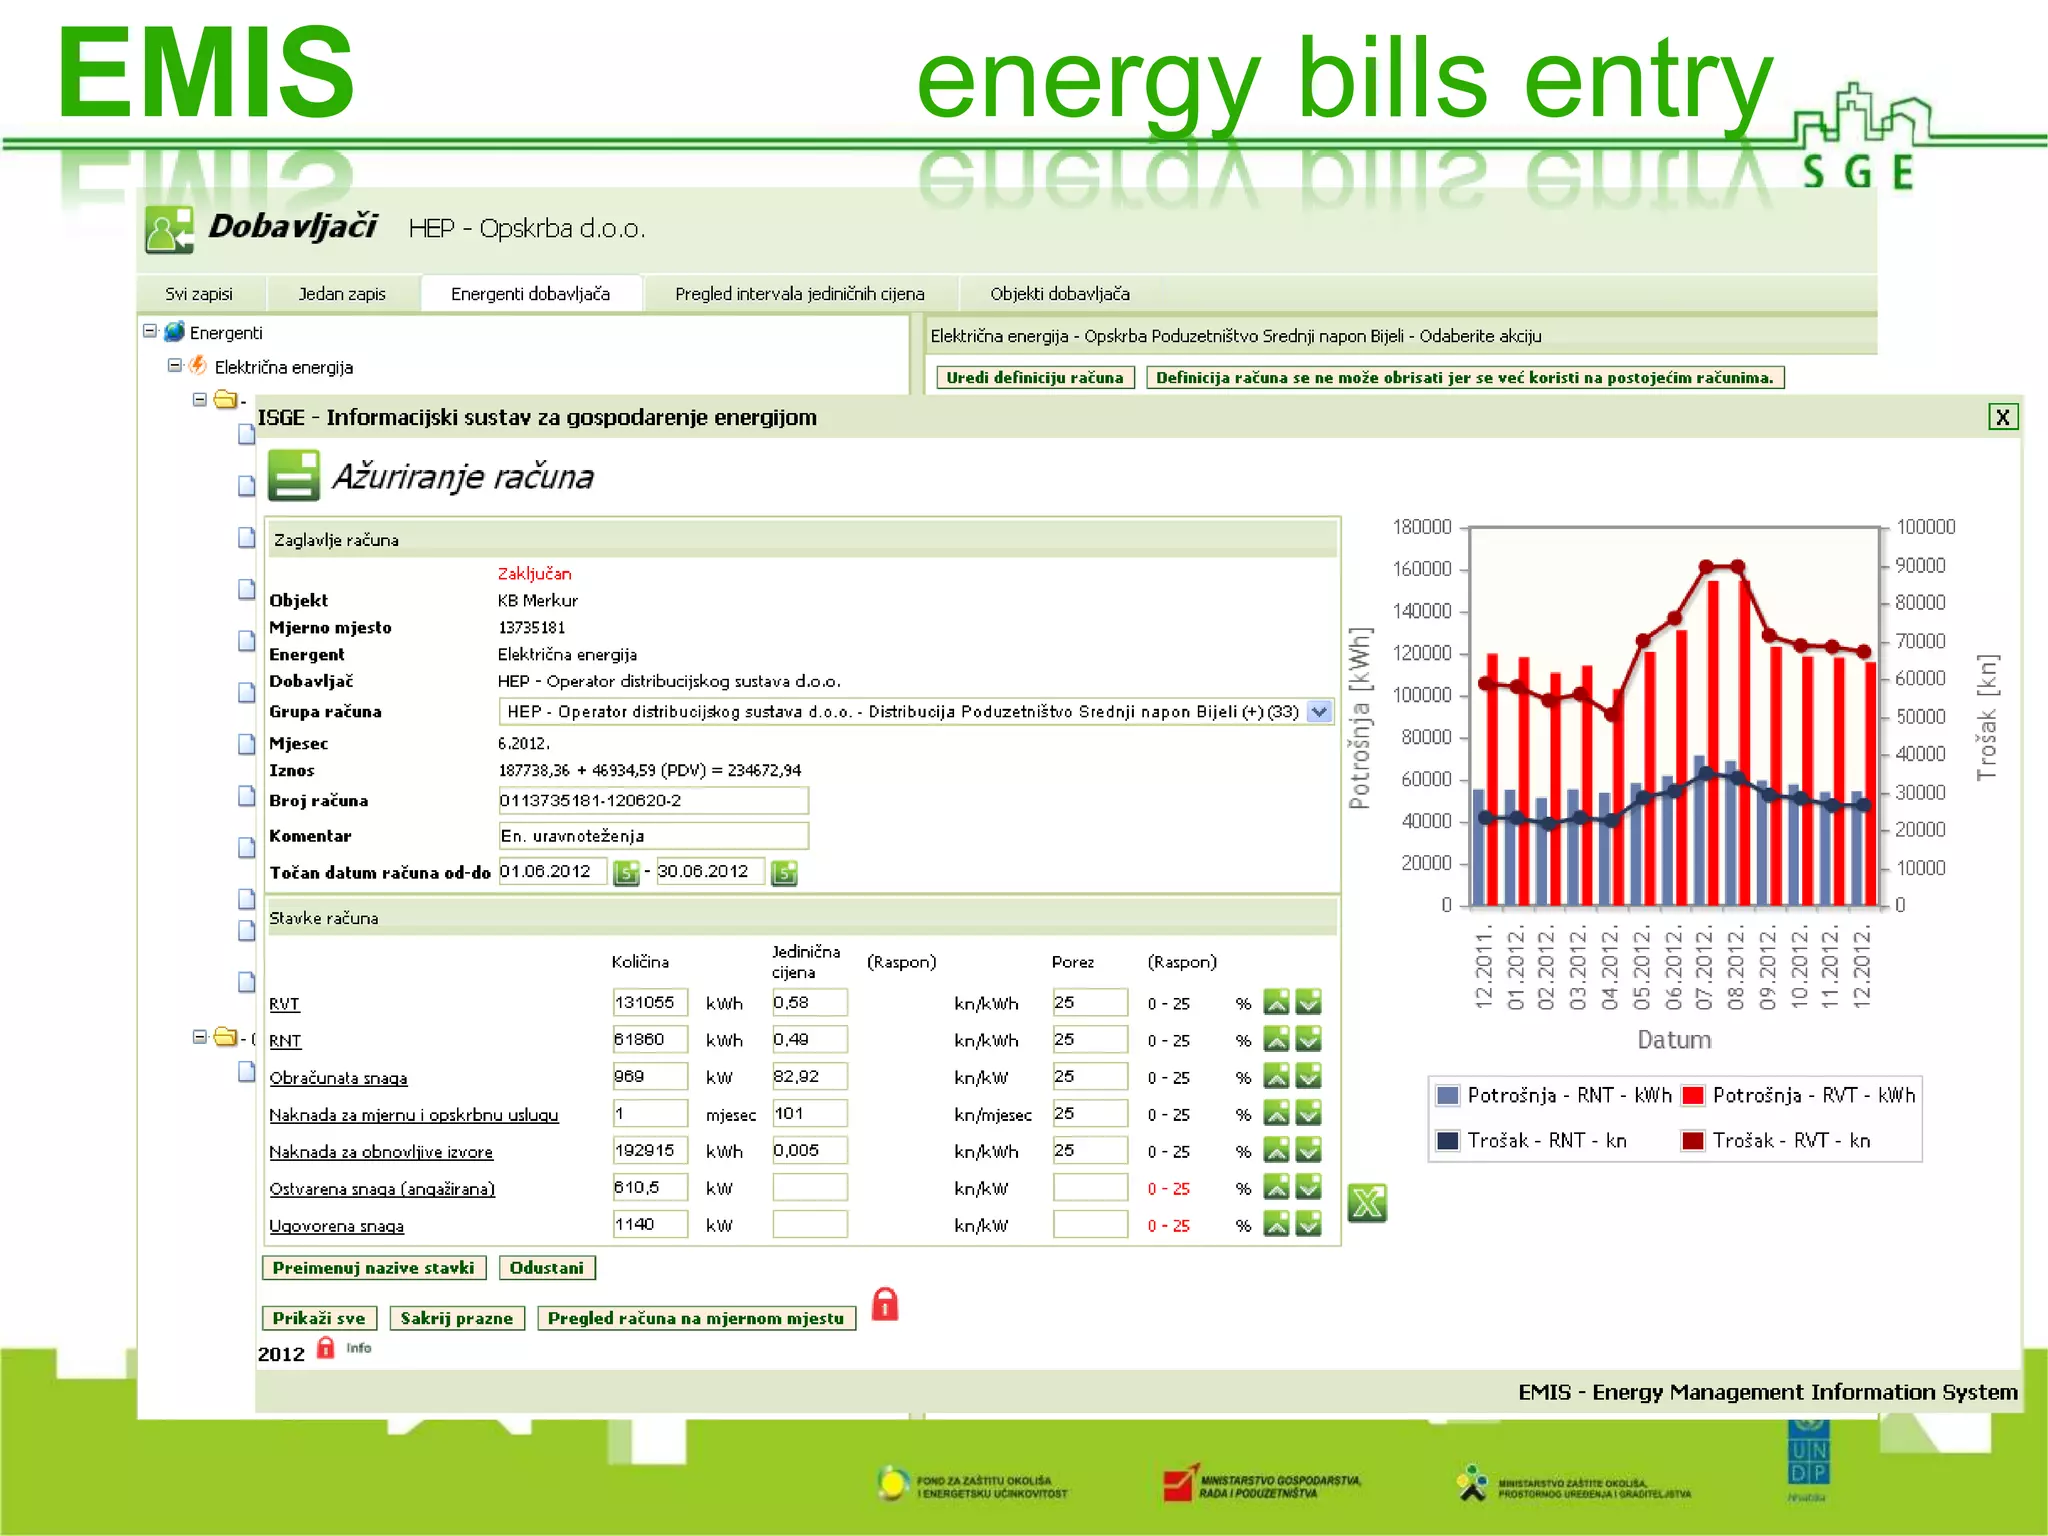
- EMIS tracks over 1.5 million energy bills and 400,000 water bills annually. It collects over 10 million meter readings including 9 million automatic readings.
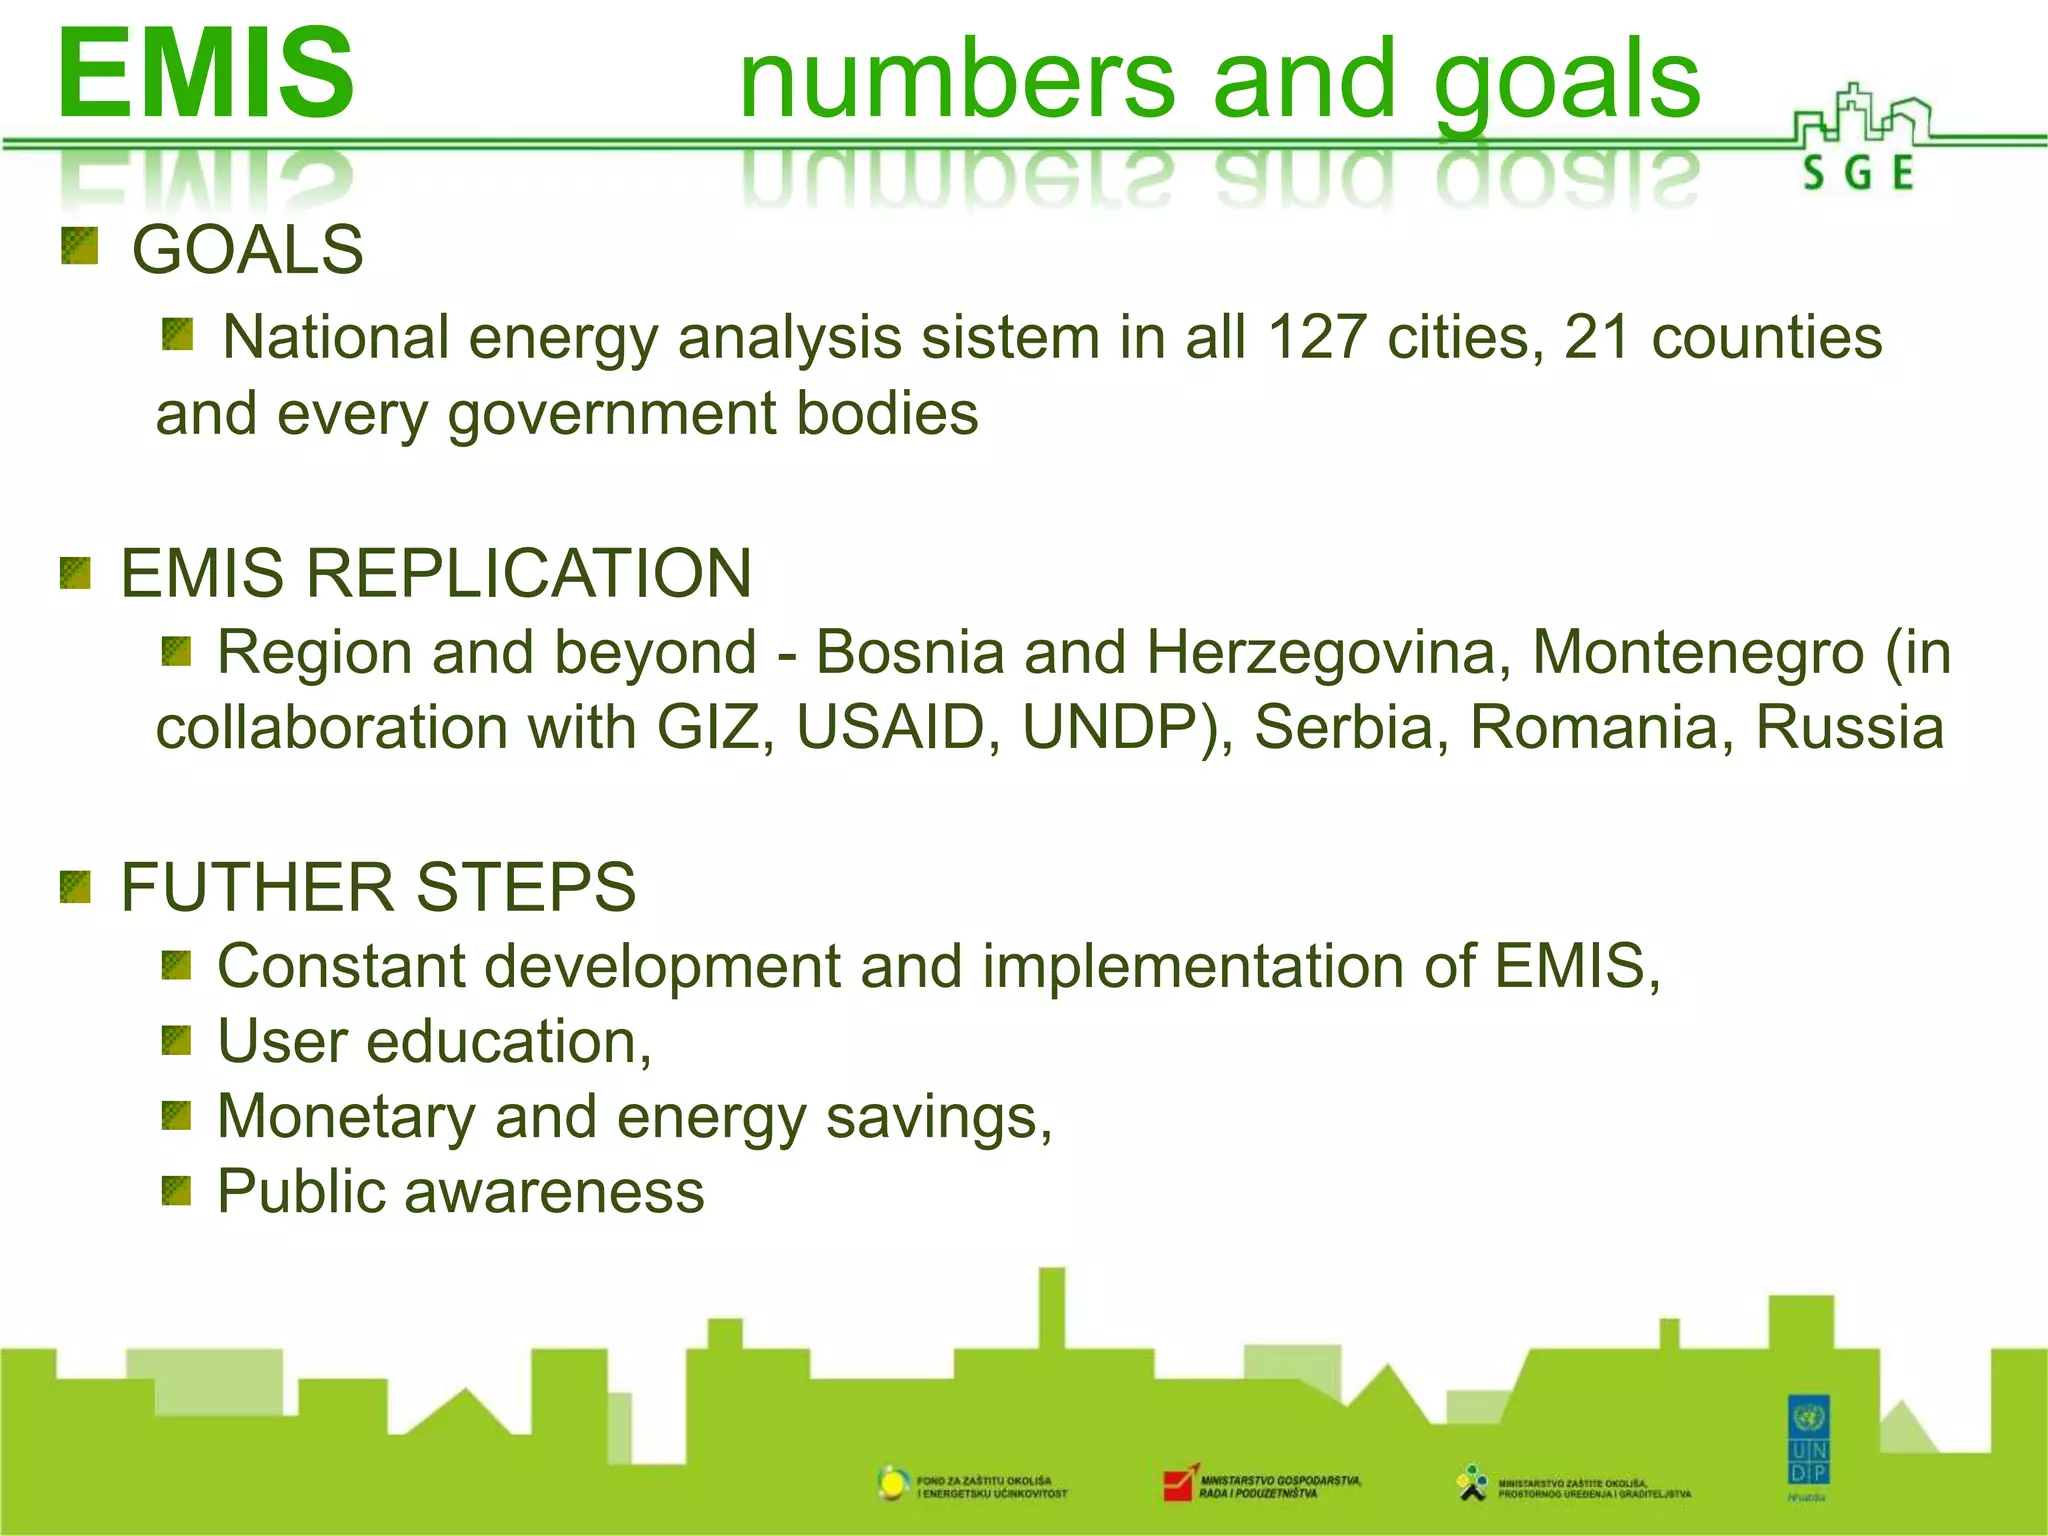
- The system aims to eventually cover all public buildings
![Naziv energenta Godina Izračunata količina [m³] Broj zaključanih računaKoličina [m³] / broj računa
Voda 2007 7443351,919 30463 244,341
Voda 2008 8588021,257 34961 245,646
Voda 2009 8772991,439 35594 246,474
Voda 2010 8755596,769 38348 228,320
Voda 2011 8385436,342 41754 200,830
Voda 2012 5637104,380 34041 165,597
Naziv energenta Godina Izračunata količina [kWh] Broj zaključanih računaKoličina [kWh] / broj računa
Električna energija 2007 286739368,645 42170 6799,606
Električna energija 2008 382219074,600 51544 7415,394
Električna energija 2009 403819055,630 69738 5790,517
Električna energija 2010 429613646,351 93957 4572,450
Električna energija 2011 398470429,940 97285 4095,908
Električna energija 2012 309890233,240 75157 4123,238
70
%
0.000
50.000
100.000
150.000
200.000
250.000
300.000
2007 2008 2009 2010 2011 2012
Voda [m3] / broj zaključanih
računa
0.000
1000.000
2000.000
3000.000
4000.000
5000.000
6000.000
7000.000
8000.000
2007 2008 2009 2010 2011 2012
Električna energija [kWh] / broj
zaključanih računa
EMIS trends](https://image.slidesharecdn.com/apnemisfunctionalities072015-150715091441-lva1-app6891/75/APN_EMIS_Funcionalities_07_2015-21-2048.jpg)