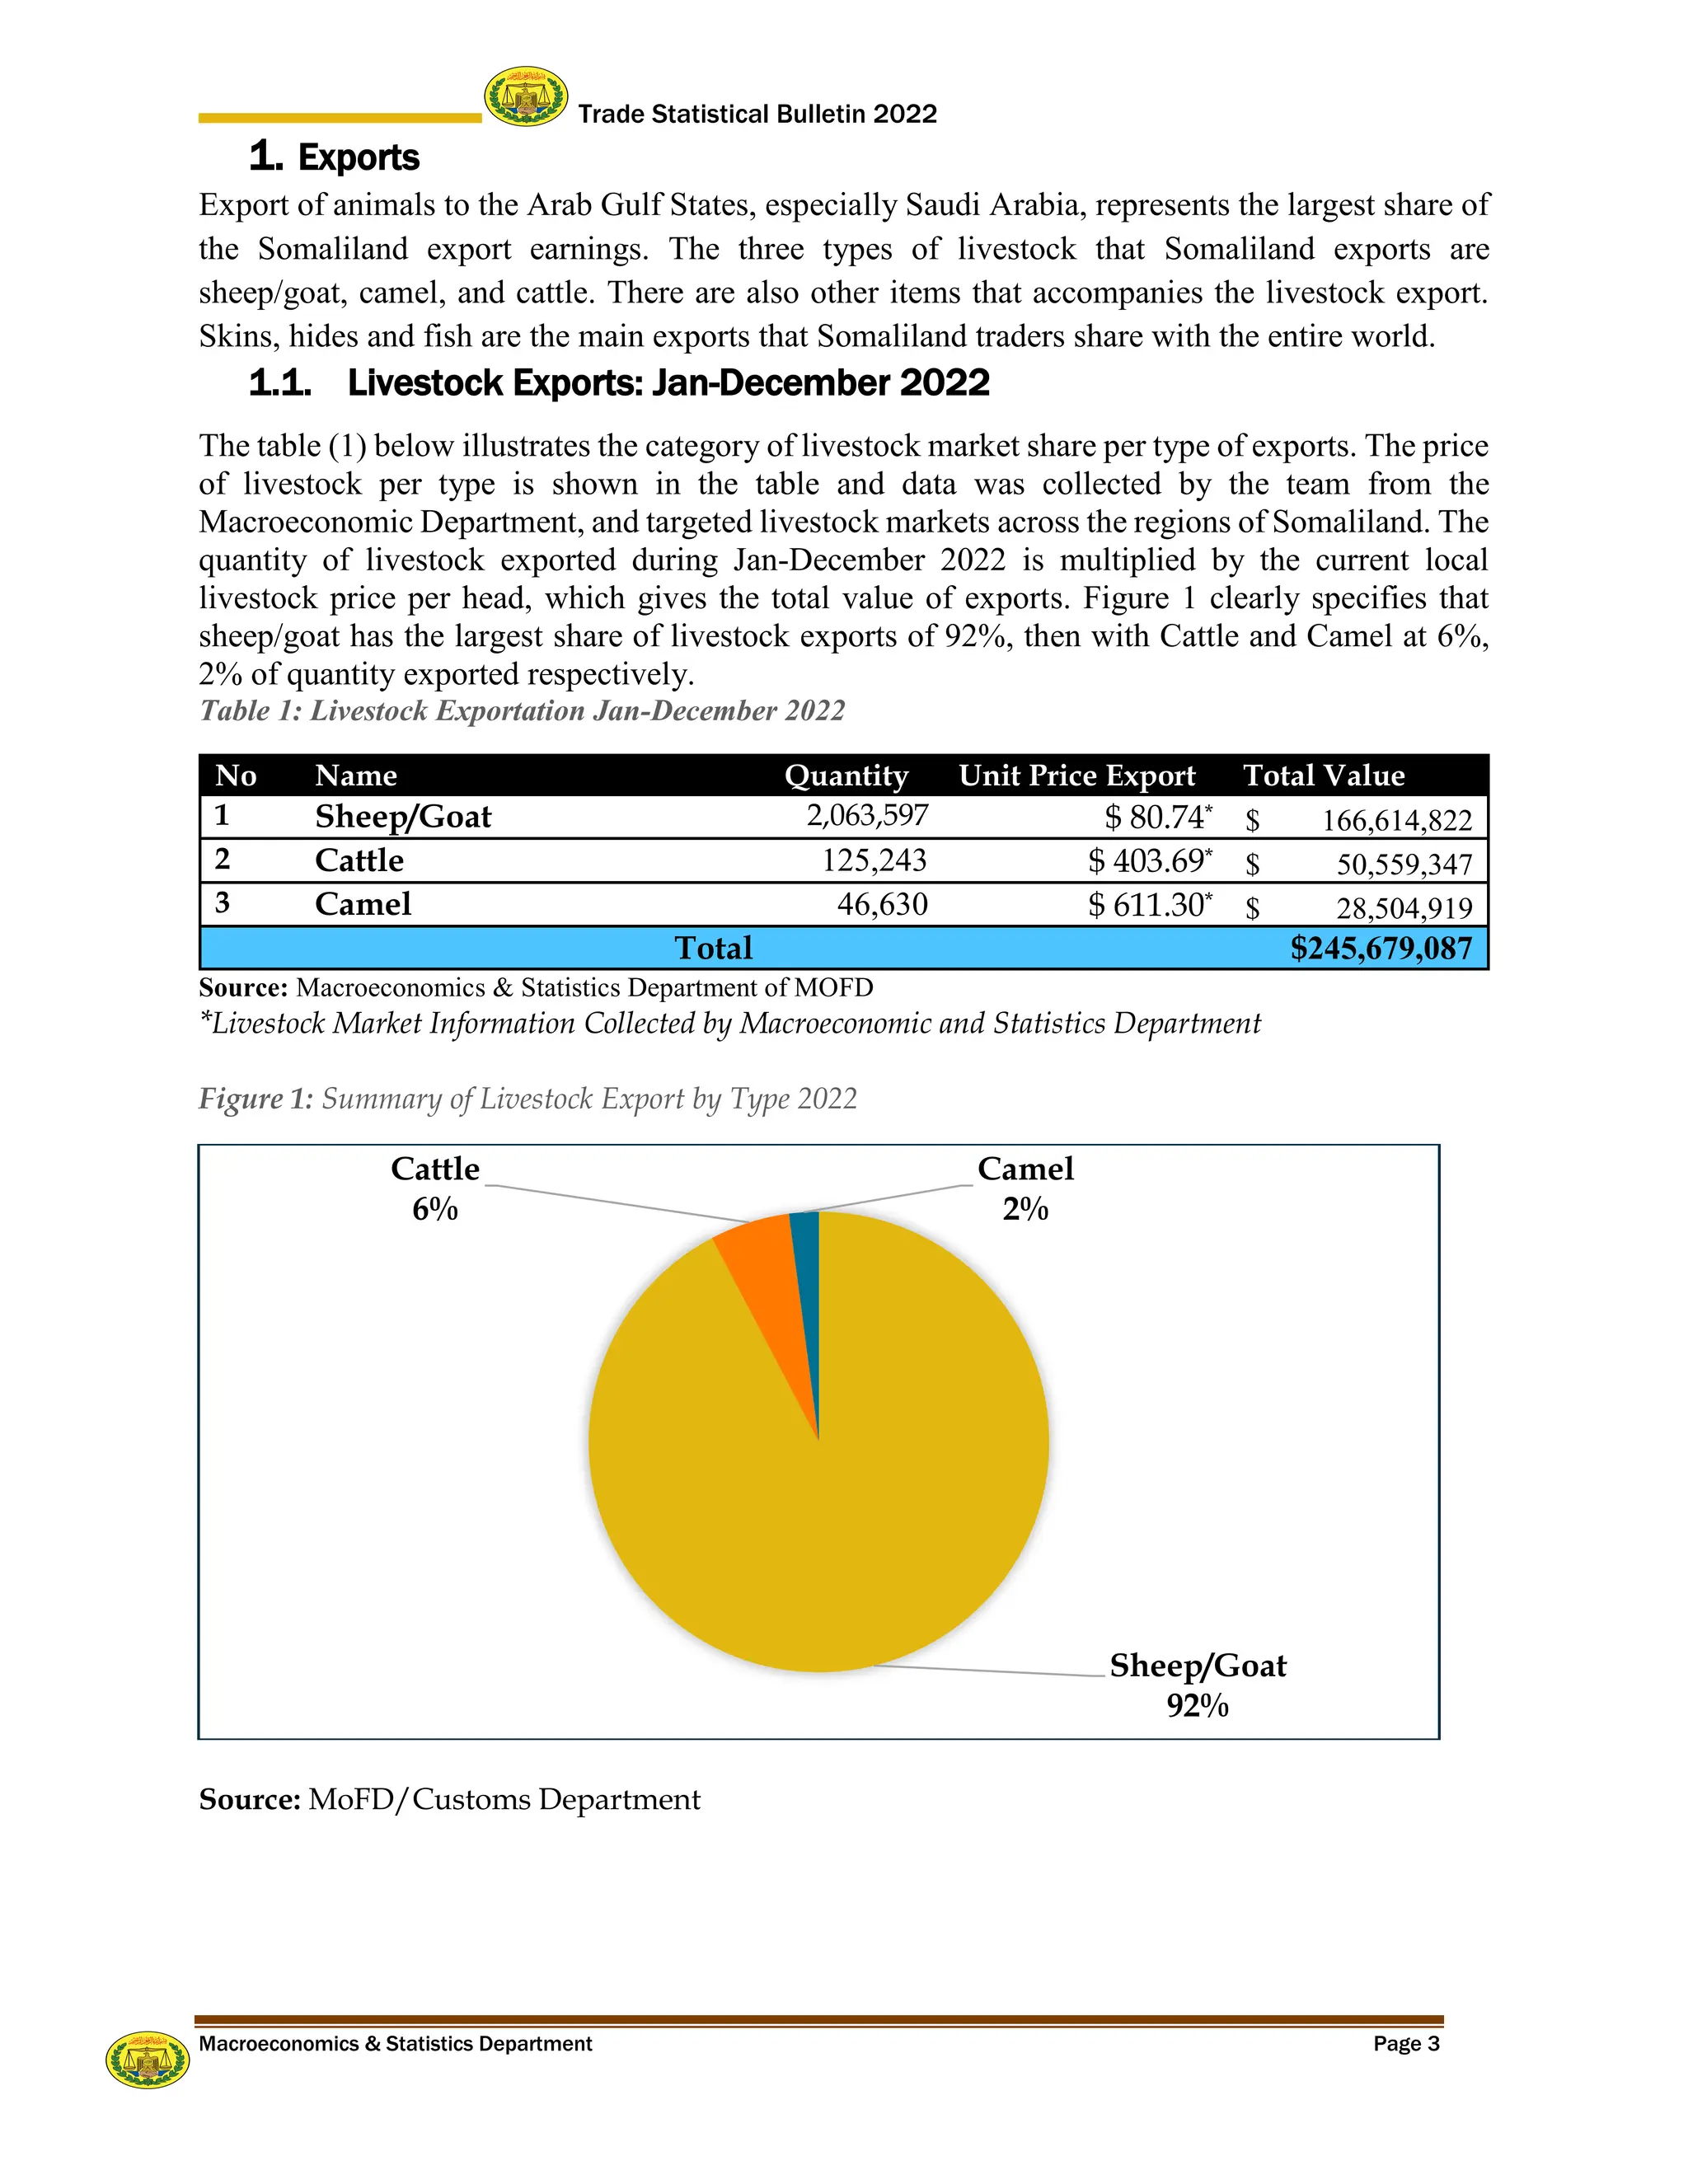
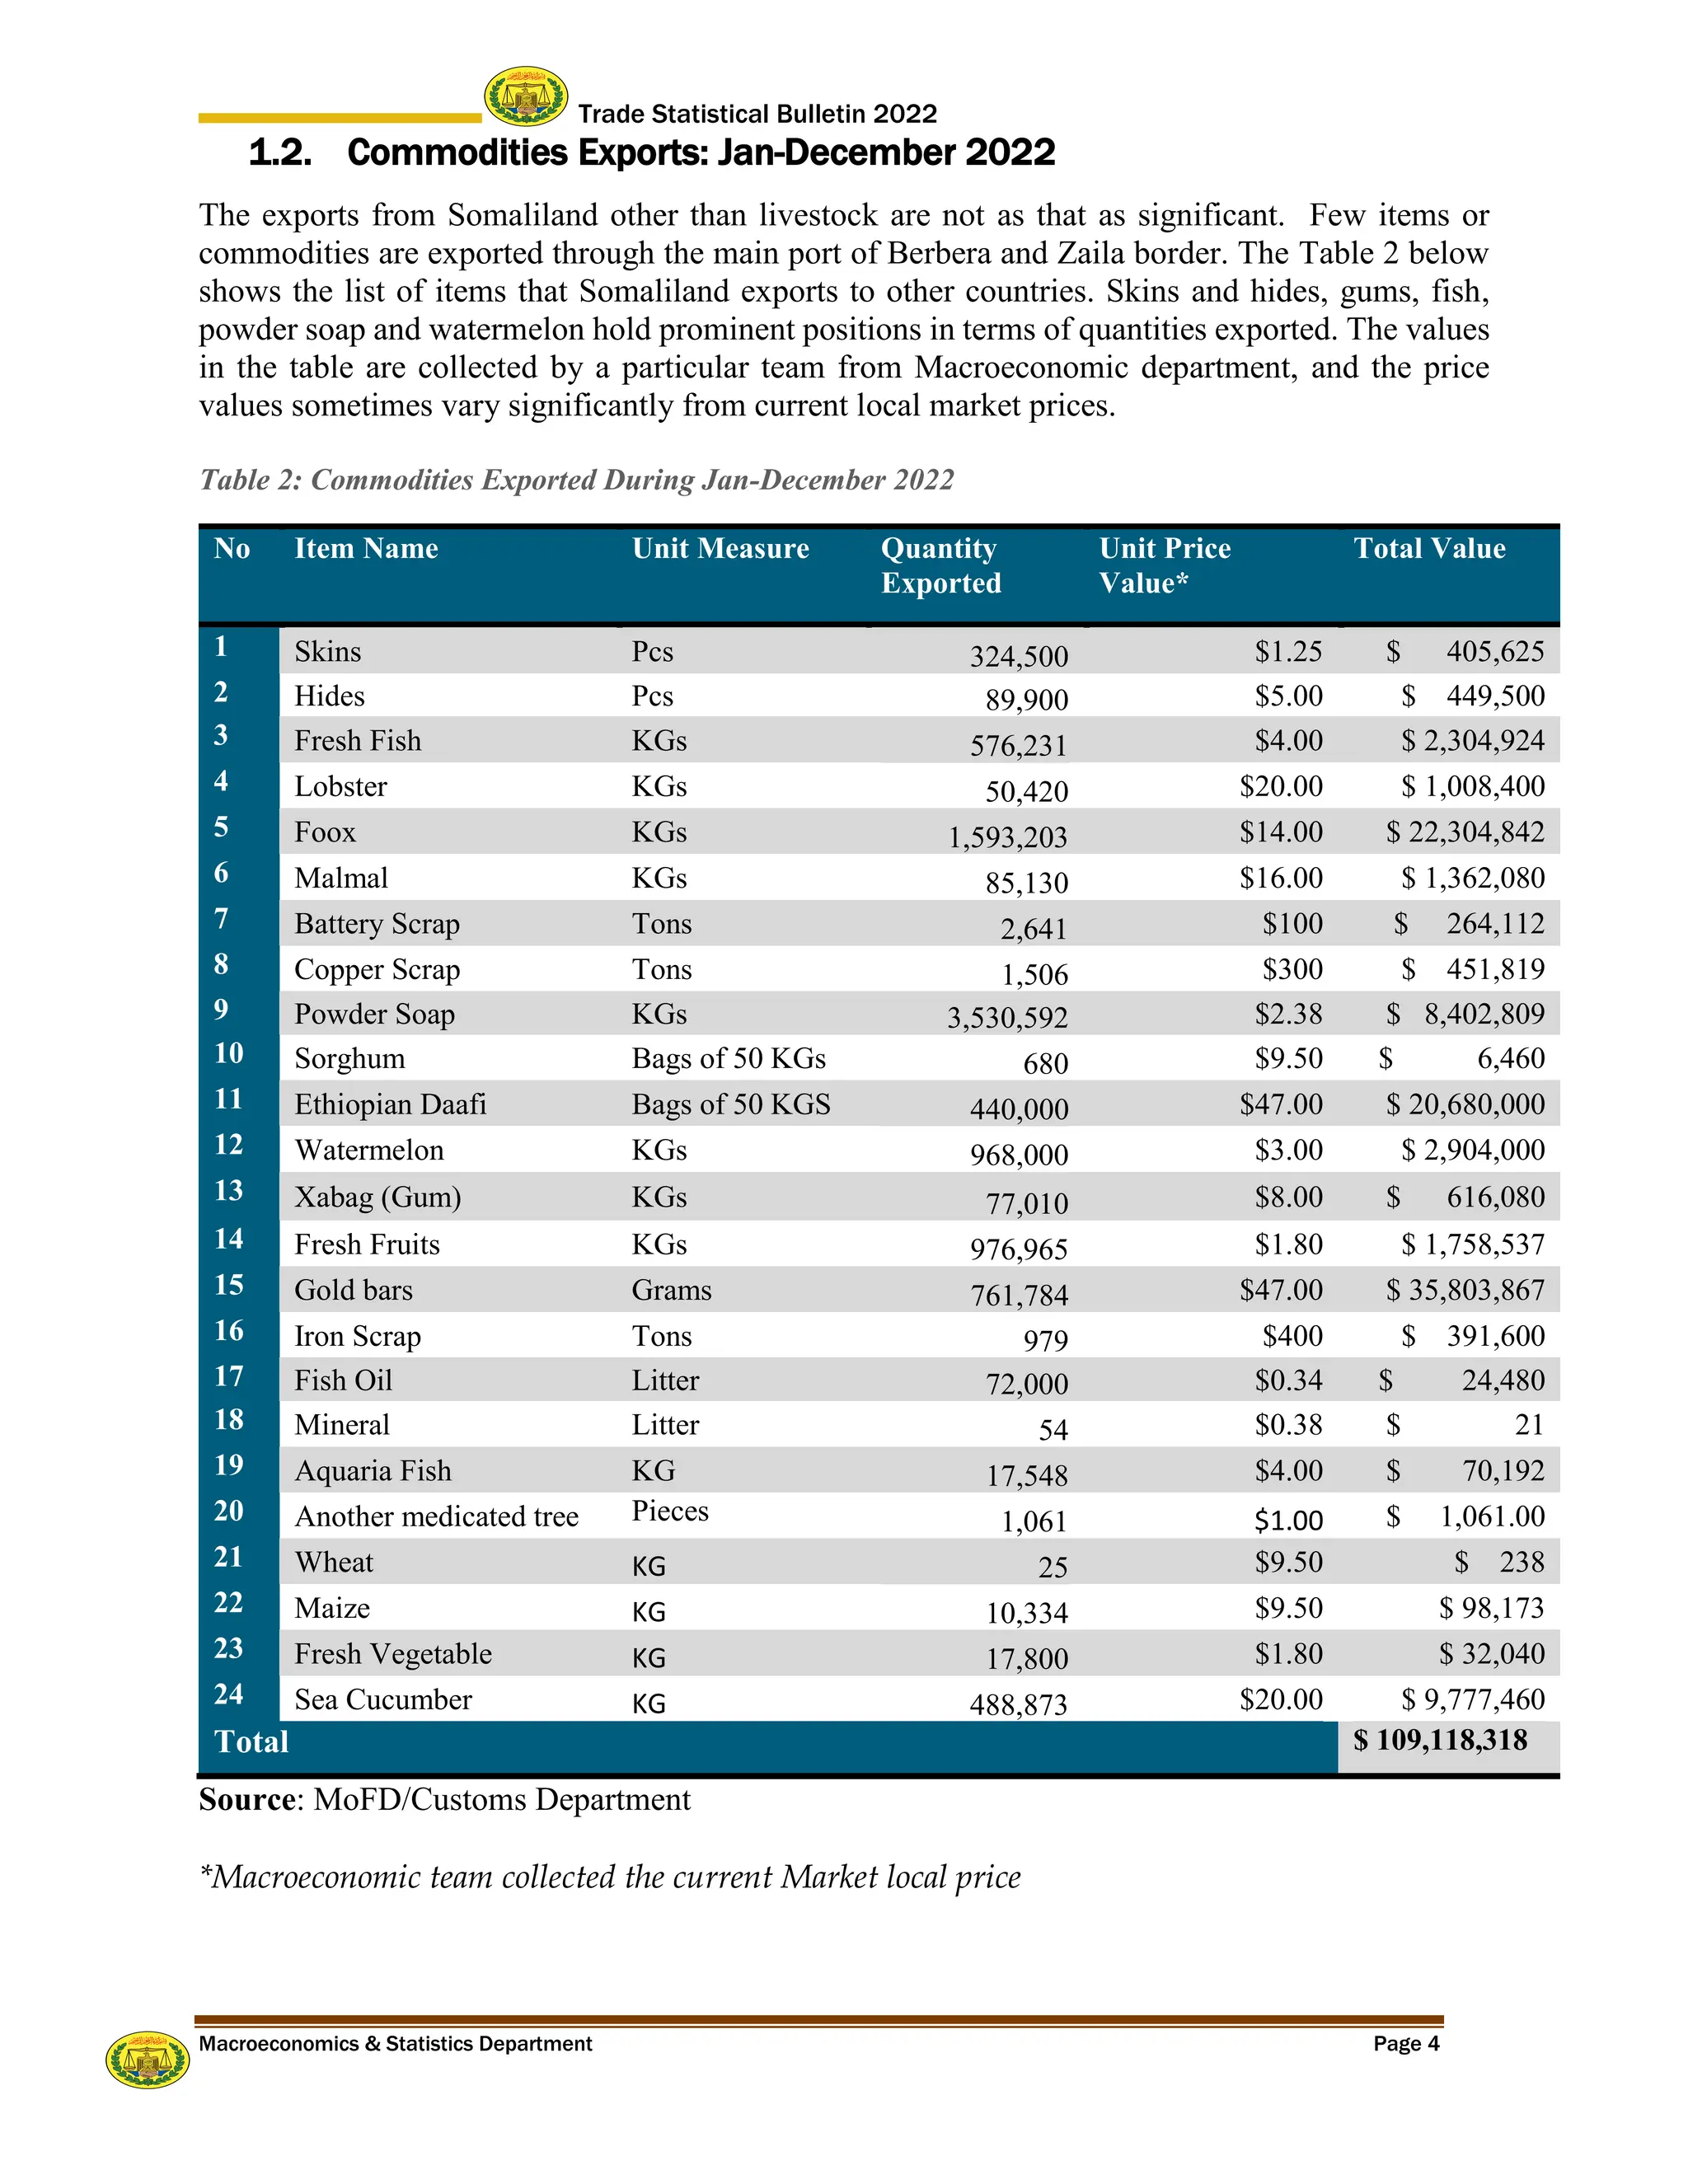
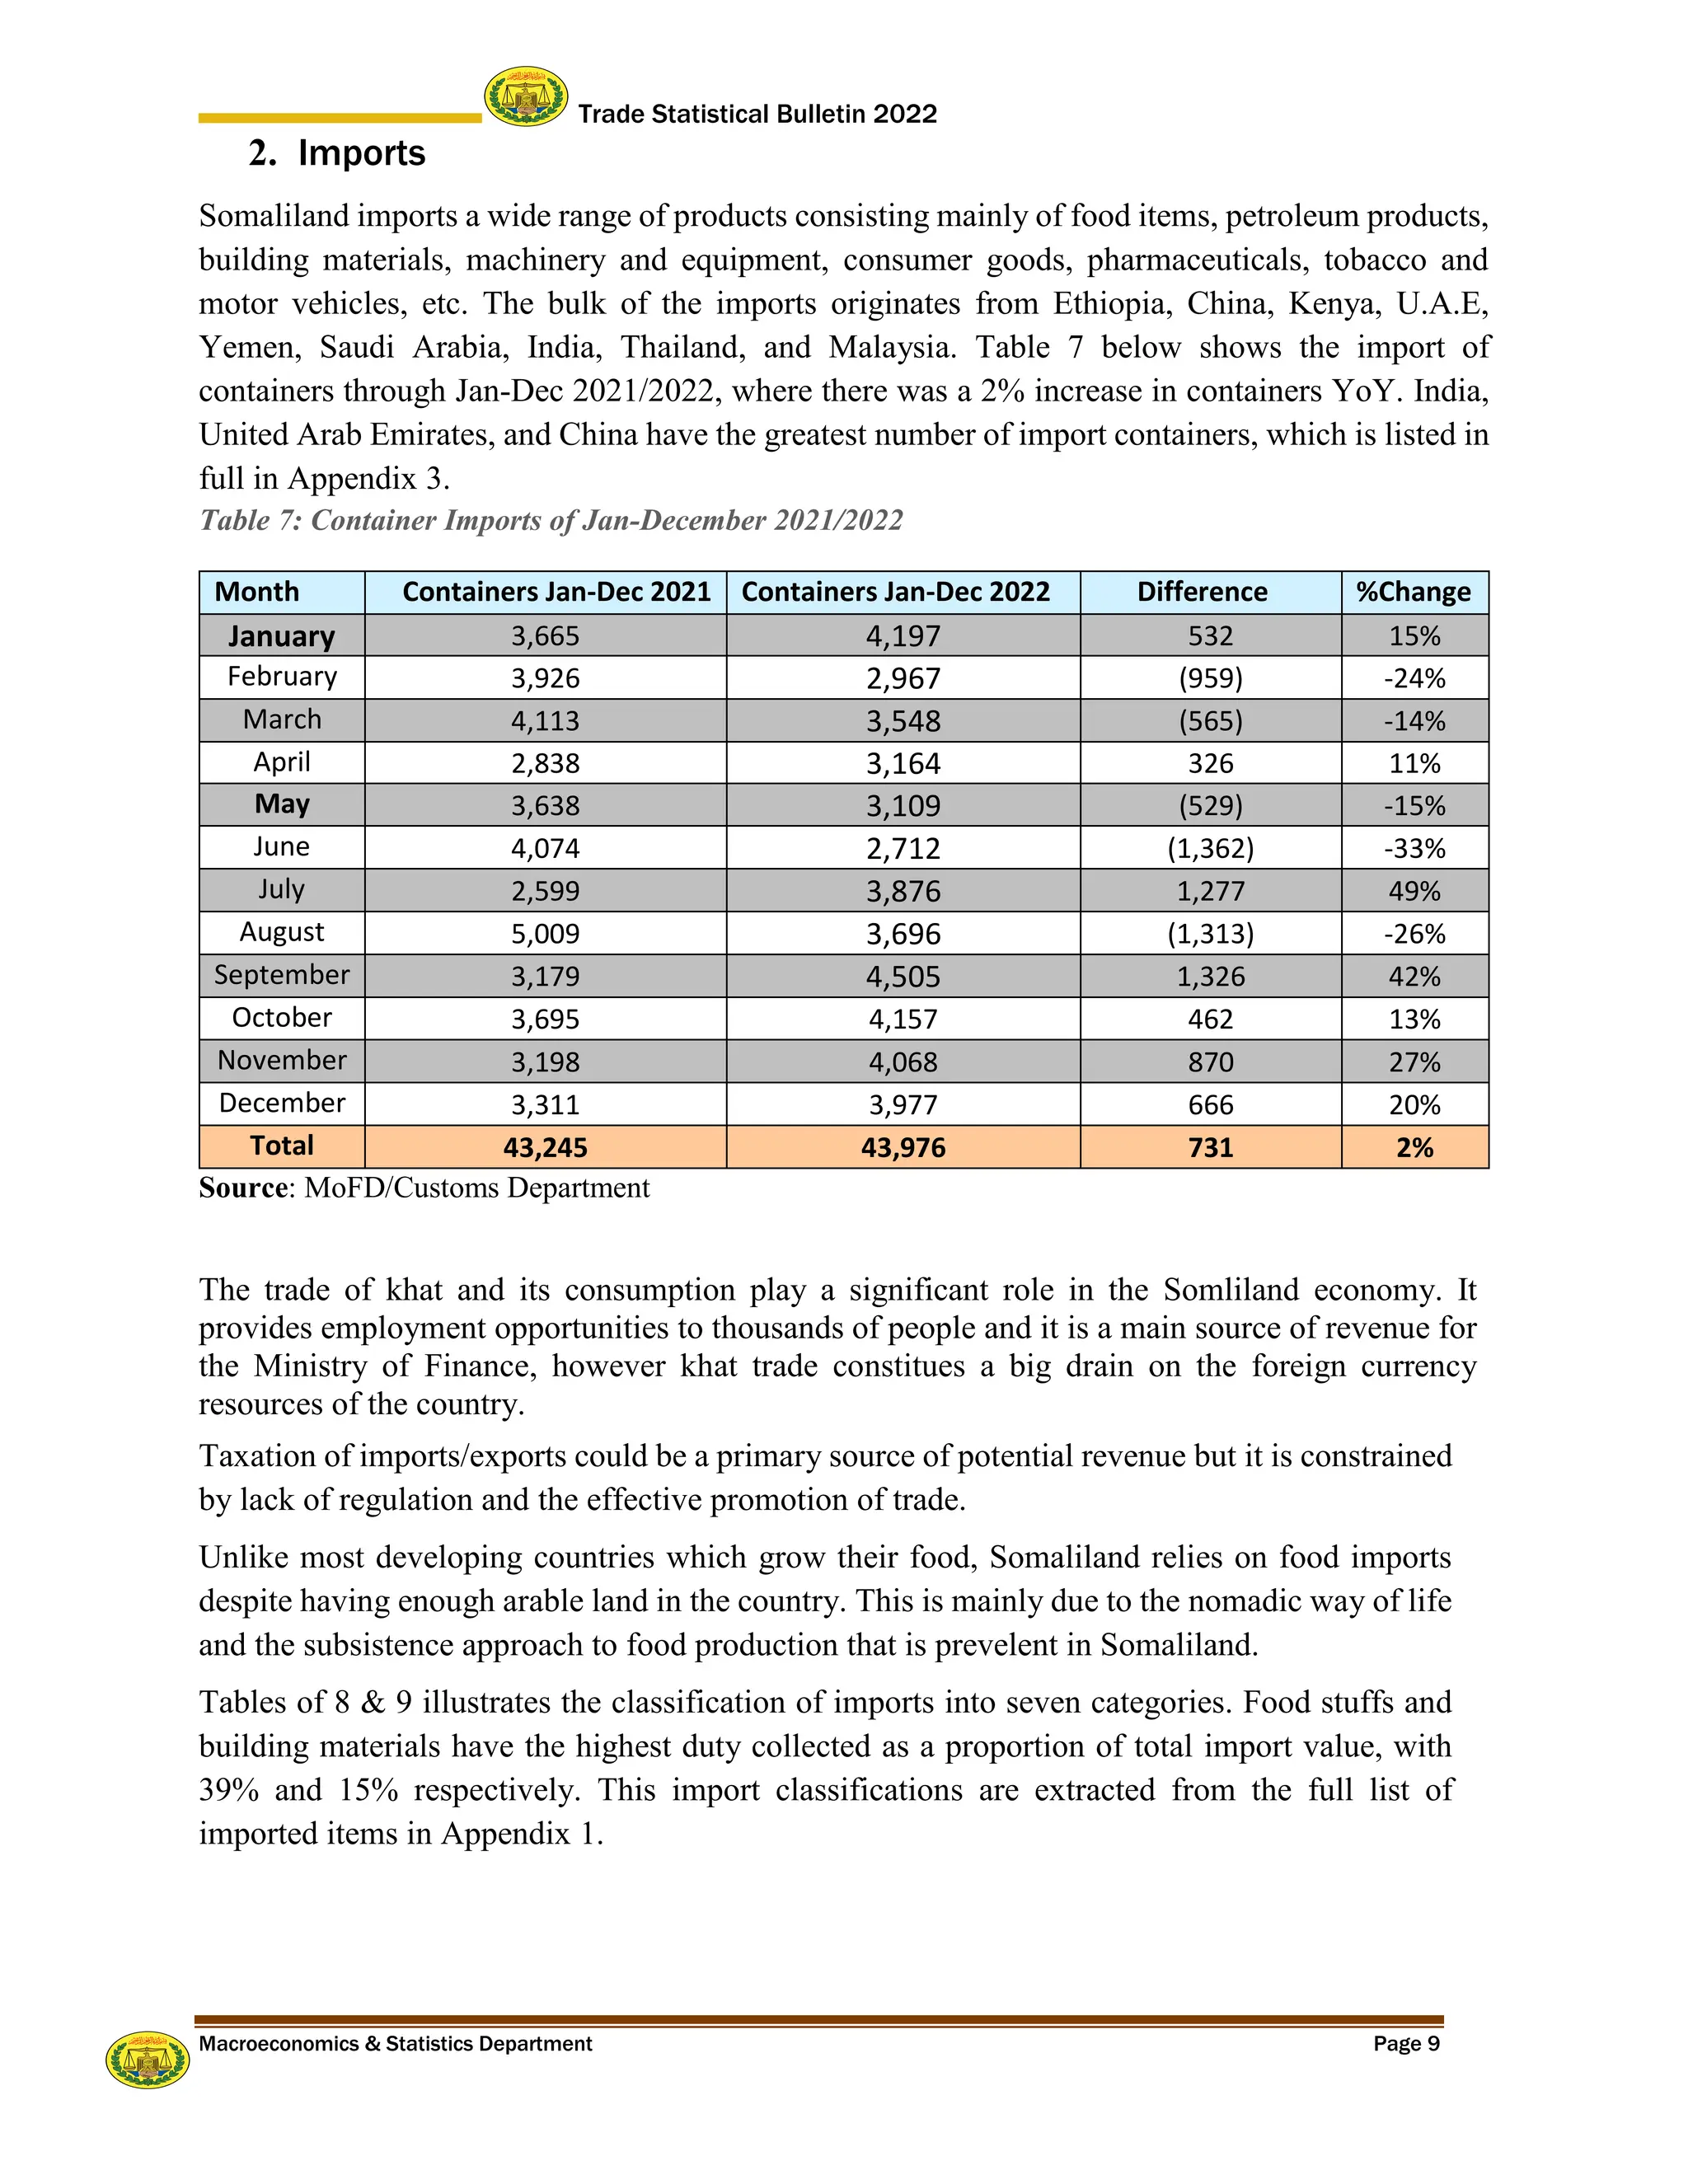
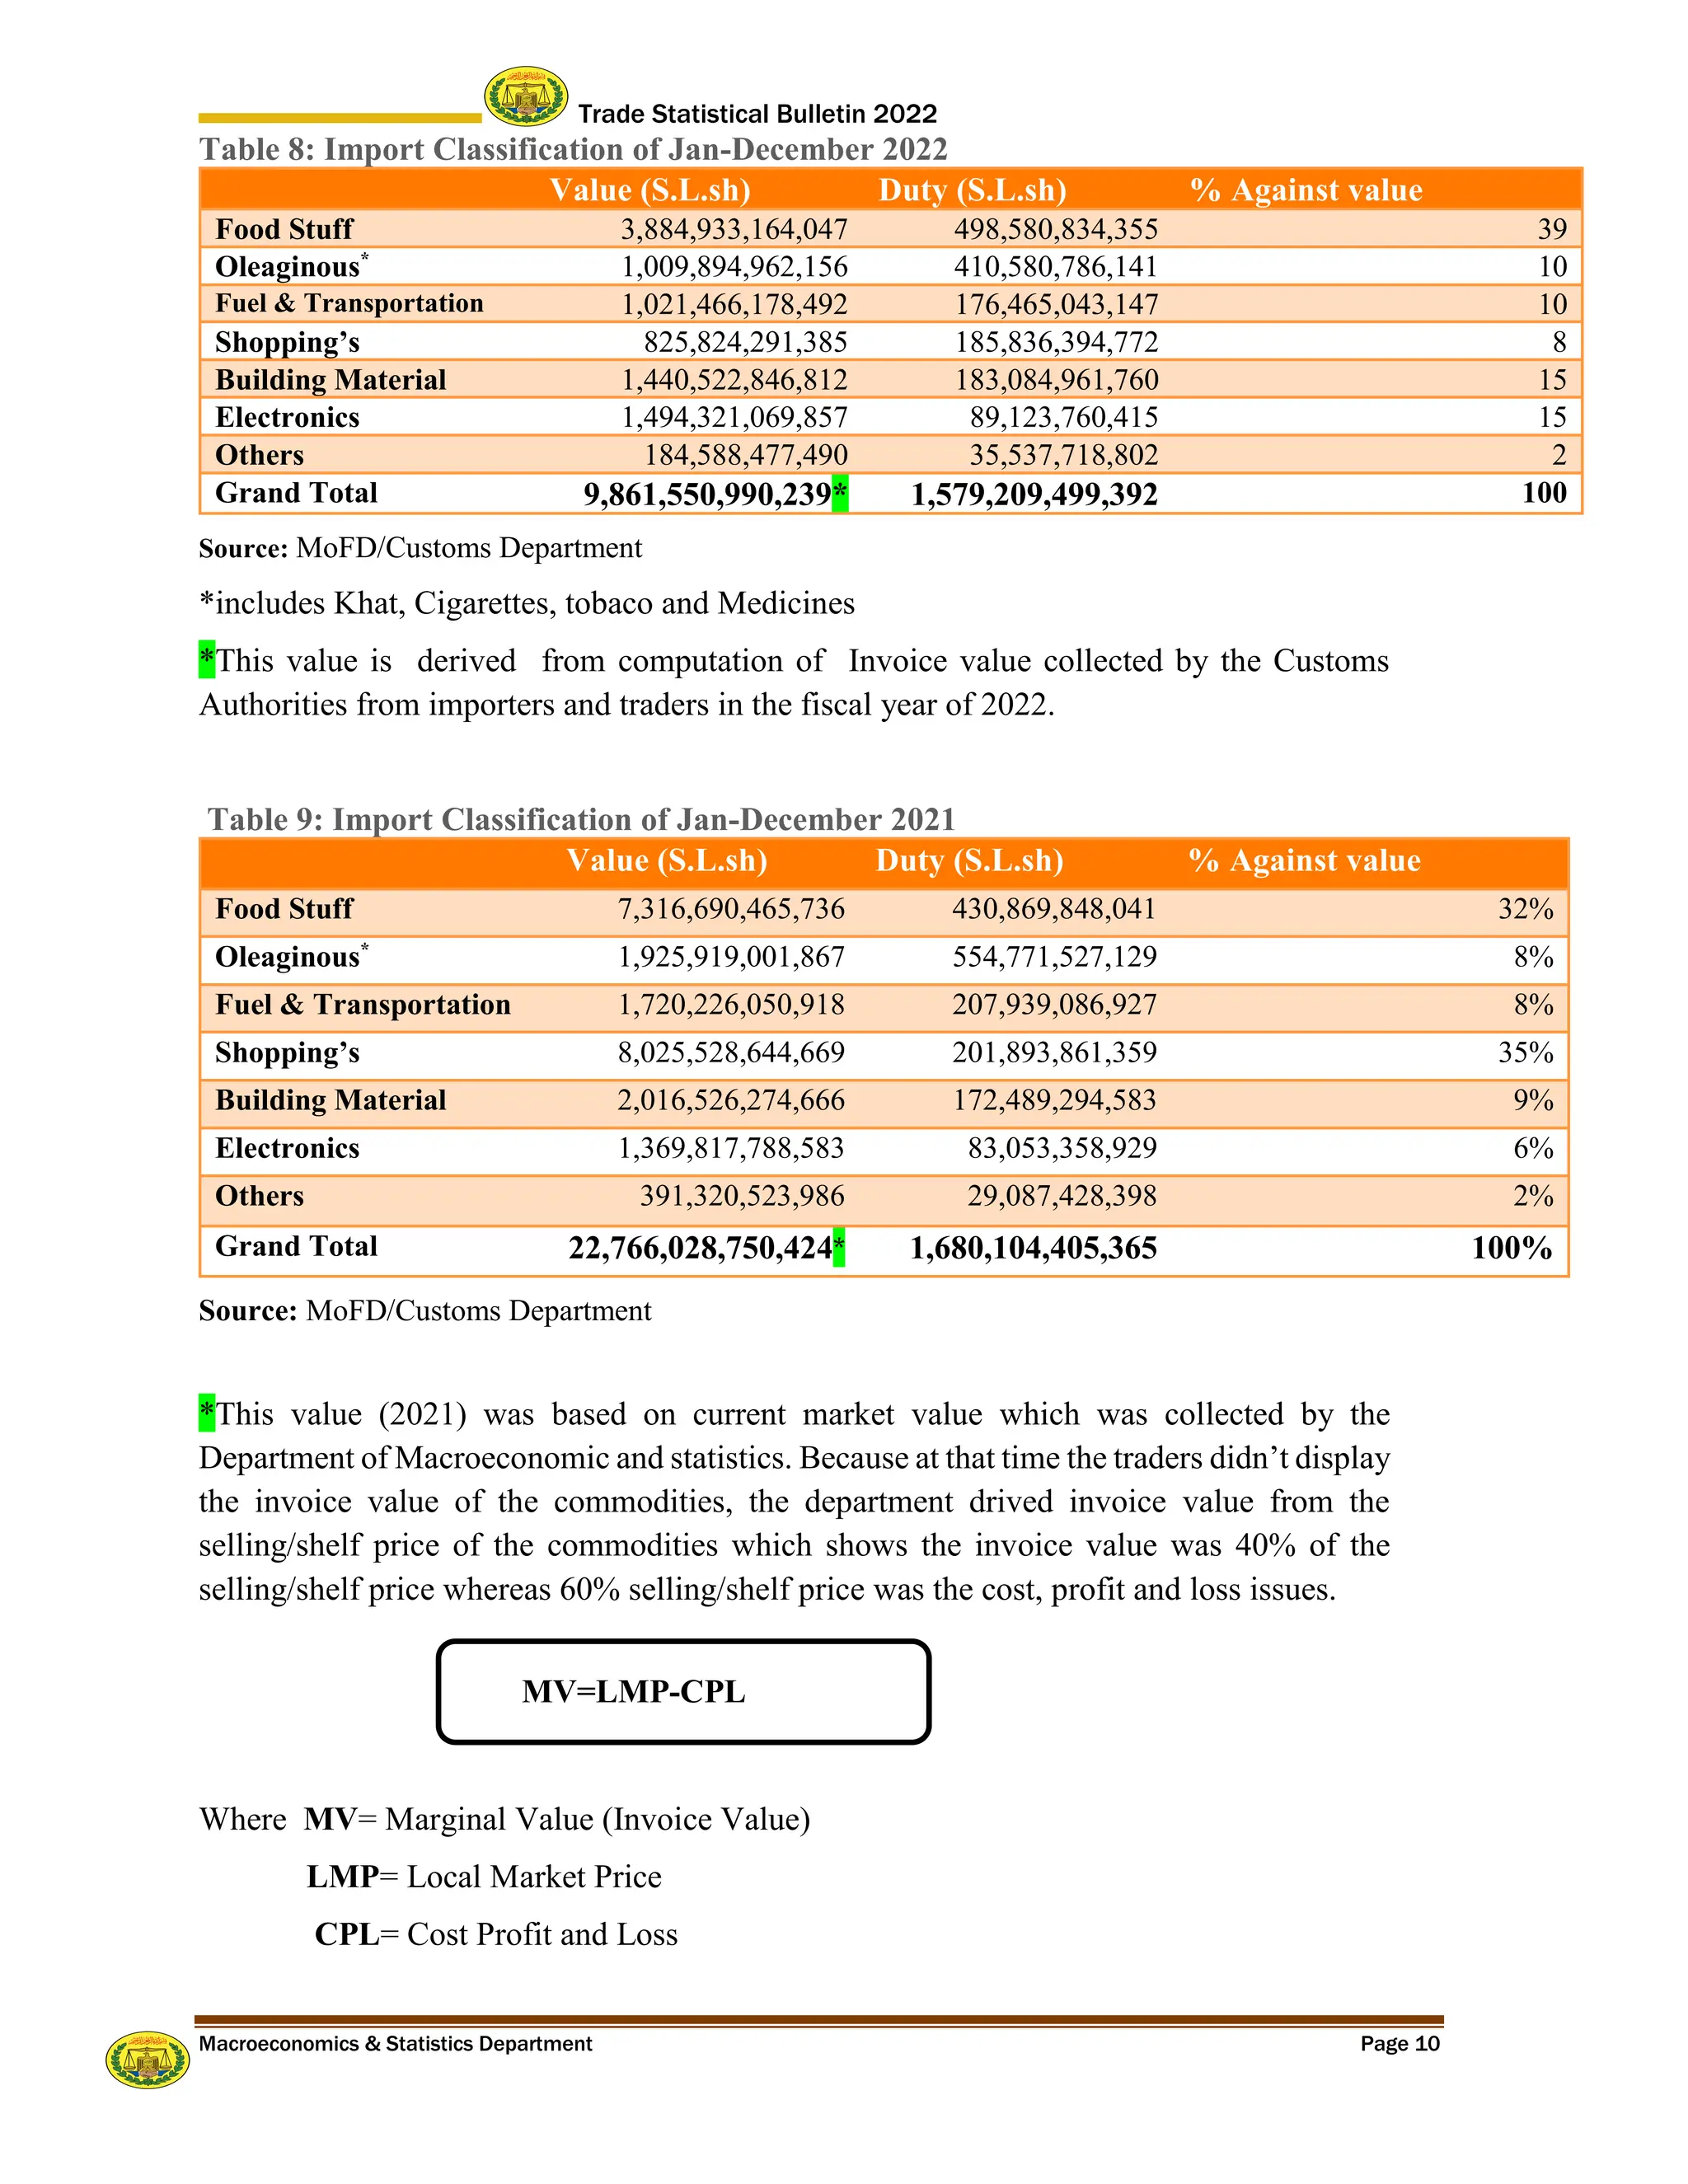
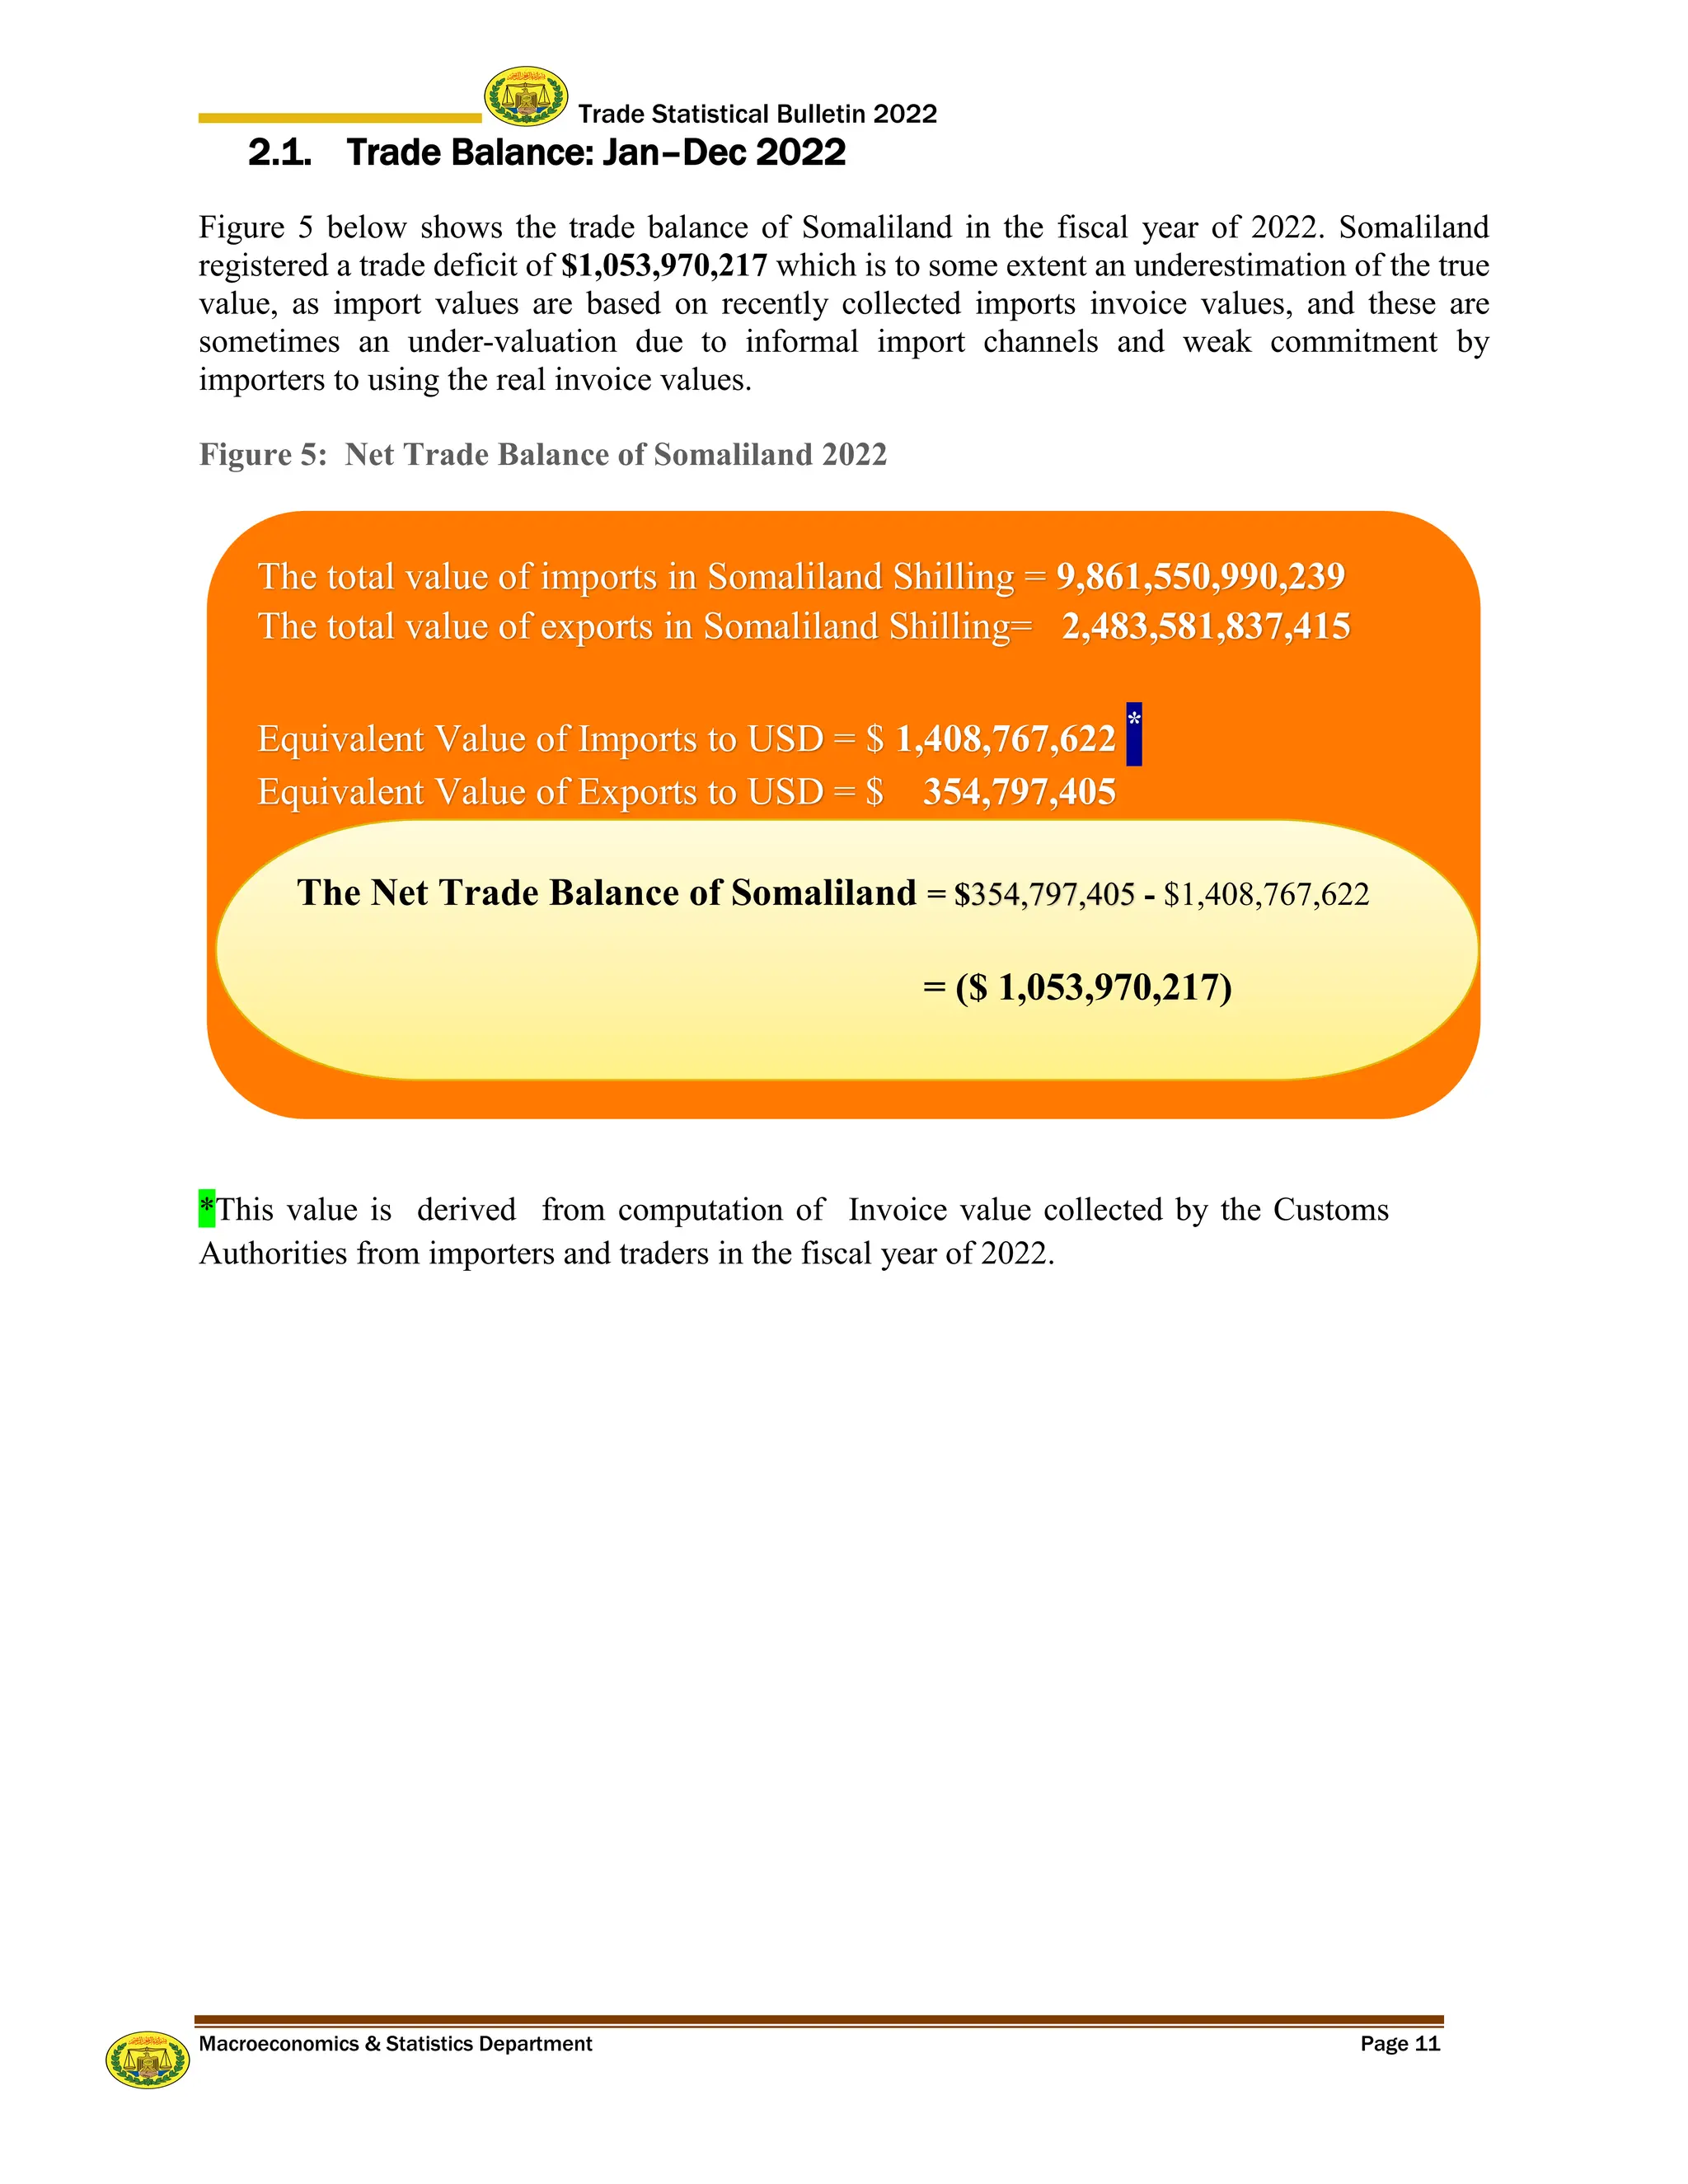
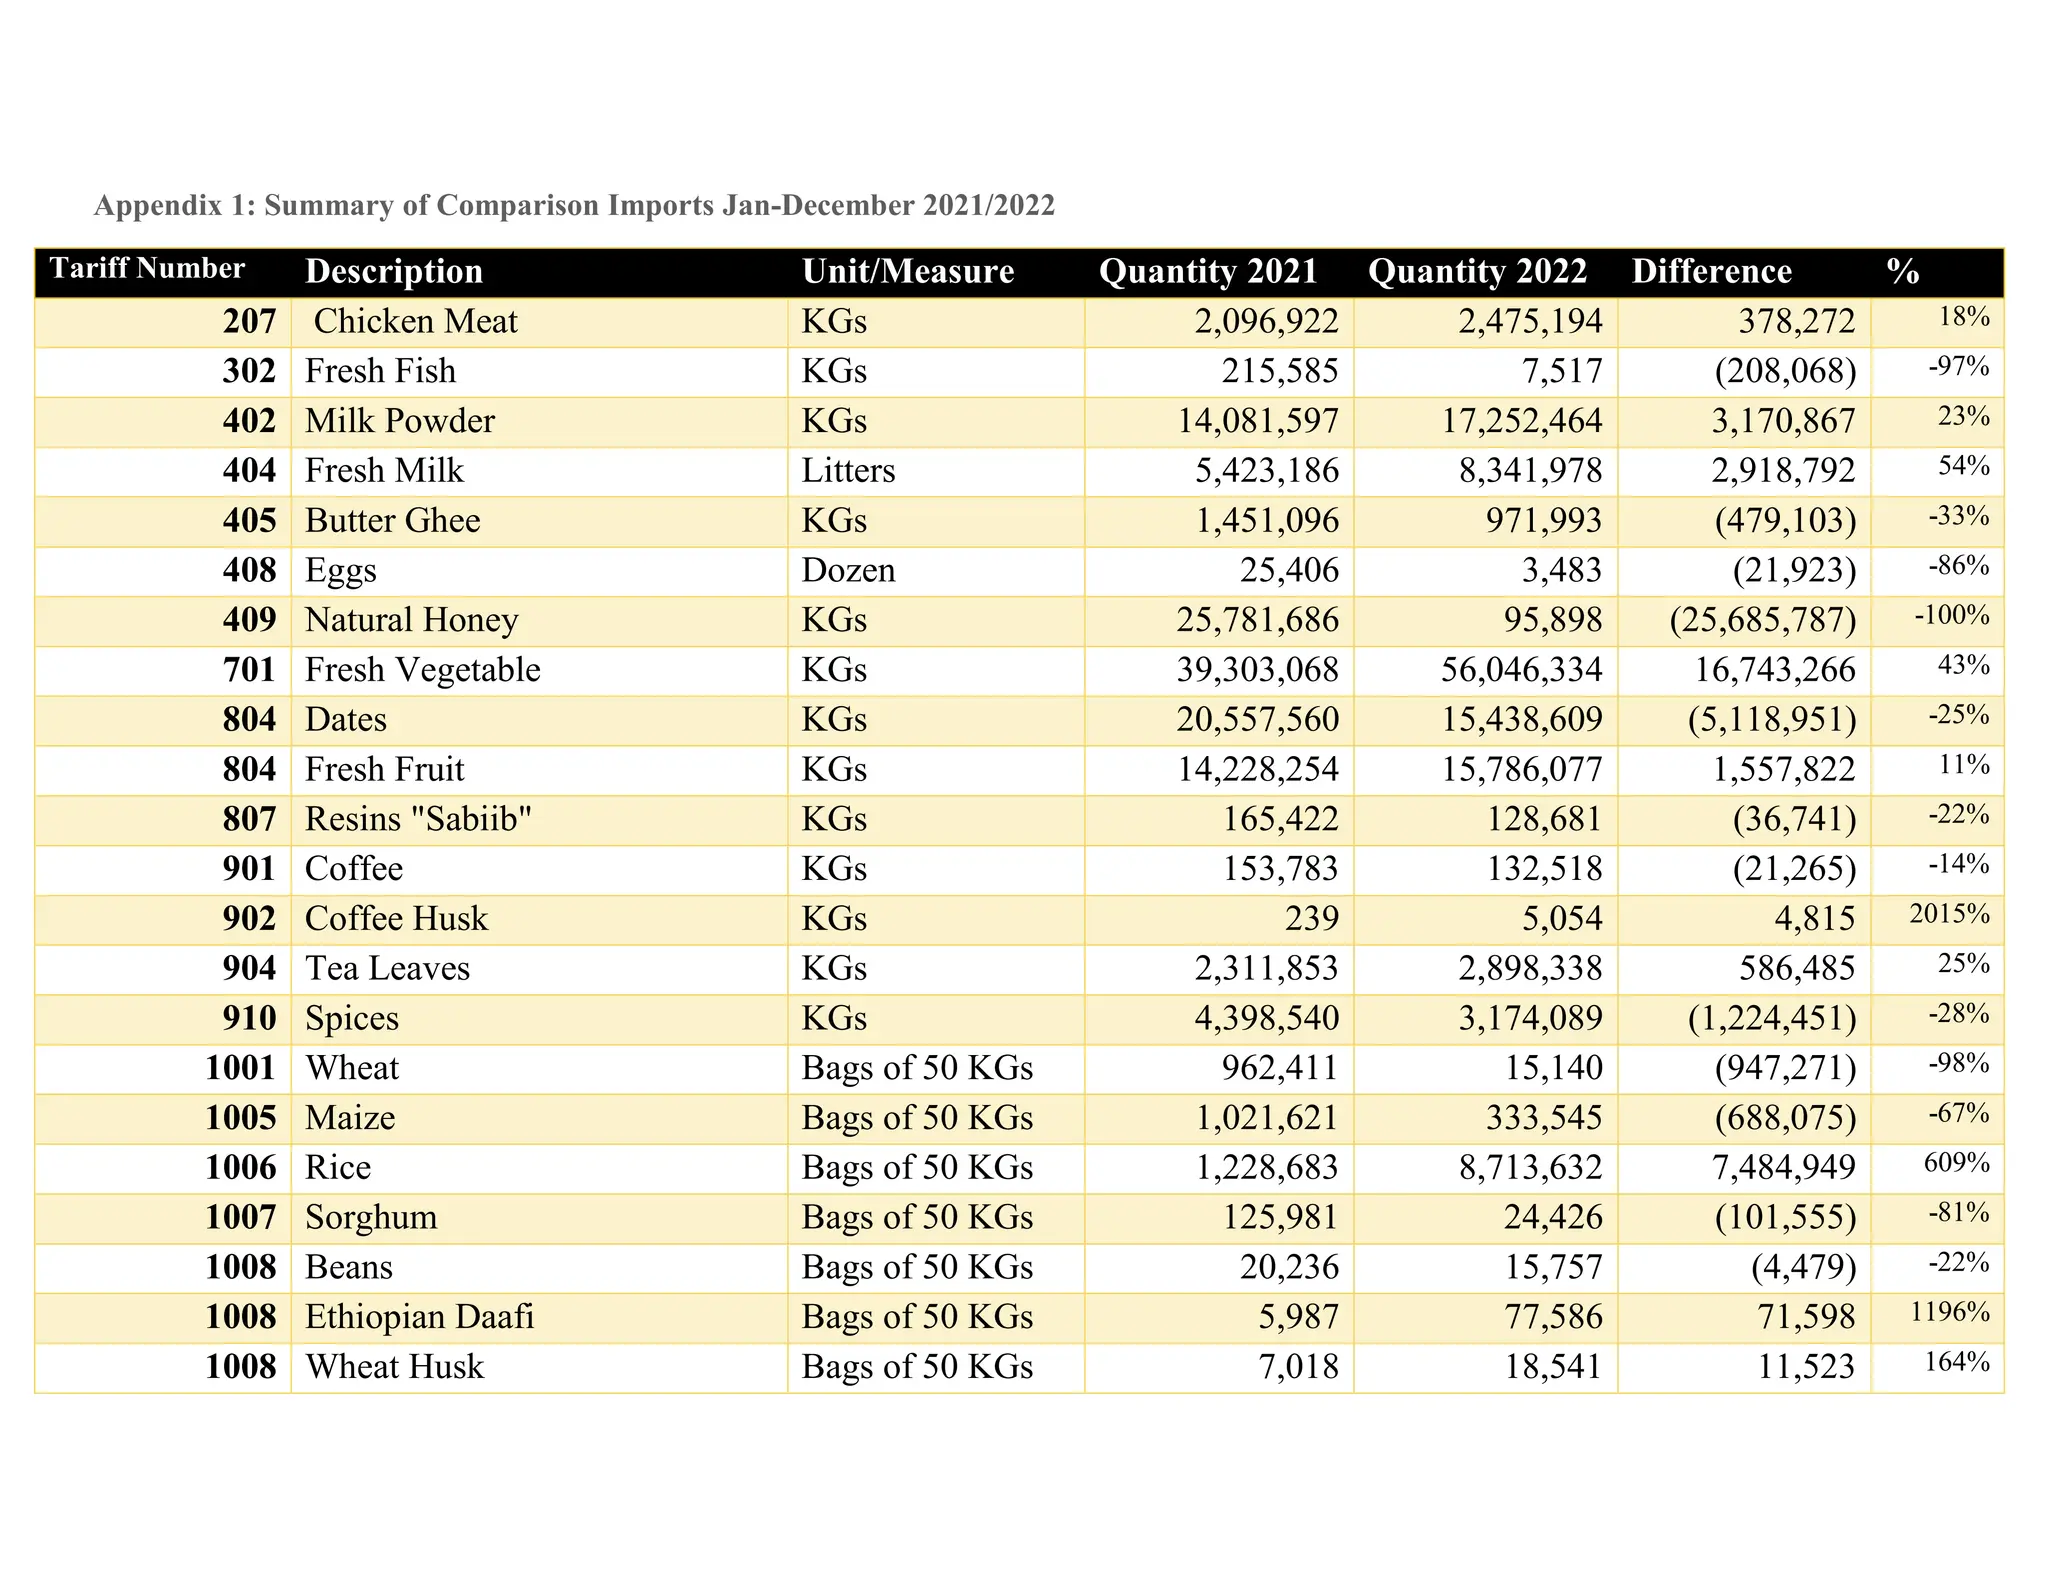
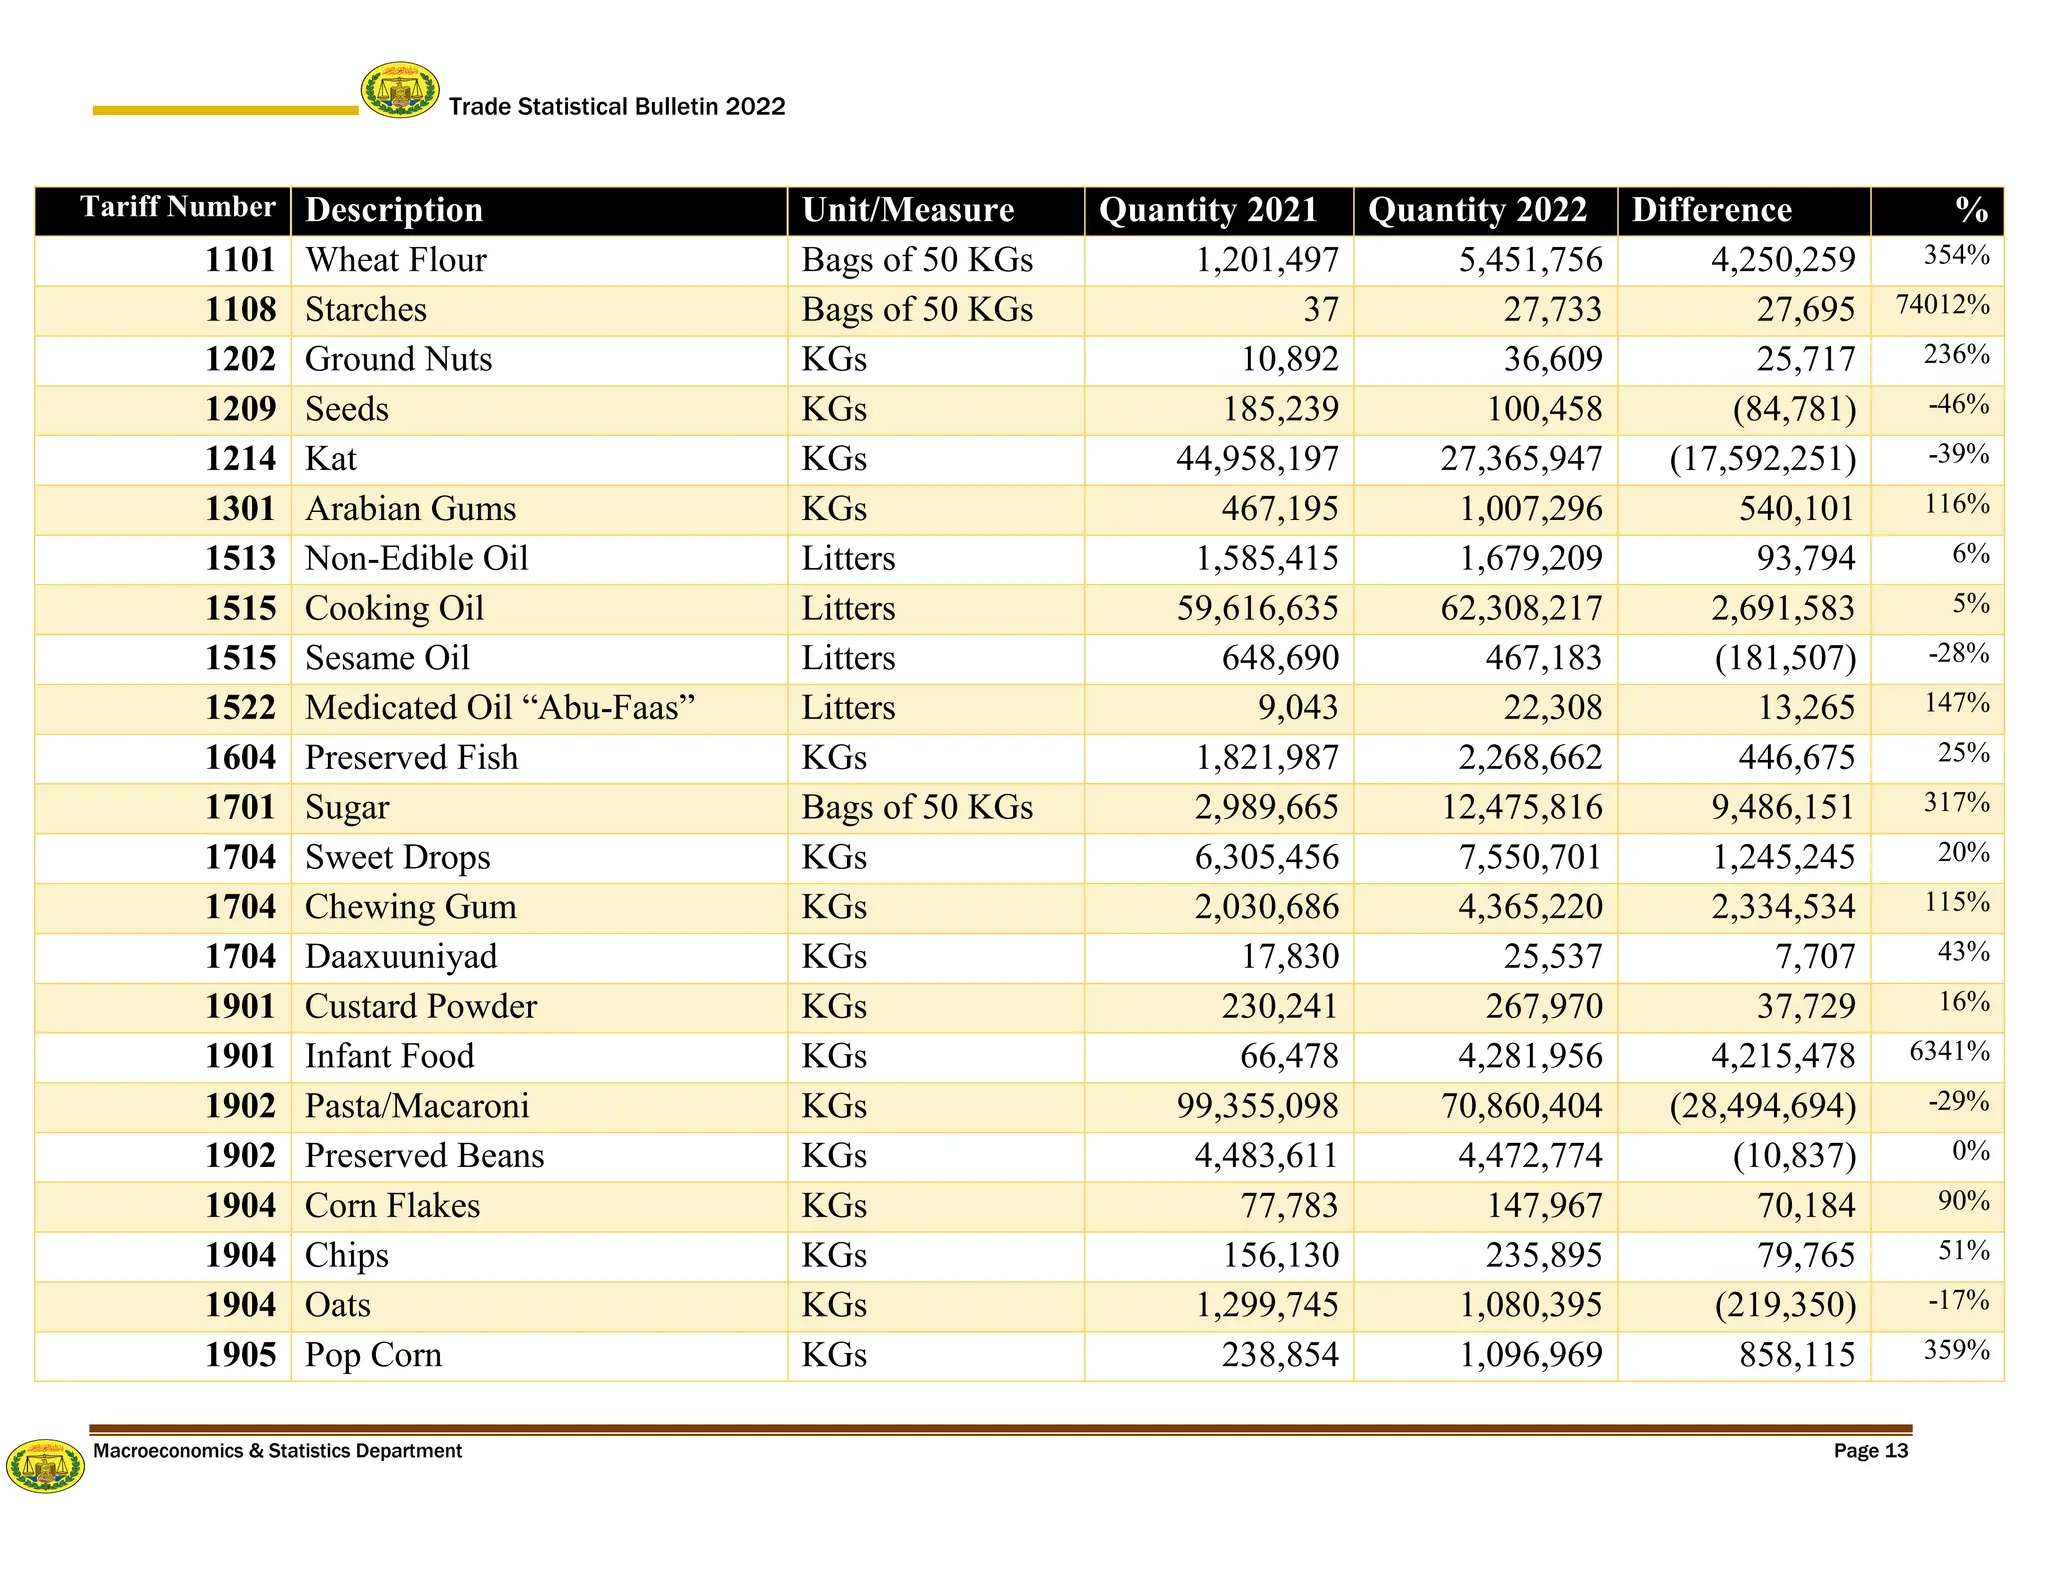
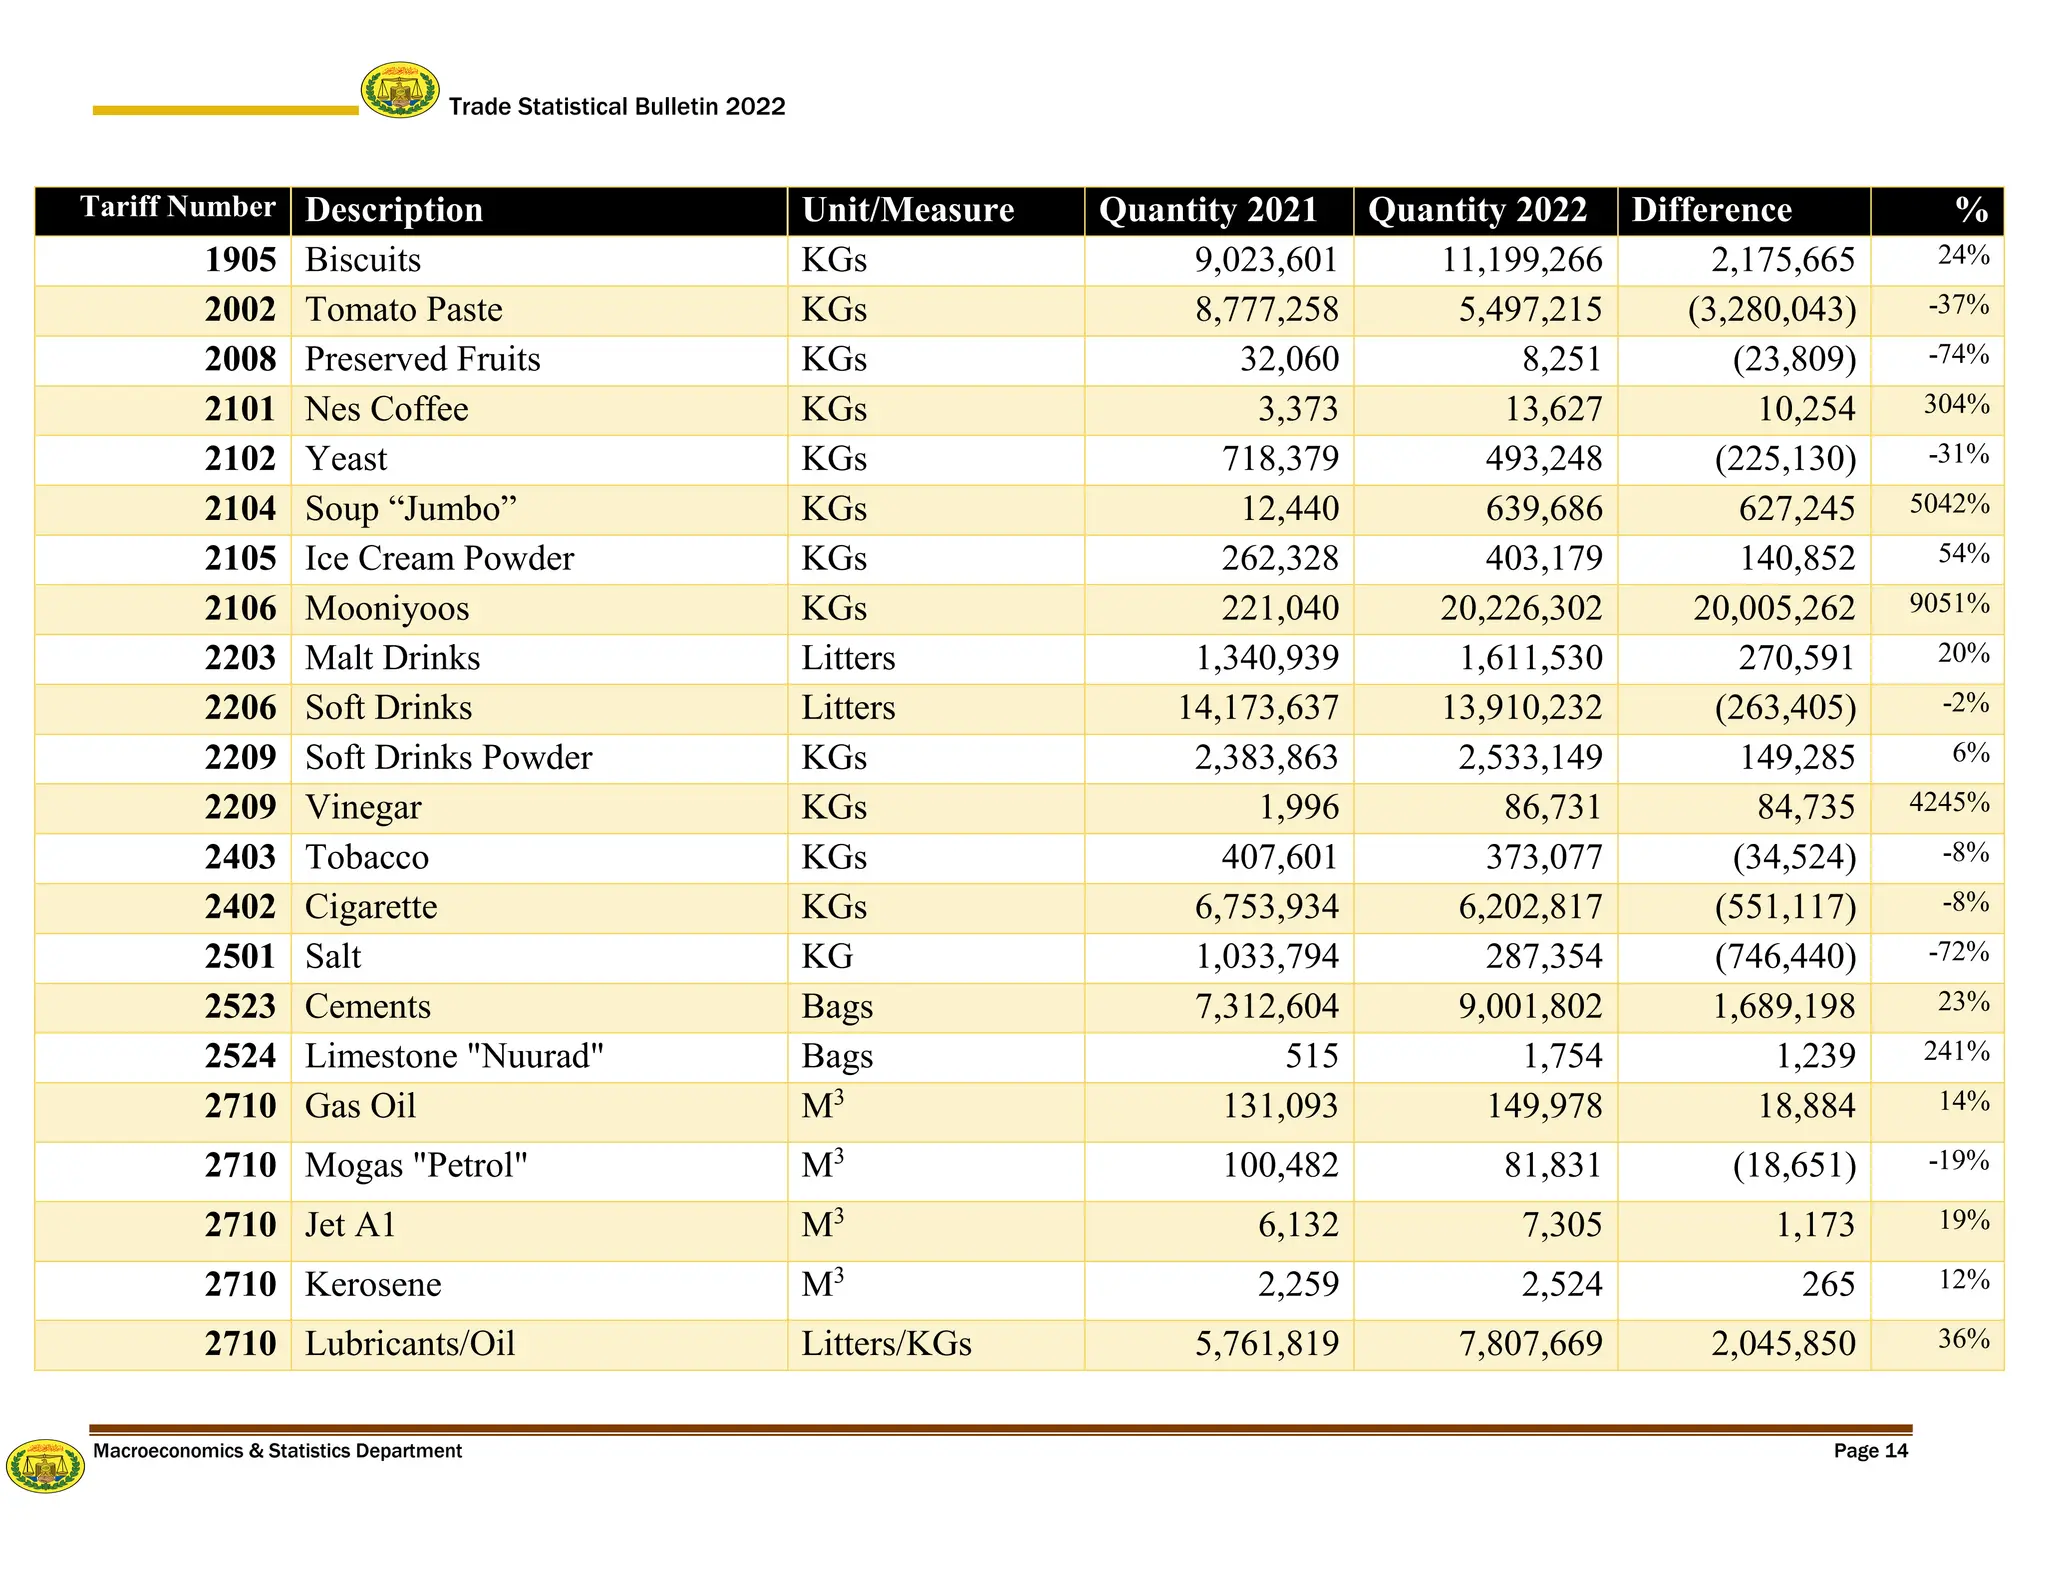
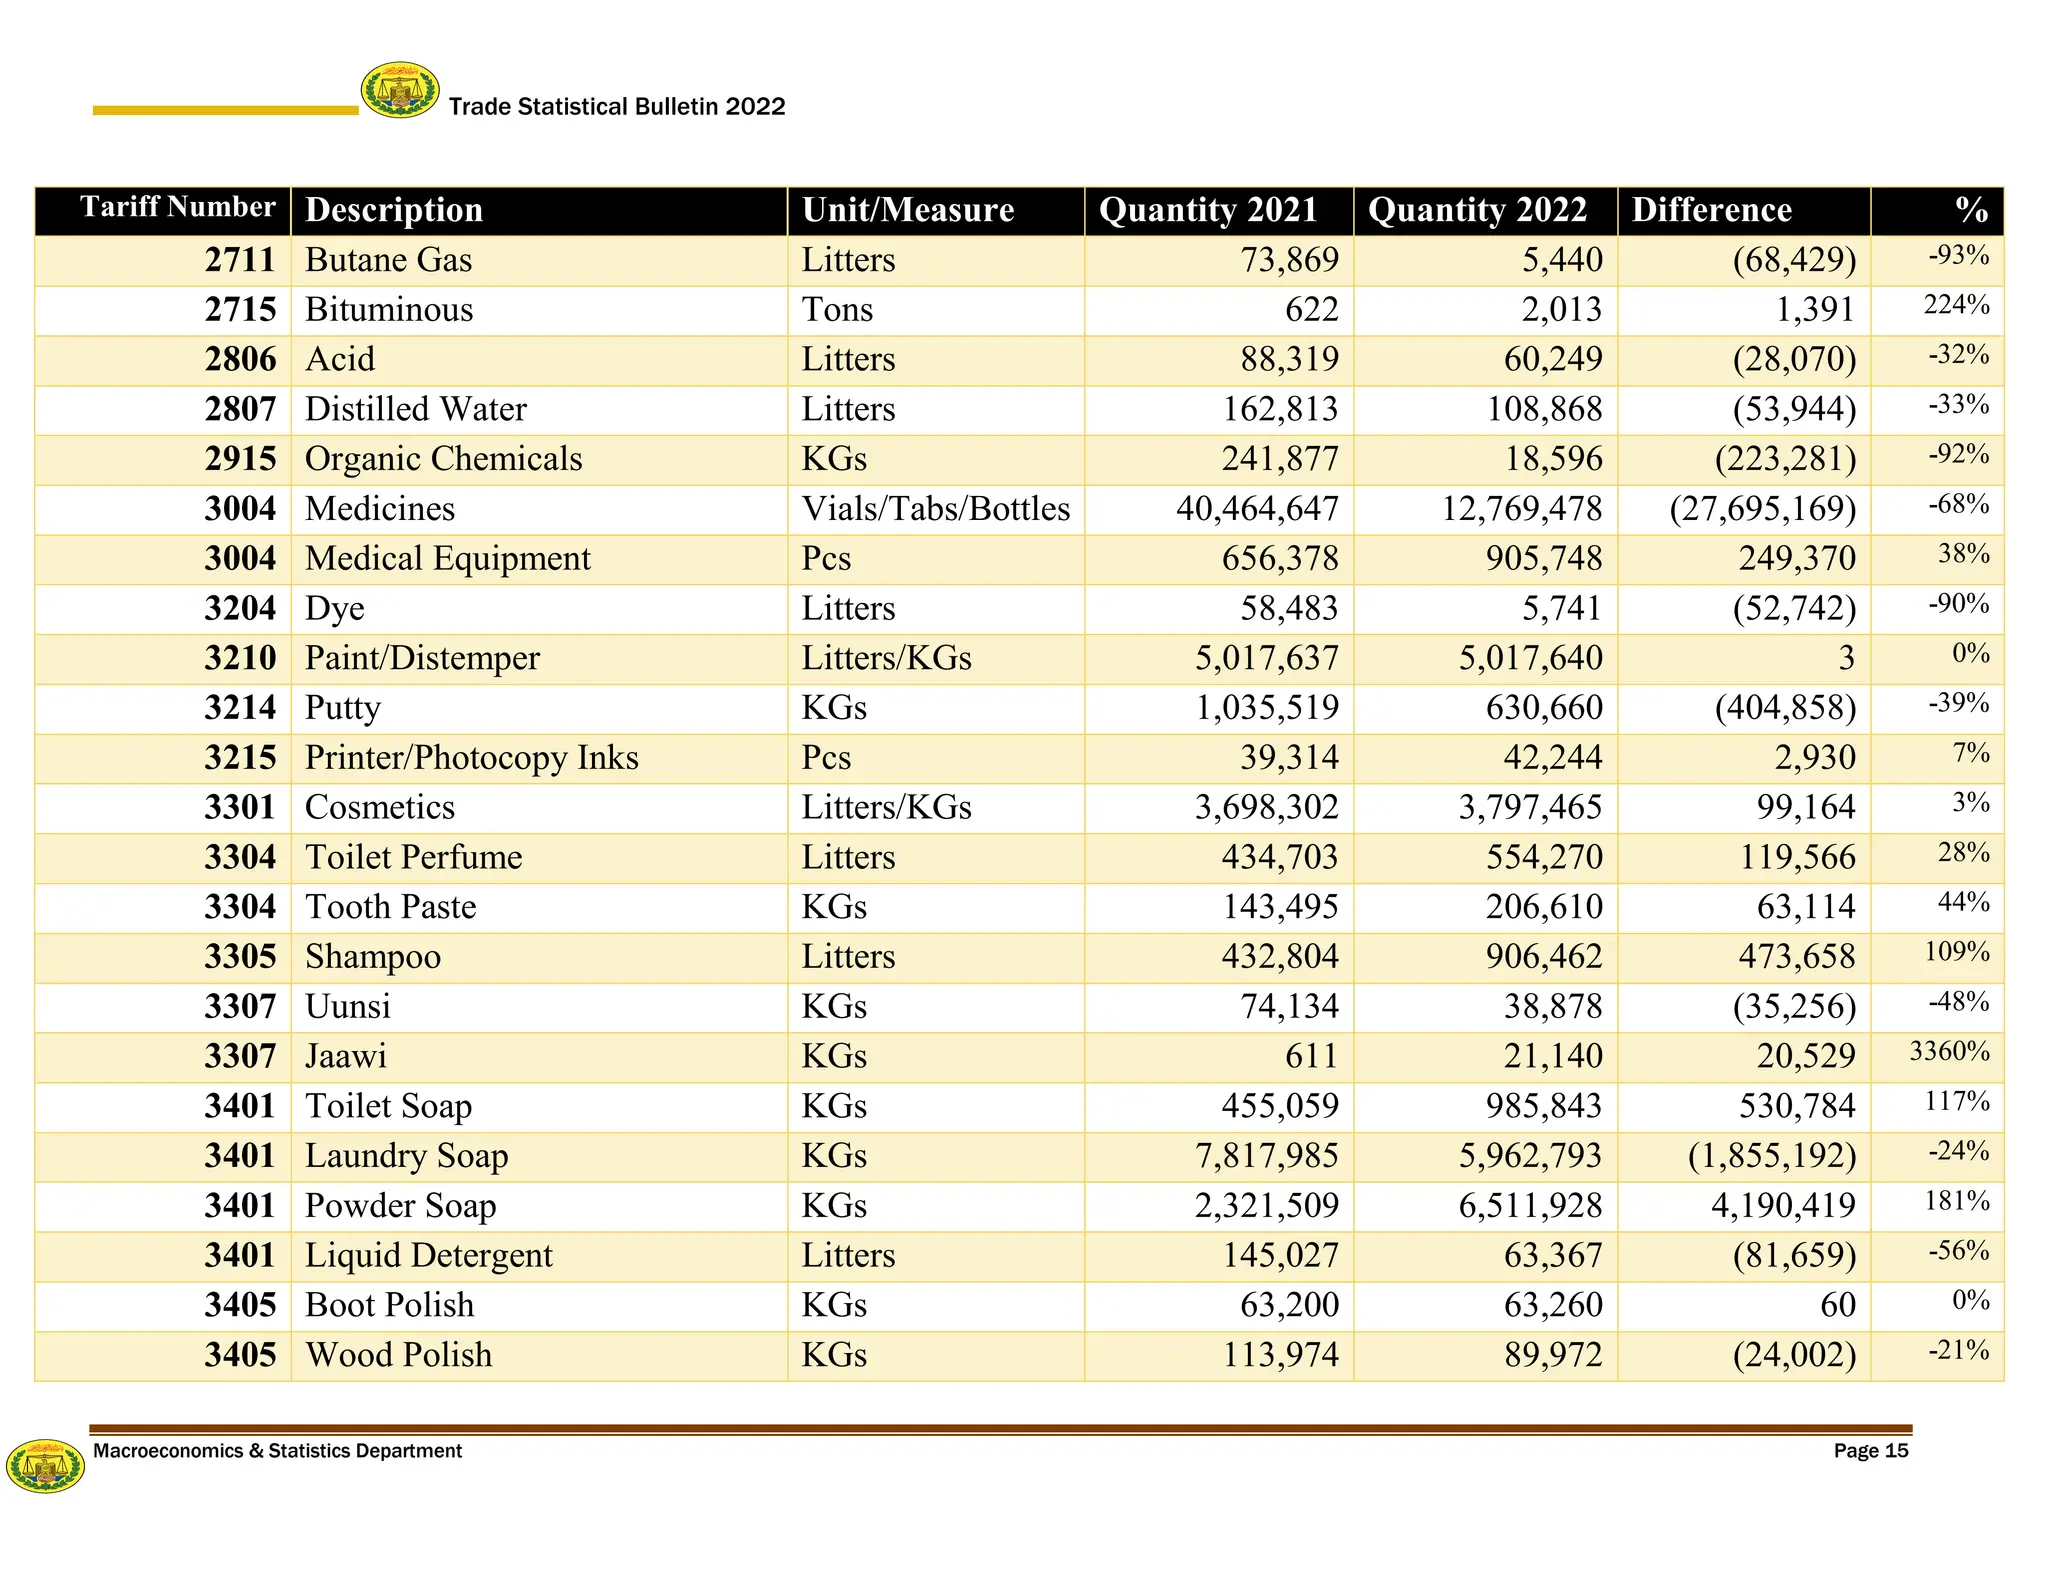
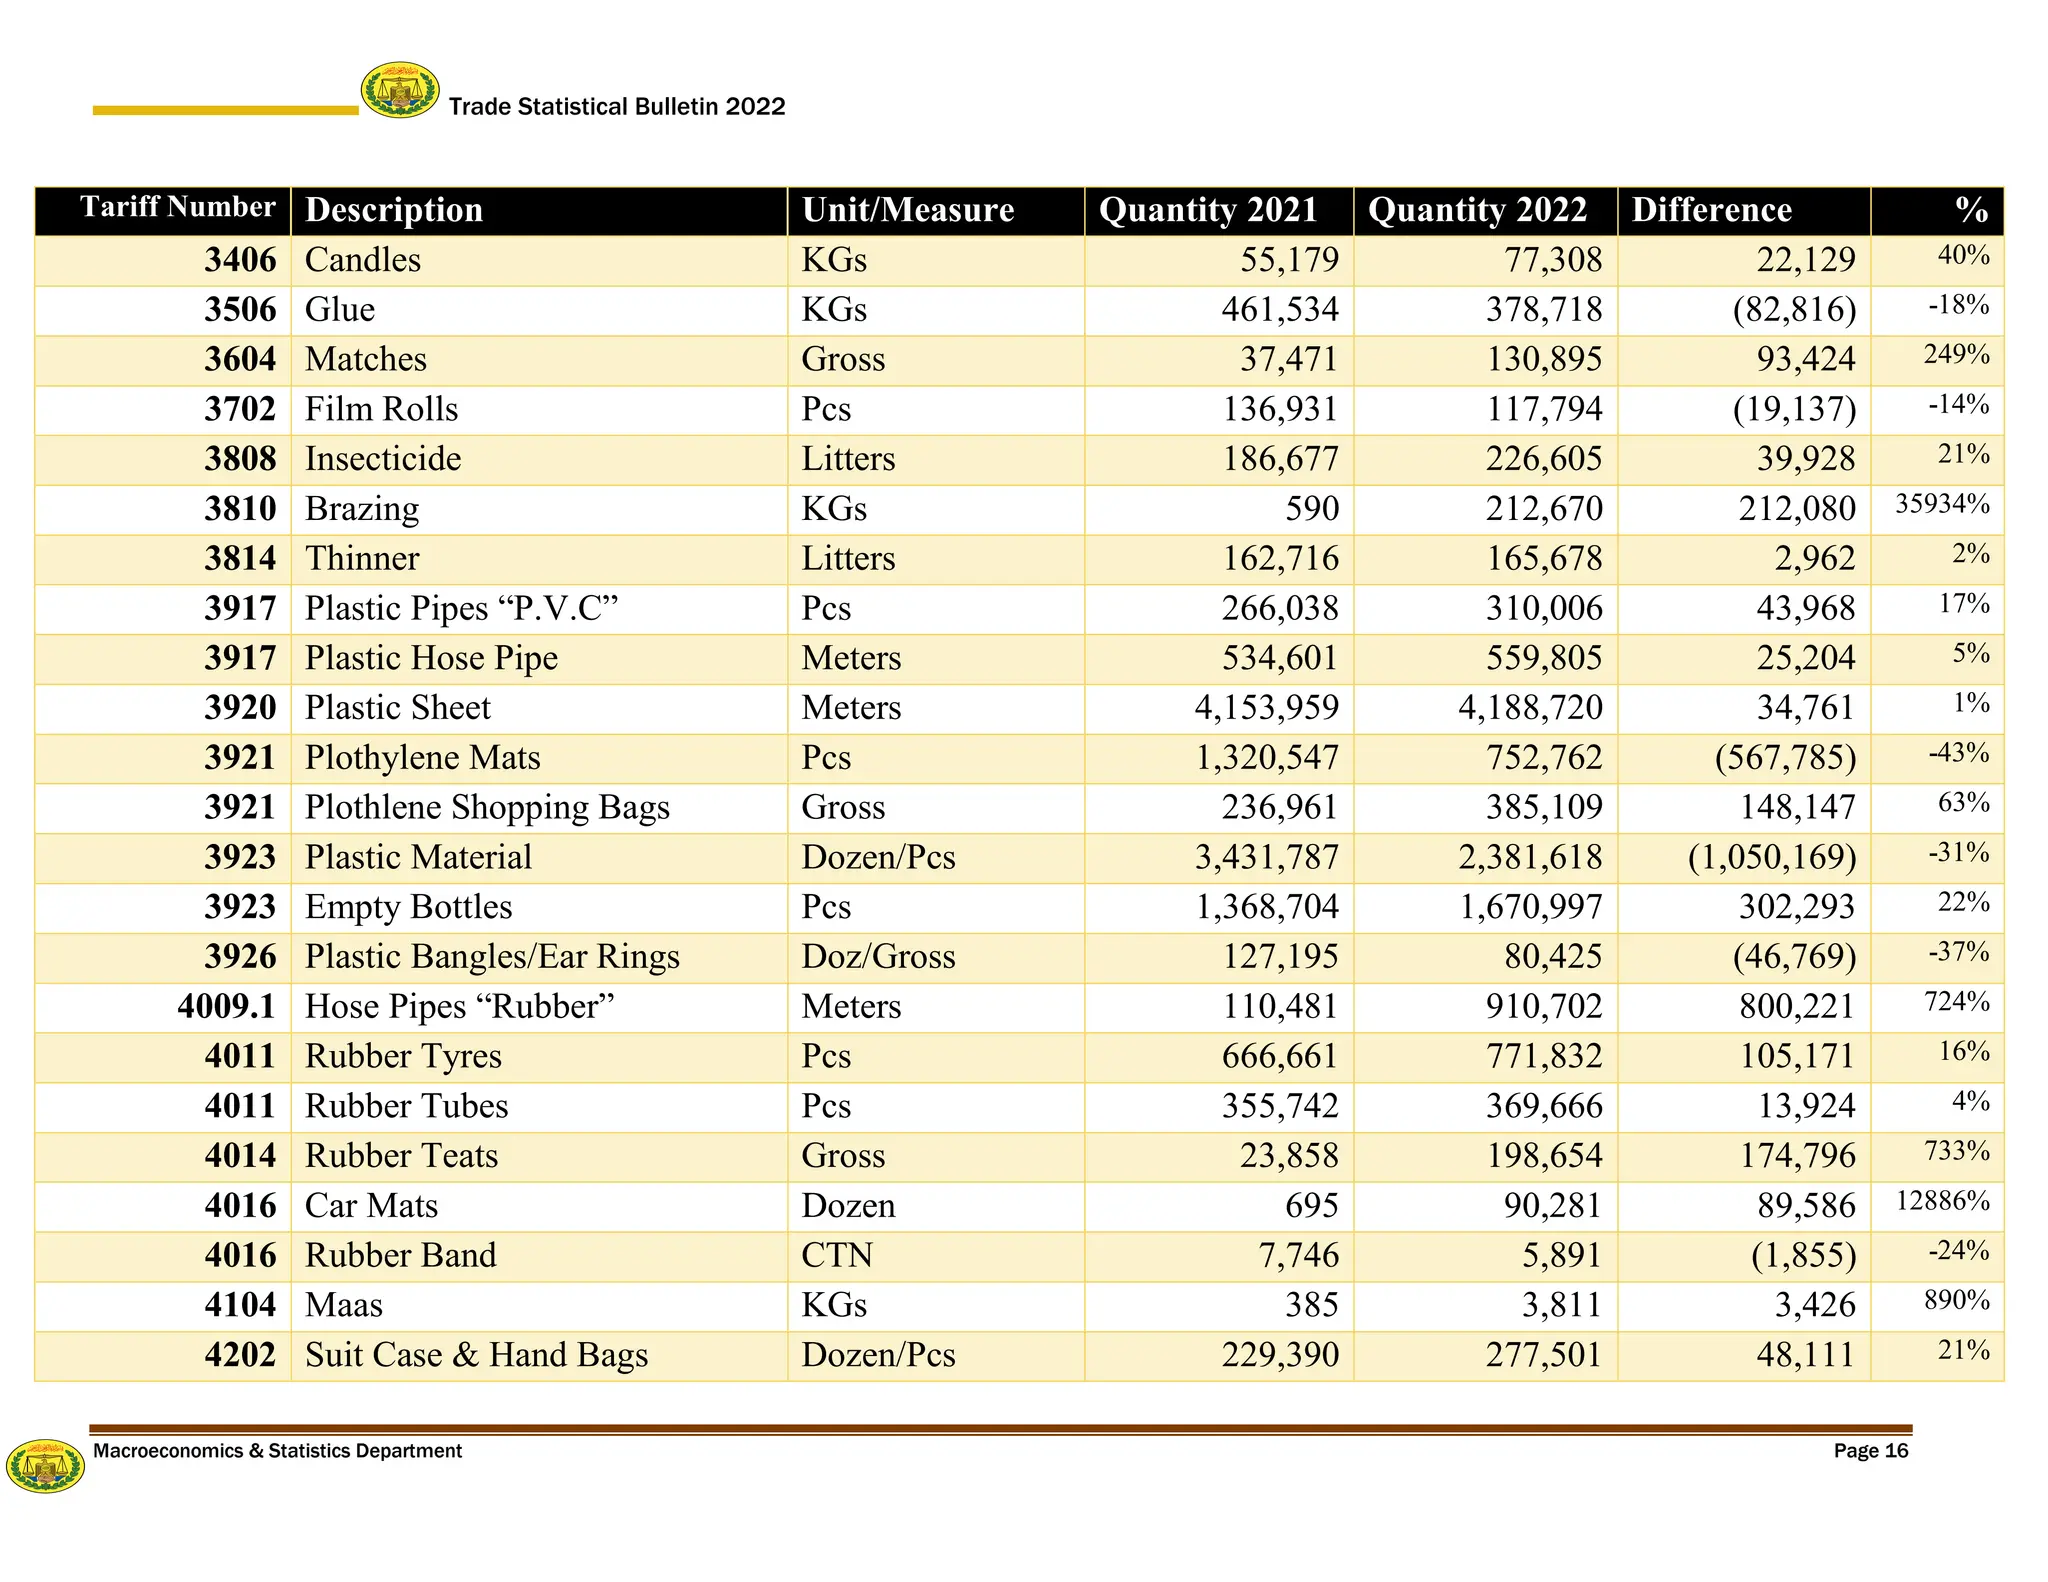
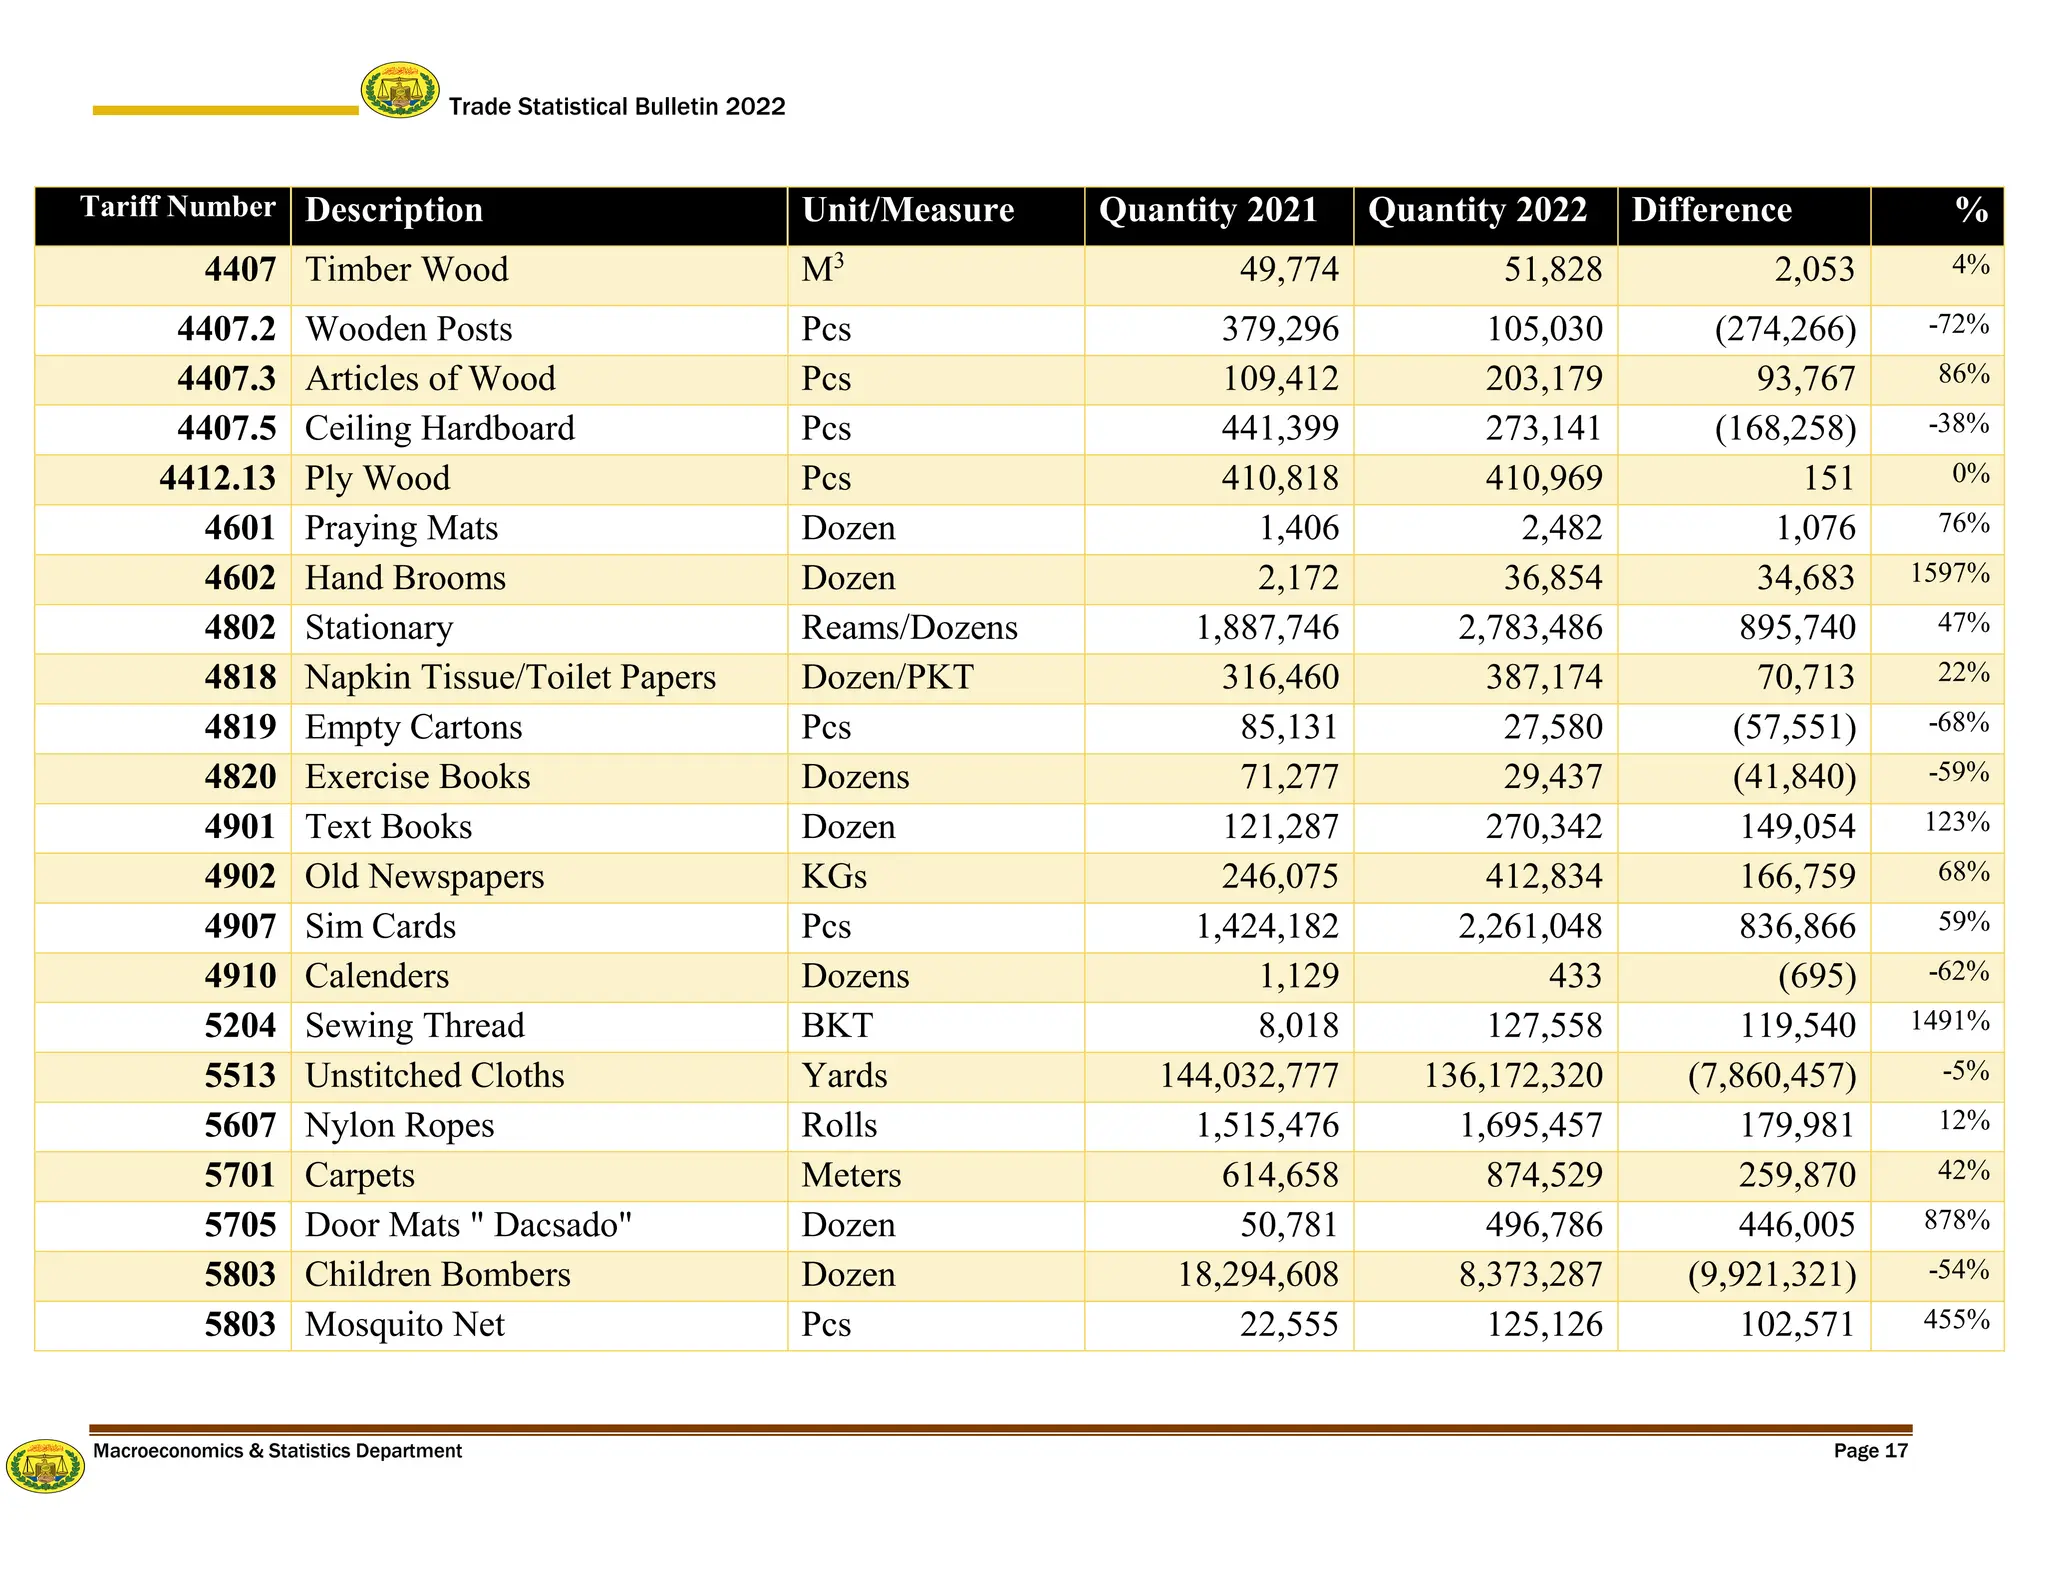
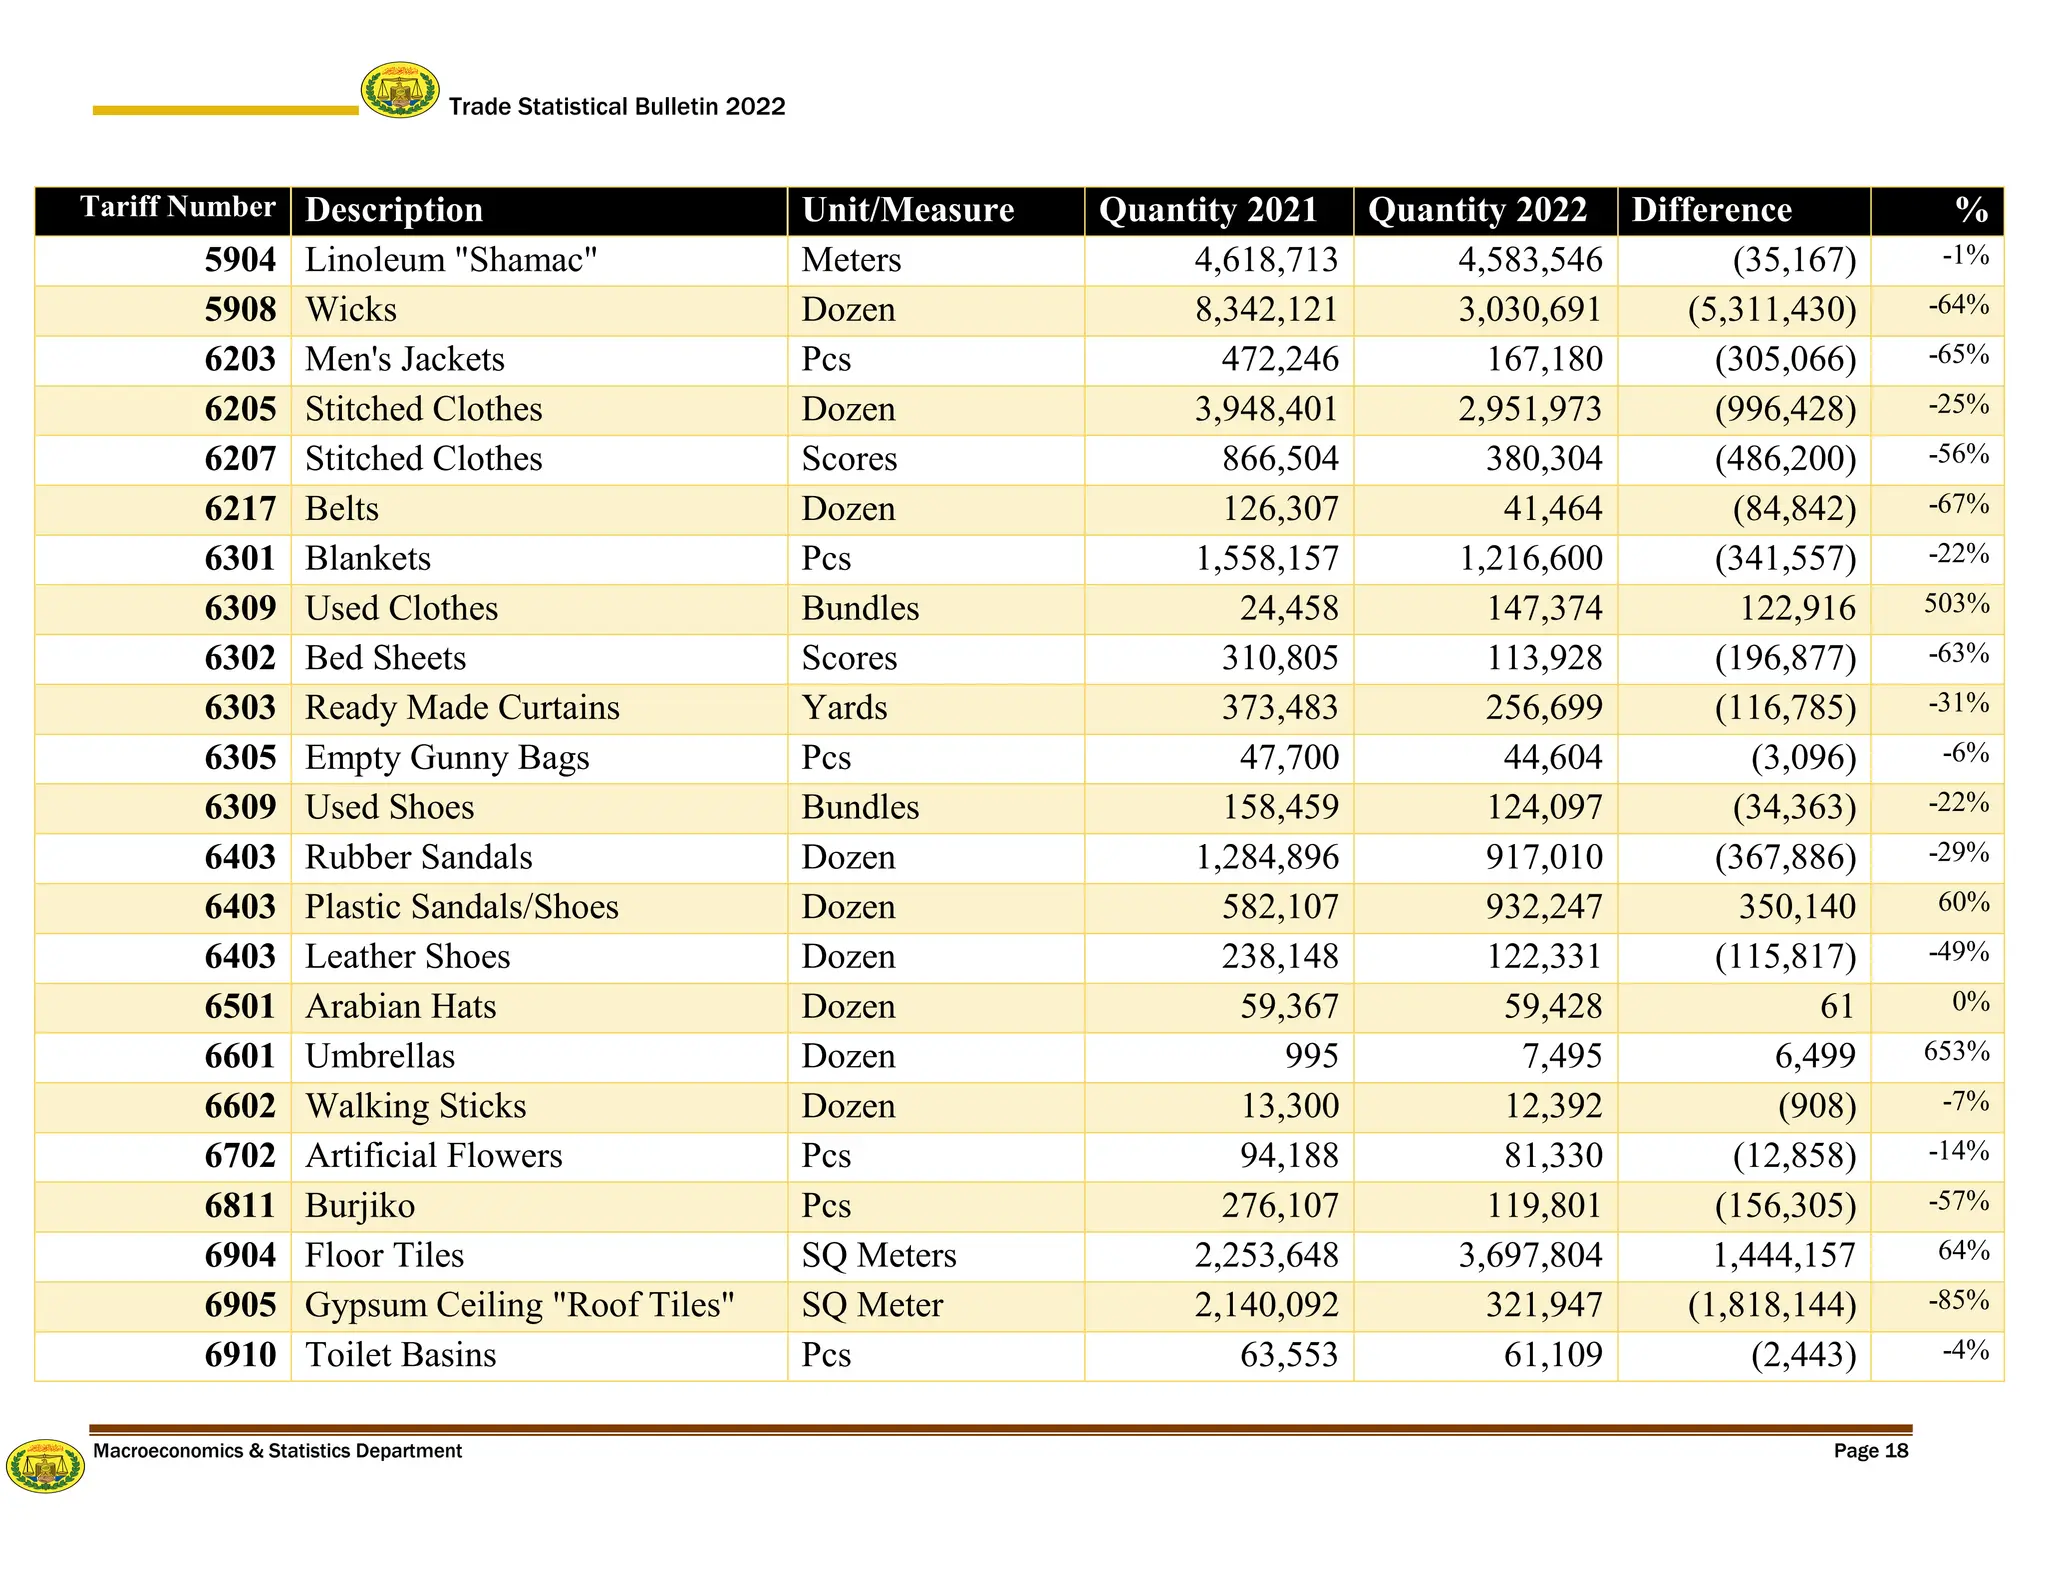
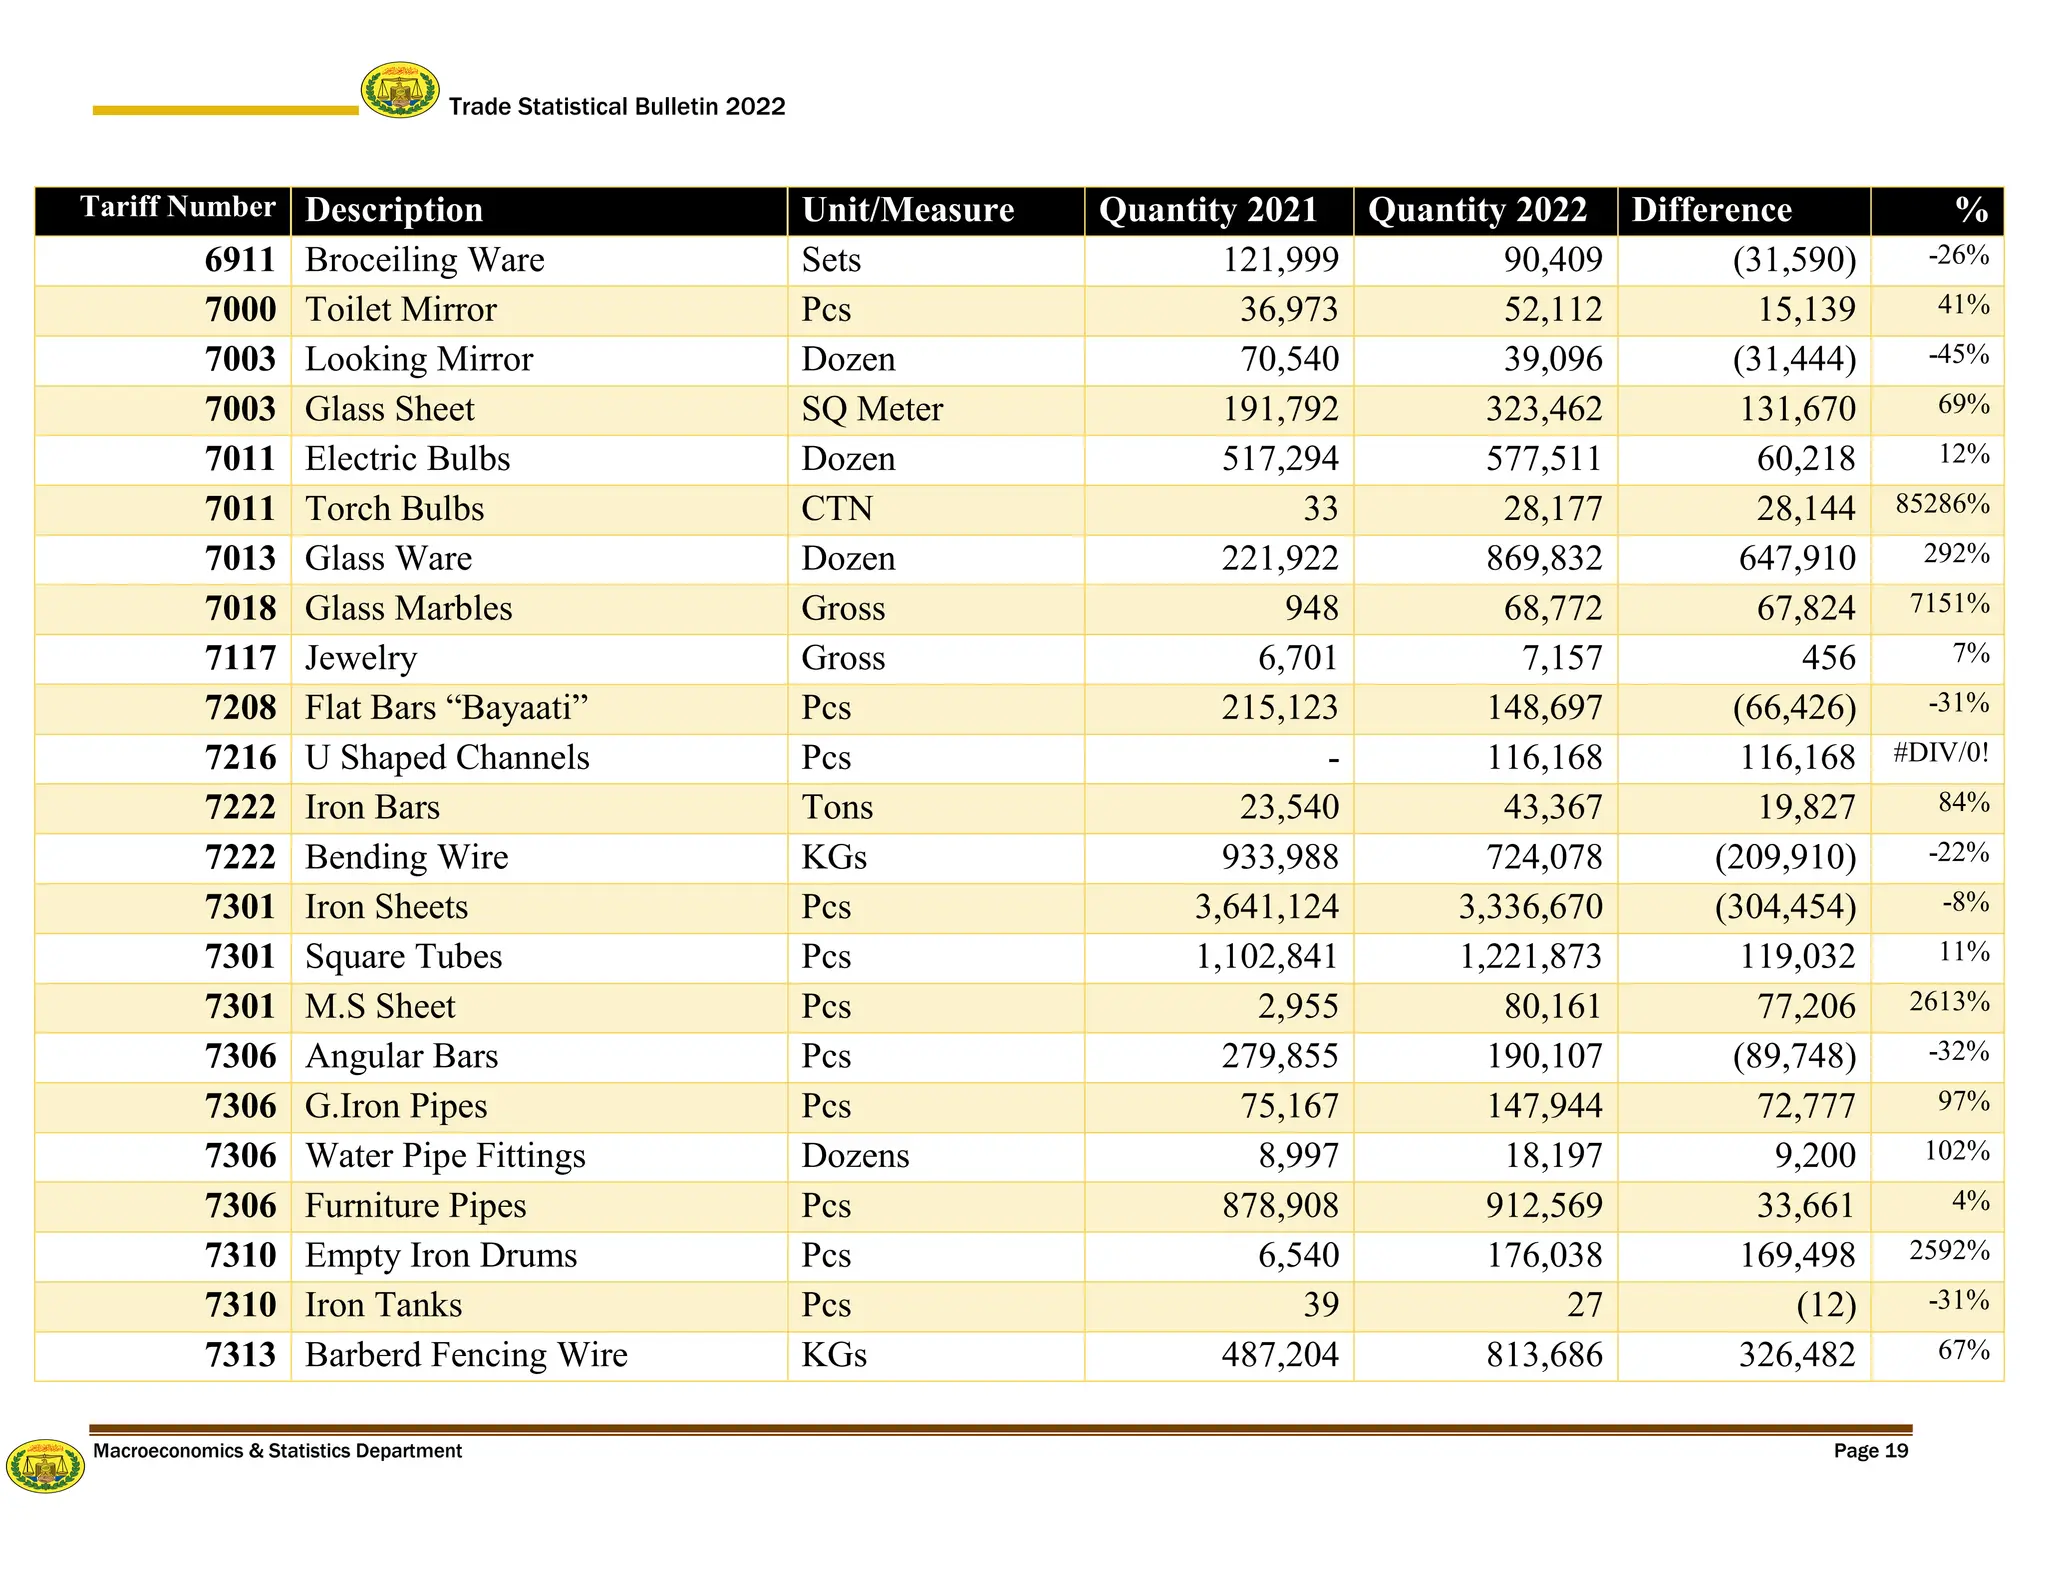
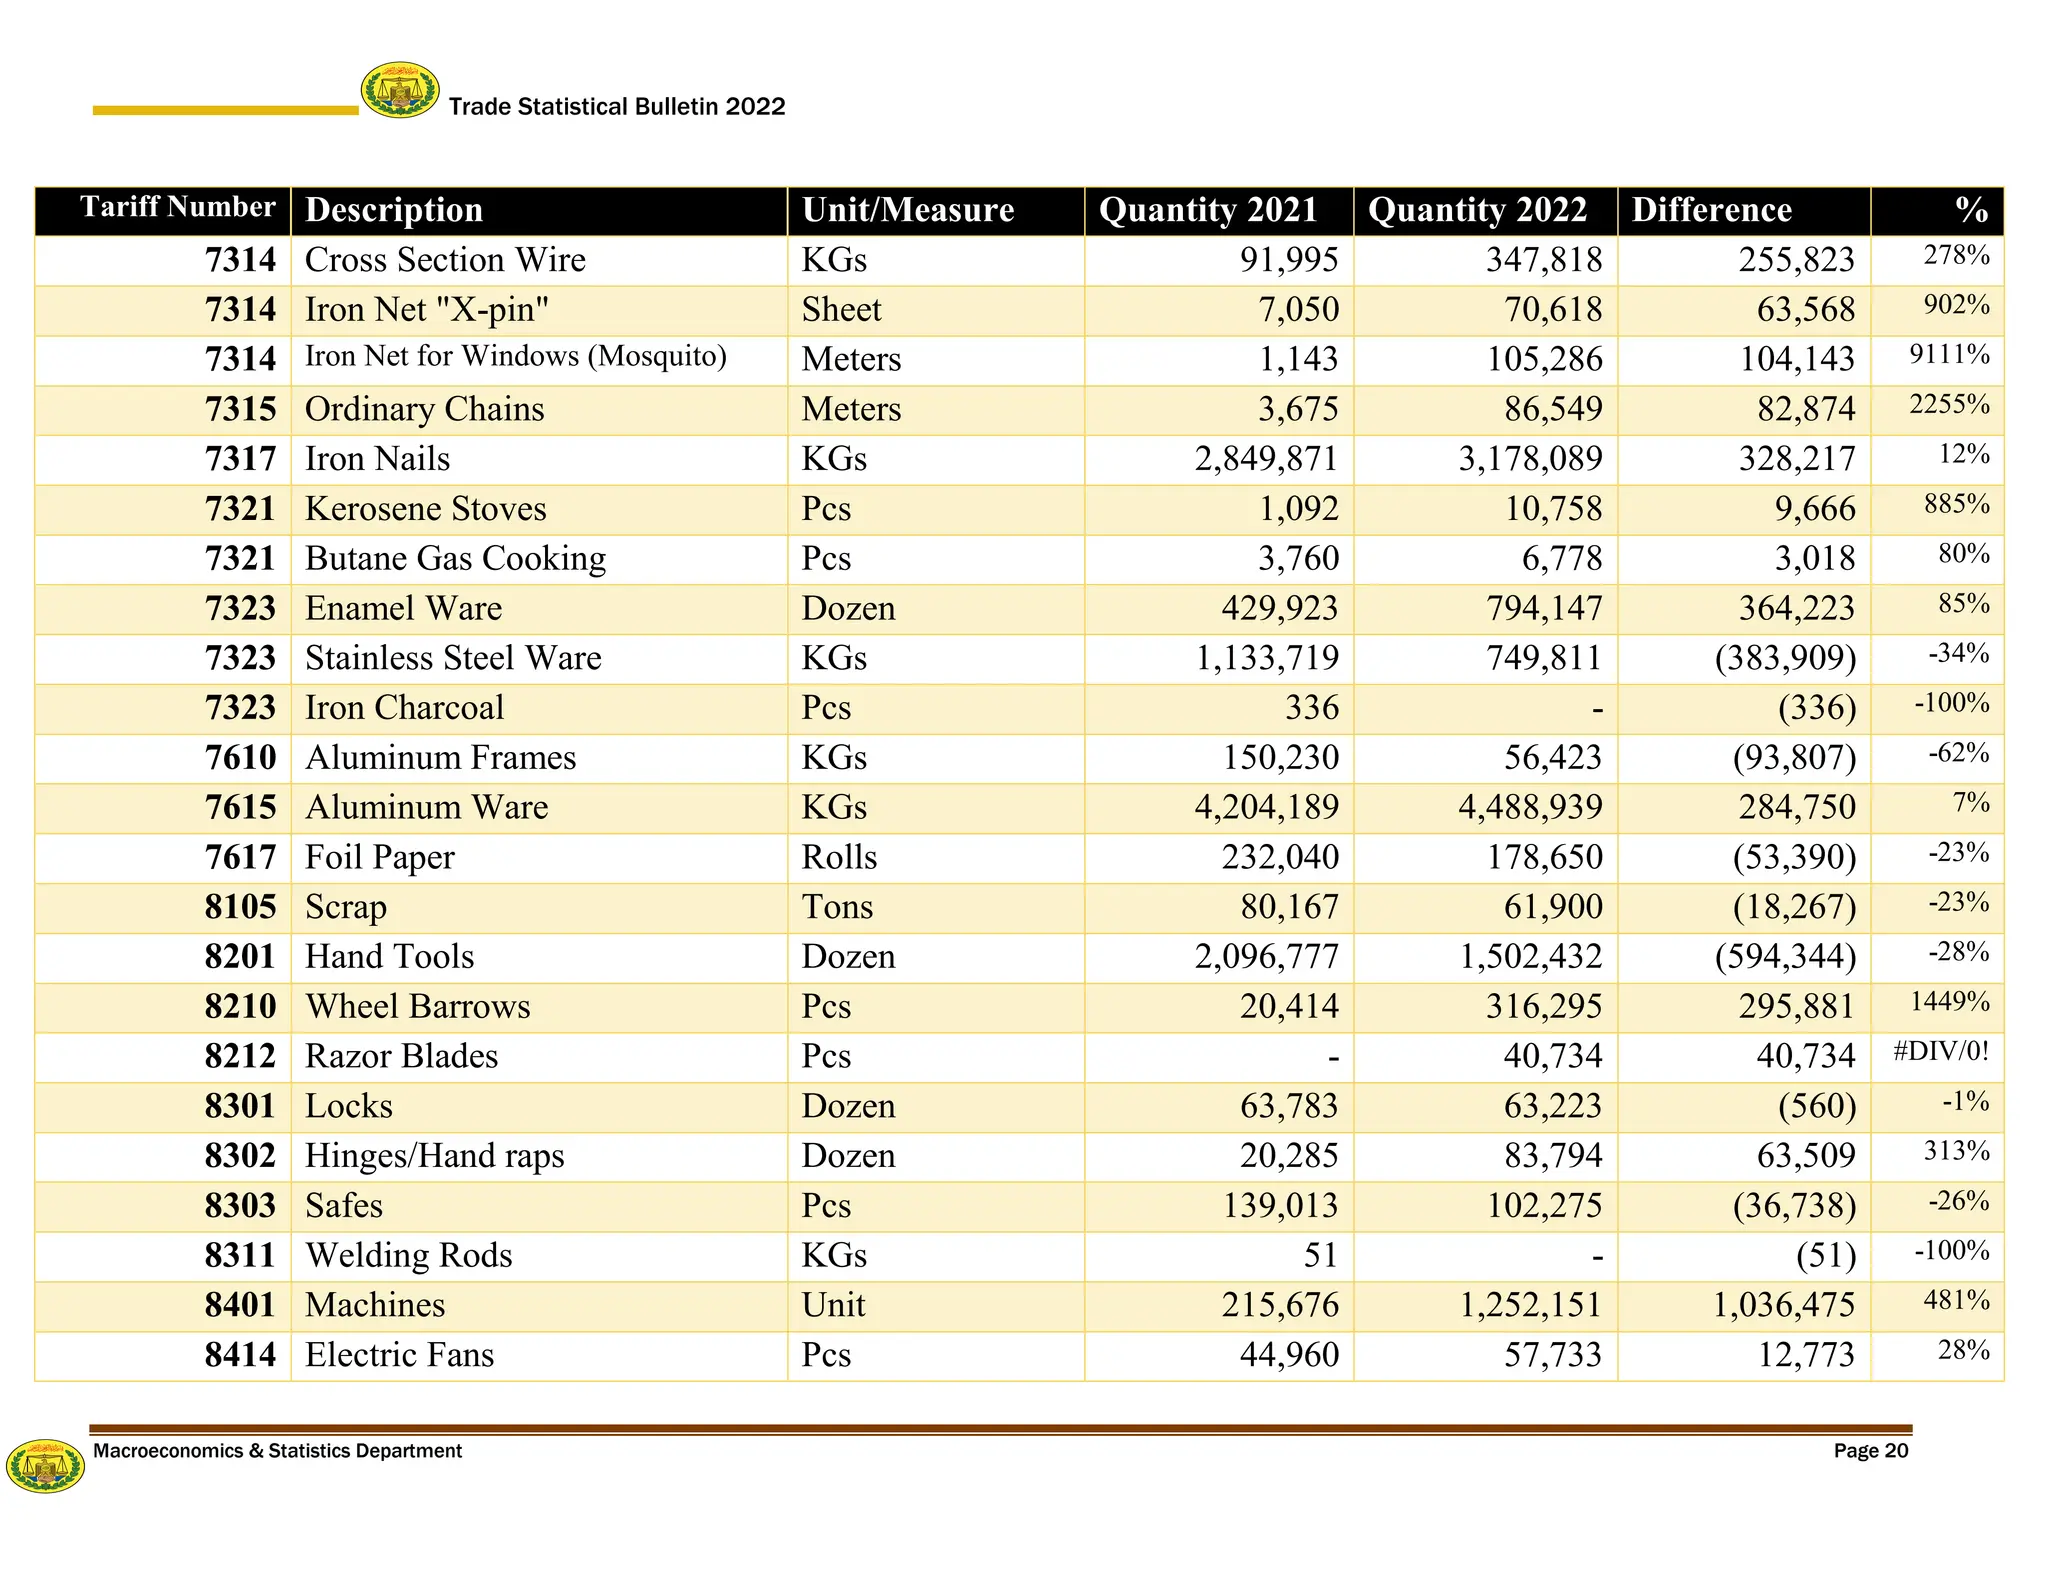
Trade Statistical Bulletin 2022
Ministry of Finance
Development
Macroeconomics and Statistics
Trade Statistical Bulletin 2022
Macroeconomics & Statistics Department Page 2
Contents
1. Exports................................................................................................................................. 3
1.1.Livestock Exports: Jan-December 2022........................................................................ 3
1.2.Commodities Exports: Jan-December 2022................................................................. 4
1.3. Comparison of Livestock Export Jan-December 2021/2022................................... 5
2. Imports...................................................................................................................................... 9
2.1. Trade Balance: Jan–Dec 2022 ..................................................................................... 11
Table 1: Livestock Exportation Jan-December 2022...................................................................... 3
Table 2: Commodities Exported During Jan-December 2022........................................................ 4
Table 3: Comparison of Export Commodities 2021/2022.............................................................. 5
Table 4: Comparison of Livestock Exportation(Sheep/Goat) Jan-December 2021/2022 ............. 6
Table 5: Comparison of Livestock Exportation (Camel) Jan-December 2021/2022 ..................... 7
Table 6: Comparison of Livestock Exportation (Cattle) Jan-December 2021/2022 ...................... 8
Table 7: Container Imports of Jan-December 2021/2022............................................................... 9
Table 8: Import Classification of Jan-December 2022................................................................. 10
Table 9: Import Classification of Jan-December 2021................................................................. 10
Figure 1: Summary of Livestock Export by Type 2022........................................................... 3
Figure 2: Comparison of Livestock Exportation (Sheep/Goat) Jan-Dec 2021/2022...................... 6
Figure 3: Comparison of Livestock Exportation (Camel) Jan-December 2021/2022.................... 7
Figure 4: Comparison of Livestock Exportation (Cattle) Jan-December 2021/2022..................... 8
Figure 5: Net Trade Balance of Somaliland 2022 ....................................................................... 11
Trade Statistical Bulletin 2022
Macroeconomics & Statistics Department Page 3
1. Exports
Export of animals to the Arab Gulf States, especially Saudi Arabia, represents the largest share of
the Somaliland export earnings. The three types of livestock that Somaliland exports are
sheep/goat, camel, and cattle. There are also other items that accompanies the livestock export.
Skins, hides and fish are the main exports that Somaliland traders share with the entire world.
1.1. Livestock Exports: Jan-December 2022
The table (1) below illustrates the category of livestock market share per type of exports. The price
of livestock per type is shown in the table and data was collected by the team from the
Macroeconomic Department, and targeted livestock markets across the regions of Somaliland. The
quantity of livestock exported during Jan-December 2022 is multiplied by the current local
livestock price per head, which gives the total value of exports. Figure 1 clearly specifies that
sheep/goat has the largest share of livestock exports of 92%, then with Cattle and Camel at 6%,
2% of quantity exported respectively.
Table 1: Livestock Exportation Jan-December 2022
No Name Quantity Unit Price Export Total Value
1 Sheep/Goat 2,063,597 $ 80.74* $ 166,614,822
2 Cattle 125,243 $ 403.69* $ 50,559,347
3 Camel 46,630 $ 611.30* $ 28,504,919
Total $245,679,087
Source: Macroeconomics & Statistics Department of MOFD
*Livestock Market Information Collected by Macroeconomic and Statistics Department
Figure 1: Summary of Livestock Export by Type 2022
Source: MoFD/Customs Department
Sheep/Goat
92%
Cattle
6%
Camel
2%
Trade Statistical Bulletin 2022
Macroeconomics & Statistics Department Page 4
1.2. Commodities Exports: Jan-December 2022
The exports from Somaliland other than livestock are not as that as significant. Few items or
commodities are exported through the main port of Berbera and Zaila border. The Table 2 below
shows the list of items that Somaliland exports to other countries. Skins and hides, gums, fish,
powder soap and watermelon hold prominent positions in terms of quantities exported. The values
in the table are collected by a particular team from Macroeconomic department, and the price
values sometimes vary significantly from current local market prices.
Table 2: Commodities Exported During Jan-December 2022
No Item Name Unit Measure Quantity
Exported
Unit Price
Value*
Total Value
1 Skins Pcs 324,500 $1.25 $ 405,625
2 Hides Pcs 89,900 $5.00 $ 449,500
3 Fresh Fish KGs 576,231 $4.00 $ 2,304,924
4 Lobster KGs 50,420 $20.00 $ 1,008,400
5 Foox KGs 1,593,203 $14.00 $ 22,304,842
6 Malmal KGs 85,130 $16.00 $ 1,362,080
7 Battery Scrap Tons 2,641 $100 $ 264,112
8 Copper Scrap Tons 1,506 $300 $ 451,819
9 Powder Soap KGs 3,530,592 $2.38 $ 8,402,809
10 Sorghum Bags of 50 KGs 680 $9.50 $ 6,460
11 Ethiopian Daafi Bags of 50 KGS 440,000 $47.00 $ 20,680,000
12 Watermelon KGs 968,000 $3.00 $ 2,904,000
13 Xabag (Gum) KGs 77,010 $8.00 $ 616,080
14 Fresh Fruits KGs 976,965 $1.80 $ 1,758,537
15 Gold bars Grams 761,784 $47.00 $ 35,803,867
16 Iron Scrap Tons 979 $400 $ 391,600
17 Fish Oil Litter 72,000 $0.34 $ 24,480
18 Mineral Litter 54 $0.38 $ 21
19 Aquaria Fish KG 17,548 $4.00 $ 70,192
20 Another medicated tree Pieces 1,061 $1.00 $ 1,061.00
21 Wheat KG 25 $9.50 $ 238
22 Maize KG 10,334 $9.50 $ 98,173
23 Fresh Vegetable KG 17,800 $1.80 $ 32,040
24 Sea Cucumber KG 488,873 $20.00 $ 9,777,460
Total $ 109,118,318
Source: MoFD/Customs Department
*Macroeconomic team collected the current Market local price
Trade Statistical Bulletin 2022
Macroeconomics & Statistics Department Page 5
Table 3: Comparison of Export Commodities 2021/2022
No Description Unit Measure 2021 2022 Difference Percent
1 Skins Pcs 495,000 324,500 (170,500) -34%
2 Hides Pcs 123,700 89,900 (33,800) -27%
3 Fresh Fish KGs 577,299 576,231 (1,068) 0%
4 Sea Cucumber KGS 2,125 488,873 486,748 22906%
5 Aquaria Fish KGs - 17,548 17,548 100%
6 Lobster KGs 18,900 50,420 31,520 167%
7 Incense (Foox) KGs 1,345,461 1,593,203 247,742 18%
8 Myrrh (Malmal) KGs 57,135 85,130 27,995 49%
9 Battery Scrap Tons 2,047 2,641 594 29%
10 Copper Scrap Tons 1,539 1,506 (33) -2%
11 Powder Soap KGs 1,790,264 3,530,592 1,740,328 97%
12 Sorghum Bags of 50 KGs 29,542 680 (28,862) -98%
13 Ethiopian Daafi Bags of 50 KGS 101,980 440,000 338,020 331%
14 Gold bars Grams 784,187 761,784 (22,403) -3%
15 Watermelon KGs 1,893,000 968,000 (925,000) -49%
16 Vegetables KGs 28,462 17,800 (10,662) -37%
17 Wheat Husk KGs 2,840 (2,840) -100%
18 Iron Scrab Tons 422 979 557 132%
19 Gum (Xabag) KGs 758 77,010 76,252 10060%
20 Wheat Pcs - 25 25 100%
21 Maize KGs - 10,334 10,334 100%
22 Fresh Fruits KGs 211,050 976,965 765,915 363%
23 Sesame oil KGs 240,000 (240,000) -100%
24 Fish Oil Litter 33,800 72,000 38,200 113%
25 Mineral KGs 482 54 (428) -89%
26 Other medicated tree Pieces - 1,061 1,061 100%
1.3. Comparison of Livestock Exports (Sheep/Goat) Jan-December 2021/2022
As the comparative figures between 2021 and 2022 in Table 4 below shows, the month of May in
2022 has the highest percentage increase in exports compared to the same month in the previous
year. In aggregate, livestock (Sheep/Goats) exports in the year of 2022 were 10% higher than
exports of the same period in 2021.
Trade Statistical Bulletin 2022
Macroeconomics & Statistics Department Page 6
Table 4: Comparison of Livestock Exportation (Sheep/Goat) Jan-December 2021/2022
Sheep/Goat 2021 2022 Difference Percent ∆
January 112,287 95,517 (16,770) -15%
February 121,302 152,545 31,243 26%
March 131,824 119,954 (11,870) -9%
April 145,272 150,323 5,051 3%
May 69,939 140,042 70,103 100%
June 549,202 771,853 222,651 41%
July 388,688 257,120 (131,568) -34%
August 52,103 47,673 (4,430) -9%
September 61,448 55,643 (5,805) -9%
October 47,517 66,037 18,520 39%
November 90,991 99,566 8,575 9%
December 97,092 107,324 10,232 11%
G/Total 1,867,665 2,063,597 195,932 10%
Source: MoFD/Customs Department
Figure 2 below shows the comparison between the two annual statistical reports of Jan-Dec 2021
and 2022. The month of May has the highest difference in 2021/2022 which total sheep/goat
exports doubling. The figure also shows a clear seasonal pattern in the exports of livestock.
Figure 2: Comparison of Livestock Exportation (Sheep/Goat) Jan-Dec 2021/2022
Source: MoFD/Customs Department
0
100,000
200,000
300,000
400,000
500,000
600,000
700,000
800,000
900,000
2021 2022
Trade Statistical Bulletin 2022
Macroeconomics & Statistics Department Page 7
Table 5 and Figure 3 below show the comparison of camel’s exports during the fiscal years of
2021/2022. Camel exports in August 2022 has the highest year-on-year (YoY) increase of
58,540%, while July has the largest YoY decrease. This is different from the rest of the livestock
exports, which follow a more seasonal pattern. In aggregate, Jan-Dec 2022 camel exports increased
67% compared to the Jan-Dec 2021 camel export. There is also significant monthly variation in
the quantity of camels exported.
Table 5: Comparison of Livestock Exportation (Camel) Jan-December 2021/2022
Camel 2021 2022 Difference Percentage Change
January 3,357 2,628 (729) -22%
February 4,610 10,931 6,321 137%
March 4,888 2,927 (1,961) -40%
April 3,850 3,777 (73) -2%
May 1,214 3,346 2,132 176%
June 2,486 3,516 1,030 41%
July 4,196 205 (3,991) -95%
August 5 2,932 2,927 58540%
September 710 5,420 4,710 663%
October 714 3,013 2,299 322%
November 1,000 1,997 997 100%
December 930 5,938 5,008 538%
G/Total 27,960 46,630 18,670 67%
Source: MoFD/Customs Department
Figure 3: Comparison of Livestock Exportation (Camel) Jan-December 2021/2022
Source: MoFD/Customs Department
0
2,000
4,000
6,000
8,000
10,000
12,000
2021 2022
Trade Statistical Bulletin 2022
Macroeconomics & Statistics Department Page 8
As can been seen in Table 6 and Figure 4 below, cattle are the second largest livestock export after
sheep and goats. The table indicates that from Jan-Dec 2022, cattle exports increased 22%
compared to Jan-Dec 2021 cattle. January has the highest YoY decrease of cattle exports at 62%,
while September had the largest YoY increase at 248%.
Table 6: Comparison of Livestock Exportation (Cattle) Jan-December 2021/2022
Cattle 2021 2022 Difference Percentage Change
January 17,190 6,583 (10,607) -62%
February 7,815 8,904 1,089 14%
March 8,257 10,088 1,831 22%
April 8,931 11,045 2,114 24%
May 5,216 6,966 1,750 34%
June 9,694 16,093 6,399 66%
July 11,815 10,598 (1,217) -10%
August 1,939 6,441 4,502 232%
September 4,166 14,481 10,315 248%
October 9,592 10,309 717 7%
November 9,767 10,449 682 7%
December 7,964 13,286 5,322 67%
G/Total 102,346 125,243 22,897 22%
Source: MoFD/Customs Department
Figure 4: Comparison of Livestock Exportation (Cattle) Jan-December 2021/2022
Source: MoFD/Customs Department
0
2,000
4,000
6,000
8,000
10,000
12,000
14,000
16,000
18,000
20,000
2021 2022
Trade Statistical Bulletin 2022
Macroeconomics & Statistics Department Page 9
2. Imports
Somaliland imports a wide range of products consisting mainly of food items, petroleum products,
building materials, machinery and equipment, consumer goods, pharmaceuticals, tobacco and
motor vehicles, etc. The bulk of the imports originates from Ethiopia, China, Kenya, U.A.E,
Yemen, Saudi Arabia, India, Thailand, and Malaysia. Table 7 below shows the import of
containers through Jan-Dec 2021/2022, where there was a 2% increase in containers YoY. India,
United Arab Emirates, and China have the greatest number of import containers, which is listed in
full in Appendix 3.
Table 7: Container Imports of Jan-December 2021/2022
Month Containers Jan-Dec 2021 Containers Jan-Dec 2022 Difference %Change
January 3,665 4,197 532 15%
February 3,926 2,967 (959) -24%
March 4,113 3,548 (565) -14%
April 2,838 3,164 326 11%
May 3,638 3,109 (529) -15%
June 4,074 2,712 (1,362) -33%
July 2,599 3,876 1,277 49%
August 5,009 3,696 (1,313) -26%
September 3,179 4,505 1,326 42%
October 3,695 4,157 462 13%
November 3,198 4,068 870 27%
December 3,311 3,977 666 20%
Total 43,245 43,976 731 2%
Source: MoFD/Customs Department
The trade of khat and its consumption play a significant role in the Somliland economy. It
provides employment opportunities to thousands of people and it is a main source of revenue for
the Ministry of Finance, however khat trade constitues a big drain on the foreign currency
resources of the country.
Taxation of imports/exports could be a primary source of potential revenue but it is constrained
by lack of regulation and the effective promotion of trade.
Unlike most developing countries which grow their food, Somaliland relies on food imports
despite having enough arable land in the country. This is mainly due to the nomadic way of life
and the subsistence approach to food production that is prevelent in Somaliland.
Tables of 8 & 9 illustrates the classification of imports into seven categories. Food stuffs and
building materials have the highest duty collected as a proportion of total import value, with
39% and 15% respectively. This import classifications are extracted from the full list of
imported items in Appendix 1.
Trade Statistical Bulletin 2022
Macroeconomics & Statistics Department Page 10
Table 8: Import Classification of Jan-December 2022
Value (S.L.sh) Duty (S.L.sh) % Against value
Food Stuff 3,884,933,164,047 498,580,834,355 39
Oleaginous*
1,009,894,962,156 410,580,786,141 10
Fuel & Transportation 1,021,466,178,492 176,465,043,147 10
Shopping’s 825,824,291,385 185,836,394,772 8
Building Material 1,440,522,846,812 183,084,961,760 15
Electronics 1,494,321,069,857 89,123,760,415 15
Others 184,588,477,490 35,537,718,802 2
Grand Total 9,861,550,990,239* 1,579,209,499,392 100
Source: MoFD/Customs Department
*includes Khat, Cigarettes, tobaco and Medicines
*This value is derived from computation of Invoice value collected by the Customs
Authorities from importers and traders in the fiscal year of 2022.
Table 9: Import Classification of Jan-December 2021
Value (S.L.sh) Duty (S.L.sh) % Against value
Food Stuff 7,316,690,465,736 430,869,848,041 32%
Oleaginous*
1,925,919,001,867 554,771,527,129 8%
Fuel & Transportation 1,720,226,050,918 207,939,086,927 8%
Shopping’s 8,025,528,644,669 201,893,861,359 35%
Building Material 2,016,526,274,666 172,489,294,583 9%
Electronics 1,369,817,788,583 83,053,358,929 6%
Others 391,320,523,986 29,087,428,398 2%
Grand Total 22,766,028,750,424* 1,680,104,405,365 100%
Source: MoFD/Customs Department
*This value (2021) was based on current market value which was collected by the
Department of Macroeconomic and statistics. Because at that time the traders didn’t display
the invoice value of the commodities, the department drived invoice value from the
selling/shelf price of the commodities which shows the invoice value was 40% of the
selling/shelf price whereas 60% selling/shelf price was the cost, profit and loss issues.
Where MV= Marginal Value (Invoice Value)
LMP= Local Market Price
CPL= Cost Profit and Loss
MV=LMP-CPL
Trade Statistical Bulletin 2022
Macroeconomics & Statistics Department Page 11
2.1. Trade Balance: Jan–Dec 2022
Figure 5 below shows the trade balance of Somaliland in the fiscal year of 2022. Somaliland
registered a trade deficit of $1,053,970,217 which is to some extent an underestimation of the true
value, as import values are based on recently collected imports invoice values, and these are
sometimes an under-valuation due to informal import channels and weak commitment by
importers to using the real invoice values.
Figure 5: Net Trade Balance of Somaliland 2022
*This value is derived from computation of Invoice value collected by the Customs
Authorities from importers and traders in the fiscal year of 2022.
The total value of imports in Somaliland Shilling = 9,861,550,990,239
The total value of exports in Somaliland Shilling= 2,483,581,837,415
Equivalent Value of Imports to USD = $ 1,408,767,622 *
Equivalent Value of Exports to USD = $ 354,797,405
The Net Trade Balance of Somaliland = $354,797,405 - $1,408,767,622
= ($ 1,053,970,217)
Appendix 1: Summary of Comparison Imports Jan-December 2021/2022
Tariff Number Description Unit/Measure Quantity 2021 Quantity 2022 Difference %
207 Chicken Meat KGs 2,096,922 2,475,194 378,272 18%
302 Fresh Fish KGs 215,585 7,517 (208,068) -97%
402 Milk Powder KGs 14,081,597 17,252,464 3,170,867 23%
404 Fresh Milk Litters 5,423,186 8,341,978 2,918,792 54%
405 Butter Ghee KGs 1,451,096 971,993 (479,103) -33%
408 Eggs Dozen 25,406 3,483 (21,923) -86%
409 Natural Honey KGs 25,781,686 95,898 (25,685,787) -100%
701 Fresh Vegetable KGs 39,303,068 56,046,334 16,743,266 43%
804 Dates KGs 20,557,560 15,438,609 (5,118,951) -25%
804 Fresh Fruit KGs 14,228,254 15,786,077 1,557,822 11%
807 Resins "Sabiib" KGs 165,422 128,681 (36,741) -22%
901 Coffee KGs 153,783 132,518 (21,265) -14%
902 Coffee Husk KGs 239 5,054 4,815 2015%
904 Tea Leaves KGs 2,311,853 2,898,338 586,485 25%
910 Spices KGs 4,398,540 3,174,089 (1,224,451) -28%
1001 Wheat Bags of 50 KGs 962,411 15,140 (947,271) -98%
1005 Maize Bags of 50 KGs 1,021,621 333,545 (688,075) -67%
1006 Rice Bags of 50 KGs 1,228,683 8,713,632 7,484,949 609%
1007 Sorghum Bags of 50 KGs 125,981 24,426 (101,555) -81%
1008 Beans Bags of 50 KGs 20,236 15,757 (4,479) -22%
1008 Ethiopian Daafi Bags of 50 KGs 5,987 77,586 71,598 1196%
1008 Wheat Husk Bags of 50 KGs 7,018 18,541 11,523 164%
Trade Statistical Bulletin 2022
Macroeconomics & Statistics Department Page 13
Tariff Number Description Unit/Measure Quantity 2021 Quantity 2022 Difference %
1101 Wheat Flour Bags of 50 KGs 1,201,497 5,451,756 4,250,259 354%
1108 Starches Bags of 50 KGs 37 27,733 27,695 74012%
1202 Ground Nuts KGs 10,892 36,609 25,717 236%
1209 Seeds KGs 185,239 100,458 (84,781) -46%
1214 Kat KGs 44,958,197 27,365,947 (17,592,251) -39%
1301 Arabian Gums KGs 467,195 1,007,296 540,101 116%
1513 Non-Edible Oil Litters 1,585,415 1,679,209 93,794 6%
1515 Cooking Oil Litters 59,616,635 62,308,217 2,691,583 5%
1515 Sesame Oil Litters 648,690 467,183 (181,507) -28%
1522 Medicated Oil “Abu-Faas” Litters 9,043 22,308 13,265 147%
1604 Preserved Fish KGs 1,821,987 2,268,662 446,675 25%
1701 Sugar Bags of 50 KGs 2,989,665 12,475,816 9,486,151 317%
1704 Sweet Drops KGs 6,305,456 7,550,701 1,245,245 20%
1704 Chewing Gum KGs 2,030,686 4,365,220 2,334,534 115%
1704 Daaxuuniyad KGs 17,830 25,537 7,707 43%
1901 Custard Powder KGs 230,241 267,970 37,729 16%
1901 Infant Food KGs 66,478 4,281,956 4,215,478 6341%
1902 Pasta/Macaroni KGs 99,355,098 70,860,404 (28,494,694) -29%
1902 Preserved Beans KGs 4,483,611 4,472,774 (10,837) 0%
1904 Corn Flakes KGs 77,783 147,967 70,184 90%
1904 Chips KGs 156,130 235,895 79,765 51%
1904 Oats KGs 1,299,745 1,080,395 (219,350) -17%
1905 Pop Corn KGs 238,854 1,096,969 858,115 359%
Trade Statistical Bulletin 2022
Macroeconomics & Statistics Department Page 14
Tariff Number Description Unit/Measure Quantity 2021 Quantity 2022 Difference %
1905 Biscuits KGs 9,023,601 11,199,266 2,175,665 24%
2002 Tomato Paste KGs 8,777,258 5,497,215 (3,280,043) -37%
2008 Preserved Fruits KGs 32,060 8,251 (23,809) -74%
2101 Nes Coffee KGs 3,373 13,627 10,254 304%
2102 Yeast KGs 718,379 493,248 (225,130) -31%
2104 Soup “Jumbo” KGs 12,440 639,686 627,245 5042%
2105 Ice Cream Powder KGs 262,328 403,179 140,852 54%
2106 Mooniyoos KGs 221,040 20,226,302 20,005,262 9051%
2203 Malt Drinks Litters 1,340,939 1,611,530 270,591 20%
2206 Soft Drinks Litters 14,173,637 13,910,232 (263,405) -2%
2209 Soft Drinks Powder KGs 2,383,863 2,533,149 149,285 6%
2209 Vinegar KGs 1,996 86,731 84,735 4245%
2403 Tobacco KGs 407,601 373,077 (34,524) -8%
2402 Cigarette KGs 6,753,934 6,202,817 (551,117) -8%
2501 Salt KG 1,033,794 287,354 (746,440) -72%
2523 Cements Bags 7,312,604 9,001,802 1,689,198 23%
2524 Limestone "Nuurad" Bags 515 1,754 1,239 241%
2710 Gas Oil M3
131,093 149,978 18,884 14%
2710 Mogas "Petrol" M3
100,482 81,831 (18,651) -19%
2710 Jet A1 M3
6,132 7,305 1,173 19%
2710 Kerosene M3
2,259 2,524 265 12%
2710 Lubricants/Oil Litters/KGs 5,761,819 7,807,669 2,045,850 36%
Trade Statistical Bulletin 2022
Macroeconomics & Statistics Department Page 15
Tariff Number Description Unit/Measure Quantity 2021 Quantity 2022 Difference %
2711 Butane Gas Litters 73,869 5,440 (68,429) -93%
2715 Bituminous Tons 622 2,013 1,391 224%
2806 Acid Litters 88,319 60,249 (28,070) -32%
2807 Distilled Water Litters 162,813 108,868 (53,944) -33%
2915 Organic Chemicals KGs 241,877 18,596 (223,281) -92%
3004 Medicines Vials/Tabs/Bottles 40,464,647 12,769,478 (27,695,169) -68%
3004 Medical Equipment Pcs 656,378 905,748 249,370 38%
3204 Dye Litters 58,483 5,741 (52,742) -90%
3210 Paint/Distemper Litters/KGs 5,017,637 5,017,640 3 0%
3214 Putty KGs 1,035,519 630,660 (404,858) -39%
3215 Printer/Photocopy Inks Pcs 39,314 42,244 2,930 7%
3301 Cosmetics Litters/KGs 3,698,302 3,797,465 99,164 3%
3304 Toilet Perfume Litters 434,703 554,270 119,566 28%
3304 Tooth Paste KGs 143,495 206,610 63,114 44%
3305 Shampoo Litters 432,804 906,462 473,658 109%
3307 Uunsi KGs 74,134 38,878 (35,256) -48%
3307 Jaawi KGs 611 21,140 20,529 3360%
3401 Toilet Soap KGs 455,059 985,843 530,784 117%
3401 Laundry Soap KGs 7,817,985 5,962,793 (1,855,192) -24%
3401 Powder Soap KGs 2,321,509 6,511,928 4,190,419 181%
3401 Liquid Detergent Litters 145,027 63,367 (81,659) -56%
3405 Boot Polish KGs 63,200 63,260 60 0%
3405 Wood Polish KGs 113,974 89,972 (24,002) -21%
Trade Statistical Bulletin 2022
Macroeconomics & Statistics Department Page 16
Tariff Number Description Unit/Measure Quantity 2021 Quantity 2022 Difference %
3406 Candles KGs 55,179 77,308 22,129 40%
3506 Glue KGs 461,534 378,718 (82,816) -18%
3604 Matches Gross 37,471 130,895 93,424 249%
3702 Film Rolls Pcs 136,931 117,794 (19,137) -14%
3808 Insecticide Litters 186,677 226,605 39,928 21%
3810 Brazing KGs 590 212,670 212,080 35934%
3814 Thinner Litters 162,716 165,678 2,962 2%
3917 Plastic Pipes “P.V.C” Pcs 266,038 310,006 43,968 17%
3917 Plastic Hose Pipe Meters 534,601 559,805 25,204 5%
3920 Plastic Sheet Meters 4,153,959 4,188,720 34,761 1%
3921 Plothylene Mats Pcs 1,320,547 752,762 (567,785) -43%
3921 Plothlene Shopping Bags Gross 236,961 385,109 148,147 63%
3923 Plastic Material Dozen/Pcs 3,431,787 2,381,618 (1,050,169) -31%
3923 Empty Bottles Pcs 1,368,704 1,670,997 302,293 22%
3926 Plastic Bangles/Ear Rings Doz/Gross 127,195 80,425 (46,769) -37%
4009.1 Hose Pipes “Rubber” Meters 110,481 910,702 800,221 724%
4011 Rubber Tyres Pcs 666,661 771,832 105,171 16%
4011 Rubber Tubes Pcs 355,742 369,666 13,924 4%
4014 Rubber Teats Gross 23,858 198,654 174,796 733%
4016 Car Mats Dozen 695 90,281 89,586 12886%
4016 Rubber Band CTN 7,746 5,891 (1,855) -24%
4104 Maas KGs 385 3,811 3,426 890%
4202 Suit Case & Hand Bags Dozen/Pcs 229,390 277,501 48,111 21%
Trade Statistical Bulletin 2022
Macroeconomics & Statistics Department Page 17
Tariff Number Description Unit/Measure Quantity 2021 Quantity 2022 Difference %
4407 Timber Wood M3
49,774 51,828 2,053 4%
4407.2 Wooden Posts Pcs 379,296 105,030 (274,266) -72%
4407.3 Articles of Wood Pcs 109,412 203,179 93,767 86%
4407.5 Ceiling Hardboard Pcs 441,399 273,141 (168,258) -38%
4412.13 Ply Wood Pcs 410,818 410,969 151 0%
4601 Praying Mats Dozen 1,406 2,482 1,076 76%
4602 Hand Brooms Dozen 2,172 36,854 34,683 1597%
4802 Stationary Reams/Dozens 1,887,746 2,783,486 895,740 47%
4818 Napkin Tissue/Toilet Papers Dozen/PKT 316,460 387,174 70,713 22%
4819 Empty Cartons Pcs 85,131 27,580 (57,551) -68%
4820 Exercise Books Dozens 71,277 29,437 (41,840) -59%
4901 Text Books Dozen 121,287 270,342 149,054 123%
4902 Old Newspapers KGs 246,075 412,834 166,759 68%
4907 Sim Cards Pcs 1,424,182 2,261,048 836,866 59%
4910 Calenders Dozens 1,129 433 (695) -62%
5204 Sewing Thread BKT 8,018 127,558 119,540 1491%
5513 Unstitched Cloths Yards 144,032,777 136,172,320 (7,860,457) -5%
5607 Nylon Ropes Rolls 1,515,476 1,695,457 179,981 12%
5701 Carpets Meters 614,658 874,529 259,870 42%
5705 Door Mats " Dacsado" Dozen 50,781 496,786 446,005 878%
5803 Children Bombers Dozen 18,294,608 8,373,287 (9,921,321) -54%
5803 Mosquito Net Pcs 22,555 125,126 102,571 455%
Trade Statistical Bulletin 2022
Macroeconomics & Statistics Department Page 18
Tariff Number Description Unit/Measure Quantity 2021 Quantity 2022 Difference %
5904 Linoleum "Shamac" Meters 4,618,713 4,583,546 (35,167) -1%
5908 Wicks Dozen 8,342,121 3,030,691 (5,311,430) -64%
6203 Men's Jackets Pcs 472,246 167,180 (305,066) -65%
6205 Stitched Clothes Dozen 3,948,401 2,951,973 (996,428) -25%
6207 Stitched Clothes Scores 866,504 380,304 (486,200) -56%
6217 Belts Dozen 126,307 41,464 (84,842) -67%
6301 Blankets Pcs 1,558,157 1,216,600 (341,557) -22%
6309 Used Clothes Bundles 24,458 147,374 122,916 503%
6302 Bed Sheets Scores 310,805 113,928 (196,877) -63%
6303 Ready Made Curtains Yards 373,483 256,699 (116,785) -31%
6305 Empty Gunny Bags Pcs 47,700 44,604 (3,096) -6%
6309 Used Shoes Bundles 158,459 124,097 (34,363) -22%
6403 Rubber Sandals Dozen 1,284,896 917,010 (367,886) -29%
6403 Plastic Sandals/Shoes Dozen 582,107 932,247 350,140 60%
6403 Leather Shoes Dozen 238,148 122,331 (115,817) -49%
6501 Arabian Hats Dozen 59,367 59,428 61 0%
6601 Umbrellas Dozen 995 7,495 6,499 653%
6602 Walking Sticks Dozen 13,300 12,392 (908) -7%
6702 Artificial Flowers Pcs 94,188 81,330 (12,858) -14%
6811 Burjiko Pcs 276,107 119,801 (156,305) -57%
6904 Floor Tiles SQ Meters 2,253,648 3,697,804 1,444,157 64%
6905 Gypsum Ceiling "Roof Tiles" SQ Meter 2,140,092 321,947 (1,818,144) -85%
6910 Toilet Basins Pcs 63,553 61,109 (2,443) -4%
Trade Statistical Bulletin 2022
Macroeconomics & Statistics Department Page 19
Tariff Number Description Unit/Measure Quantity 2021 Quantity 2022 Difference %
6911 Broceiling Ware Sets 121,999 90,409 (31,590) -26%
7000 Toilet Mirror Pcs 36,973 52,112 15,139 41%
7003 Looking Mirror Dozen 70,540 39,096 (31,444) -45%
7003 Glass Sheet SQ Meter 191,792 323,462 131,670 69%
7011 Electric Bulbs Dozen 517,294 577,511 60,218 12%
7011 Torch Bulbs CTN 33 28,177 28,144 85286%
7013 Glass Ware Dozen 221,922 869,832 647,910 292%
7018 Glass Marbles Gross 948 68,772 67,824 7151%
7117 Jewelry Gross 6,701 7,157 456 7%
7208 Flat Bars “Bayaati” Pcs 215,123 148,697 (66,426) -31%
7216 U Shaped Channels Pcs - 116,168 116,168 #DIV/0!
7222 Iron Bars Tons 23,540 43,367 19,827 84%
7222 Bending Wire KGs 933,988 724,078 (209,910) -22%
7301 Iron Sheets Pcs 3,641,124 3,336,670 (304,454) -8%
7301 Square Tubes Pcs 1,102,841 1,221,873 119,032 11%
7301 M.S Sheet Pcs 2,955 80,161 77,206 2613%
7306 Angular Bars Pcs 279,855 190,107 (89,748) -32%
7306 G.Iron Pipes Pcs 75,167 147,944 72,777 97%
7306 Water Pipe Fittings Dozens 8,997 18,197 9,200 102%
7306 Furniture Pipes Pcs 878,908 912,569 33,661 4%
7310 Empty Iron Drums Pcs 6,540 176,038 169,498 2592%
7310 Iron Tanks Pcs 39 27 (12) -31%
7313 Barberd Fencing Wire KGs 487,204 813,686 326,482 67%
Trade Statistical Bulletin 2022
Macroeconomics & Statistics Department Page 20
Tariff Number Description Unit/Measure Quantity 2021 Quantity 2022 Difference %
7314 Cross Section Wire KGs 91,995 347,818 255,823 278%
7314 Iron Net "X-pin" Sheet 7,050 70,618 63,568 902%
7314 Iron Net for Windows (Mosquito) Meters 1,143 105,286 104,143 9111%
7315 Ordinary Chains Meters 3,675 86,549 82,874 2255%
7317 Iron Nails KGs 2,849,871 3,178,089 328,217 12%
7321 Kerosene Stoves Pcs 1,092 10,758 9,666 885%
7321 Butane Gas Cooking Pcs 3,760 6,778 3,018 80%
7323 Enamel Ware Dozen 429,923 794,147 364,223 85%
7323 Stainless Steel Ware KGs 1,133,719 749,811 (383,909) -34%
7323 Iron Charcoal Pcs 336 - (336) -100%
7610 Aluminum Frames KGs 150,230 56,423 (93,807) -62%
7615 Aluminum Ware KGs 4,204,189 4,488,939 284,750 7%
7617 Foil Paper Rolls 232,040 178,650 (53,390) -23%
8105 Scrap Tons 80,167 61,900 (18,267) -23%
8201 Hand Tools Dozen 2,096,777 1,502,432 (594,344) -28%
8210 Wheel Barrows Pcs 20,414 316,295 295,881 1449%
8212 Razor Blades Pcs - 40,734 40,734 #DIV/0!
8301 Locks Dozen 63,783 63,223 (560) -1%
8302 Hinges/Hand raps Dozen 20,285 83,794 63,509 313%
8303 Safes Pcs 139,013 102,275 (36,738) -26%
8311 Welding Rods KGs 51 - (51) -100%
8401 Machines Unit 215,676 1,252,151 1,036,475 481%
8414 Electric Fans Pcs 44,960 57,733 12,773 28%
Trade Statistical Bulletin 2022
Macroeconomics & Statistics Department Page 21
Tariff Number Description Unit/Measure Quantity 2021 Quantity 2022 Difference %
8414 Jacks & Pulley Tackles Pcs 918 6,240 5,322 580%
8415 Air Condition Pcs 12,528 495,808 483,280 3858%
8416 Electric Cookers Pcs 22,226 27,653 5,427 24%
8418 Refrigerators/Freezers Pcs 31,266 71,957 40,692 130%
8442 Photocopy Machine Pcs 33 23,581 23,548 71357%
8471 Computer & Accessories Pcs 493,098 262,974 (230,125) -47%
8501 Electric Generators Units 25,596 66,161 40,565 158%
8504 Transformers “Regulators” Pcs 3,114 7,924 4,810 154%
8506 Dry Cell Battery Dozen 6,657,918 3,822,242 (2,835,677) -43%
8506 Car Battery Pcs 347,364 225,414 (121,949) -35%
8509 Electric Appliance Pcs 863,997 537,344 (326,653) -38%
8513 Torches Dozen 470,696 406,652 (64,044) -14%
8516 Electric Iron Pcs 195 11,555 11,360 5826%
8517 Telecommunication Parts Items 2,022,357 2,348,496 326,139 16%
8518 Loud Speakers Pcs 9,567 795,841 786,274 8219%
8519 Radio Recorders Pcs 87,992 29,815 (58,177) -66%
8519 Cassettes for Recorders Dozen/Pcs 36,340 8,694 (27,646) -76%
8525 Cameras Pcs 1,544 4,677 3,133 203%
8526 T.V Accessories Pcs 1,200,510 844,606 (355,903) -30%
8536 Electric Fittings Dozen 254,047 227,481 (26,566) -10%
8541 Solar Pcs 133,344 87,772 (45,572) -34%
8544 Wires and Cables Meters 11,252,791 13,349,327 2,096,537 19%
8701 Tractors Units 261 799 538 206%
Trade Statistical Bulletin 2022
Macroeconomics & Statistics Department Page 22
Tariff Number Description Unit/Measure Quantity 2021 Quantity 2022 Difference %
8703 Pick Up Cars Units 1,172 901 (271) -23%
8703 Station Wagon Units 972 1,020 48 5%
8703 Passenger Buses Units 2,390 8,094 5,704 239%
8703 Trucks Units 1,874 2,653 779 42%
8703 Saloon Cars Units 4,977 3,173 (1,804) -36%
8708 Spare Parts Items 3,650,783 3,710,676 59,893 2%
8712 Bicycles Units 16,931 10,743 (6,188) -37%
8714 Motor Cycles Units 5,356 29,413 24,057 449%
8715 Baby Walkers Pcs 112,836 27,038 (85,797) -76%
9001 Sunglass Dozen 206,589 117,825 (88,765) -43%
9006 Photographic Camera Pcs 2,587 4,475 1,889 73%
9022 X-ray Units 680 12,462 11,782 1734%
9102 Baby Watches Dozen 25,076 21,809 (3,268) -13%
9102 Watches Dozen 15,518 19,507 3,989 26%
9105 Clocks Pcs 4,424 4,220 (204) -5%
9201 Music Instrument Pcs 42,915 45,291 2,376 6%
9401 Furniture Pcs 509,897 1,048,584 38,687 106%
9402 Hospital Beds Pcs 2,492 445 (2,047) -82%
9405 Hurricane Lamps Dozen 9 - (9) -100%
9405 Glass For Lamps Dozen 1 460 459 34486%
9501 Toys Dozen 128,678 132,652 3,975 3%
9504 Games Sets 15,880 149,960 134,079 844%
9506 Sport Equipment Pcs 238,364 118,912 (119,453) -50%
9601 Miscellaneous Dozen 6,067,280 6,143,474 76,195 1%
Appendix 2: Summary of Import Goods Jan-December 2022
Tariff Number Description Unit/Measure Quantity Value Duties
207 Chicken Meat KGs 2,475,194 57,176,986,944 5,277,987,801
302 Fresh Fish KGs 7,517 79,980,880 65,992,758
402 Milk Powder KGs 17,252,464 329,694,586,658 27,778,466,389
404 Fresh Milk Litters 8,341,978 49,634,769,695 8,927,809,246
405 Butter Ghee KGs 971,993 11,022,397,218 1,020,225,362
408 Eggs Dozen 3,483 177,633,000 28,161,198
409 Natural Honey KGs 95,898 1,564,104,046 79,987,431
701 Fresh Vegetable KGs 56,046,334 168,699,464,317 10,612,408,385
804 Dates KGs 15,438,609 37,824,592,540 11,389,356,469
804 Fresh Fruit KGs 15,786,077 176,804,057,920 6,292,601,377
807 Resins "Sabiib" KGs 128,681 909,777,498 213,281,782
901 Coffee KGs 132,518 5,101,926,830 721,306,353
902 Coffee Husk KGs 5,054 32,901,540 7,756,765
904 Tea Leaves KGs 2,898,338 47,271,896,368 3,803,235,409
910 Spices KGs 3,174,089 48,880,973,064 6,070,830,380
1001 Wheat Bags of 50 KGs 15,140 1,271,767,560 54,432,966
1005 Maize Bags of 50 KGs 333,545 25,099,280,815 1,525,873,298
1006 Rice Bags of 50 KGs 8,713,632 860,035,441,881 55,801,868,994
1007 Sorghum Bags of 50 KGs 24,426 1,838,064,025 87,147,333
1008 Beans Bags of 50 KGs 15,757 666,193,276 54,495,726
1008 Ethiopian Daafi Bags of 50 KGs 77,586 4,996,507,488 168,632,878
1008 Wheat Husk Bags of 50 KGs 18,541 868,278,776 17,822,230
Trade Statistical Bulletin 2022
Macroeconomics & Statistics Department Page 24
Tariff Number Description Unit/Measure Quantity Value Duties
1101 Wheat Flour Bags of 50 KGs 5,451,756 220,959,673,517 32,728,059,972
1108 Starches Bags of 50 KGs 27,733 537,735,890 142,848,295
1202 Ground Nuts KGs 36,609 33,314,263 11,081,667
1209 Seeds KGs 100,458 267,217,482 61,419,542
1214 Kat KGs 27,365,947 746,132,531,323 275,522,832,322
1301 Arabian Gums KGs 1,007,296 1,339,703,680 247,772,678
1513 Non-Edible Oil Litters 1,679,209 2,468,437,304 2,550,001,582
1515 Cooking Oil Litters 62,308,217 379,457,043,357 38,220,267,497
1515 Sesame Oil Litters 467,183 3,630,012,920 307,942,617
1522 Medicated Oil “Abu-Faas” Litters 22,308 281,080,800 92,253,995
1604 Preserved Fish KGs 2,268,662 22,550,496,900 9,568,760,376
1701 Sugar Bags of 50 KGs 12,475,816 710,872,004,797 116,148,252,858
1704 Sweet Drops KGs 7,550,701 16,385,022,212 4,656,835,964
1704 Chewing Gum KGs 4,365,220 7,028,003,910 2,876,718,417
1704 Daaxuuniyad KGs 25,537 28,601,194 111,477,573
1901 Custard Powder KGs 267,970 2,457,280,865 567,646,667
1901 Infant Food KGs 4,281,956 22,480,270,260 3,361,285,376
1902 Pasta/Macaroni KGs 70,860,404 188,488,673,682 52,710,553,973
1902 Preserved Beans KGs 4,472,774 45,874,871,527 5,069,847,124
1904 Corn Flakes KGs 147,967 1,149,702,891 279,283,612
1904 Chips KGs 235,895 2,658,531,579 400,942,853
1904 Oats KGs 1,080,395 11,873,536,764 1,429,619,612
1905 Pop Corn KGs 1,096,969 9,905,629,619 1,193,454,659
Trade Statistical Bulletin 2022
Macroeconomics & Statistics Department Page 25
Tariff Number Description Unit/Measure Quantity Value Duties
1905 Biscuits KGs 11,199,266 177,956,329,907 10,849,405,466
2002 Tomato Paste KGs 5,497,215 51,563,876,325 8,480,418,462
2008 Preserved Fruits KGs 8,251 101,074,750 8,162,496
2101 Nes Coffee KGs 13,627 176,473,535 67,759,331
2102 Yeast KGs 493,248 11,152,345,646 582,758,129
2104 Soup “Jumbo” KGs 639,686 29,060,927,711 1,178,026,097
2105 Ice Cream Powder KGs 403,179 2,201,358,541 525,842,296
2106 Mooniyoos KGs 20,226,302 42,475,234,242 33,551,470,600
2203 Malt Drinks Litters 1,611,530 6,768,427,176 4,369,315,524
2206 Soft Drinks Litters 13,910,232 56,475,541,189 20,905,174,588
2209 Soft Drinks Powder KGs 2,533,149 26,420,739,064 4,727,972,386
2209 Vinegar KGs 86,731 121,423,148 237,605,230
2403 Tobacco KGs 373,077 2,715,997,648 5,533,120,416
2402 Cigarette KGs 6,202,817 207,980,454,010 125,008,700,980
2501 Salt KG 287,354 362,065,864 453,170,303
2523 Cements Bags 9,001,802 220,544,156,105 34,943,682,302
2524 Limestone "Nuurad" Bags 1,754 18,419,100 5,154,519
2710 Gas Oil M3
149,978 146,978,116,600 14,978,394,504
2710 Mogas "Petrol" M3
81,831 85,922,508,000 12,792,053,826
2710 Jet A1 M3
7,305 12,762,902,369 580,282,429
2710 Kerosene M3
2,524 30,037,742,000 527,744,214
2710 Lubricants/Oil Litters/KGs 7,807,669 68,317,102,613 8,477,299,105
Trade Statistical Bulletin 2022
Macroeconomics & Statistics Department Page 26
Tariff Number Description Unit/Measure Quantity Value Duties
2711 Butane Gas Litters 5,440 68,541,732 179,474,933
2715 Bituminous Tons 2,013 939,354,500 213,695,666
2806 Acid Litters 60,249 21,087,136 65,837,116
2807 Distilled Water Litters 108,868 642,685,610 38,860,786
2915 Organic Chemicals KGs 18,596 328,034,498 64,535,760
3004 Medicines Vials/Tabs/Bottles 12,769,478 52,737,944,677 4,451,596,663
3004 Medical Equipment Pcs 905,748 56,998,724,157 2,469,522,210
3204 Dye Litters 5,741 32,149,600 5,643,912
3210 Paint/Distemper Litters/KGs 5,017,640 96,765,184,507 8,337,532,292
3214 Putty KGs 630,660 485,608,269 958,330,715
3215 Printer/Photocopy Inks Pcs 42,244 487,921,434 443,733,287
3301 Cosmetics Litters/KGs 3,797,465 32,696,177,352 21,948,019,898
3304 Toilet Perfume Litters 554,270 6,945,000,218 5,038,848,450
3304 Tooth Paste KGs 206,610 289,253,398 2,072,797,420
3305 Shampoo Litters 906,462 1,586,308,640 2,631,614,055
3307 Uunsi KGs 38,878 258,535,907 46,938,431
3307 Jaawi KGs 21,140 9,470,536 30,425,392
3401 Toilet Soap KGs 985,843 13,180,724,386 1,931,561,548
3401 Laundry Soap KGs 5,962,793 47,583,084,948 5,083,235,274
3401 Powder Soap KGs 6,511,928 65,640,230,208 5,174,573,735
3401 Liquid Detergent Litters 63,367 527,848,360 122,344,376
3405 Boot Polish KGs 63,260 199,269,189 185,371,300
3405 Wood Polish KGs 89,972 107,066,406 147,508,690
Trade Statistical Bulletin 2022
Macroeconomics & Statistics Department Page 27
Tariff Number Description Unit/Measure Quantity Value Duties
3406 Candles KGs 77,308 324,691,710 128,622,669
3506 Glue KGs 378,718 3,313,780,225 896,420,067
3604 Matches Gross 130,895 407,610,590 283,616,047
3702 Film Rolls Pcs 117,794 98,946,725 291,745,769
3808 Insecticide Litters 226,605 1,380,025,668 160,218,853
3810 Brazing KGs 212,670 794,215,742 157,313,660
3814 Thinner Litters 165,678 788,627,280 166,294,646
3917 Plastic Pipes “P.V.C” Pcs 310,006 4,752,395,046 1,794,384,429
3917 Plastic Hose Pipe Meters 559,805 10,149,267,913 204,243,248
3920 Plastic Sheet Meters 4,188,720 2,932,104,077 1,414,761,475
3921 Plothylene Mats Pcs 752,762 4,268,159,576 1,760,497,600
3921 Plothlene Shopping Bags Gross 385,109 3,504,489,716 293,560,341
3923 Plastic Material Dozen/Pcs 2,381,618 12,336,780,515 3,887,193,824
3923 Empty Bottles Pcs 1,670,997 1,169,698,152 1,199,690,034
3926 Plastic Bangles/Ear Rings Doz/Gross 80,425 144,685,439 129,140,007
4009.1 Hose Pipes “Rubber” Meters 910,702 10,072,365,226 399,822,182
4011 Rubber Tyres Pcs 771,832 106,435,632,800 39,963,861,693
4011 Rubber Tubes Pcs 369,666 14,076,881,280 1,265,561,150
4014 Rubber Teats Gross 198,654 4,489,100,142 152,638,597
4016 Car Mats Dozen 90,281 473,977,140 99,475,403
4016 Rubber Band CTN 5,891 65,151,142 82,909,143
4104 Maas KGs 3,811 109,846,471 63,156,870
4202 Suit Case & Hand Bags Dozen/Pcs 277,501 5,167,067,317 3,196,729,456
Trade Statistical Bulletin 2022
Macroeconomics & Statistics Department Page 28
Tariff Number Description Unit/Measure Quantity Value Duties
4407 Timber Wood M3
51,828 4,963,021,510 15,185,021,807
4407.2 Wooden Posts Pcs 105,030 2,082,091,571 2,711,967,397
4407.3 Articles of Wood Pcs 203,179 1,564,478,377 702,862,907
4407.5 Ceiling Hardboard Pcs 273,141 3,938,693,220 2,000,116,277
4412.13 Ply Wood Pcs 410,969 7,796,081,930 3,838,421,778
4601 Praying Mats Dozen 2,482 178,959,410 20,762,843
4602 Hand Brooms Dozen 36,854 185,746,579 35,264,997
4802 Stationary Reams/Dozens 2,783,486 4,091,724,846 3,465,471,709
4818 Napkin Tissue/Toilet Papers Dozen/PKT 387,174 4,390,547,603 329,729,285
4819 Empty Cartons Pcs 27,580 154,447,384 63,041,498
4820 Exercise Books Dozens 29,437 103,028,170 185,595,642
4901 Text Books Dozen 270,342 2,460,109,197 771,465,503
4902 Old Newspapers KGs 412,834 924,748,160 251,570,543
4907 Sim Cards Pcs 2,261,048 3,046,762,625 365,599,250
4910 Calendars Dozens 433 303,240 1,907,785
5204 Sewing Thread BKT 127,558 696,465,970 92,767,004
5513 Unstitched Cloths Yards 136,172,320 219,237,434,508 37,422,120,724
5607 Nylon Ropes Rolls 1,695,457 10,800,061,472 497,931,813
5701 Carpets Meters 874,529 11,876,099,203 8,160,050,650
5705 Door Mats " Dacsado" Dozen 496,786 3,860,029,473 261,589,642
5803 Children Bombers Dozen 8,373,287 97,883,723,043 2,554,591,240
5803 Mosquito Net Pcs 125,126 446,699,213 220,184,574
Trade Statistical Bulletin 2022
Macroeconomics & Statistics Department Page 29
Tariff Number Description Unit/Measure Quantity Value Duties
5904 linoleum "Shamac" Meters 4,583,546 15,400,714,963 3,940,332,712
5908 Wicks Dozen 3,030,691 11,880,309,347 154,341,454
6203 Men's Jackets Pcs 167,180 1,521,339,274 909,626,406
6205 Stitched Clothes Dozen 2,951,973 107,245,172,187 23,863,957,853
6207 Stitched Clothes Scores 380,304 7,320,853,348 4,122,502,844
6217 Belts Dozen 41,464 362,814,113 231,055,456
6301 Blankets Pcs 1,216,600 23,589,879,623 8,758,016,648
6309 Used Clothes Bundles 147,374 31,165,249,565 4,273,296,532
6302 Bed Sheets Scores 113,928 1,228,145,996 509,870,289
6303 Ready Made Curtains Yards 256,699 2,210,176,840 500,485,293
6305 Empty Gunny Bags Pcs 44,604 237,293,280 150,388,521
6309 Used Shoes Bundles 124,097 9,373,008,645 3,029,744,831
6403 Rubber Sandals Dozen 917,010 8,665,743,555 8,897,189,734
6403 Plastic Sandals/Shoes Dozen 932,247 15,727,004,866 9,244,113,188
6403 Leather Shoes Dozen 122,331 3,939,043,388 2,756,574,912
6501 Arabian Hats Dozen 59,428 507,515,632 543,445,069
6601 Umbrellas Dozen 7,495 142,175,787 106,242,964
6602 Walking Sticks Dozen 12,392 93,681,857 183,004,366
6702 Artificial Flowers Pcs 81,330 927,973,246 262,244,885
6811 Burjiko Pcs 119,801 1,576,586,556 312,621,581
6904 Floor Tiles SQ Meters 3,697,804 54,357,724,974 17,838,230,476
6905 Gypsum Ceiling "Roof Tiles" SQ Meter 321,947 5,228,426,263 1,710,185,697
6910 Toilet Basins Pcs 61,109 11,977,397,320 1,900,338,487
Trade Statistical Bulletin 2022
Macroeconomics & Statistics Department Page 30
Tariff Number Description Unit/Measure Quantity Value Duties
6911 Broceiling Ware Sets 90,409 1,961,870,743 918,217,610
7000 Toilet Mirror Pcs 52,112 3,414,378,240 491,564,748
7003 Looking Mirror Dozen 39,096 158,728,055 250,963,221
7003 Glass Sheet SQ Meter 323,462 6,520,990,493 1,095,405,304
7011 Electric Bulbs Dozen 577,511 33,876,814,618 10,083,884,012
7011 Torch Bulbs CTN 28,177 1,232,756,875 27,271,582
7013 Glass Ware Dozen 869,832 75,257,877,618 4,541,835,657
7018 Glass Marbles Gross 68,772 - 312,905,134
7117 Jewelry Gross 7,157 370,242,991 175,207,082
7208 Flat Bars “Bayaati” Pcs 148,697 5,142,983,139 160,093,929
7216 U Shaped Channels Pcs 116,168 73,267,157,600 139,174,281
7222 Iron Bars Tons 43,367 51,074,555,799 26,193,940,872
7222 Bending Wire KGs 724,078 4,115,659,352 519,808,515
7301 Iron Sheets Pcs 3,336,670 71,307,974,570 14,690,062,755
7301 Square Tubes Pcs 1,221,873 93,057,847,680 3,755,613,471
7301 M.S Sheet Pcs 80,161 19,229,822,290 313,939,141
7306 Angular Bars Pcs 190,107 8,410,330,583 411,198,384
7306 G.Iron Pipes Pcs 147,944 27,671,445,760 706,945,107
7306 Water Pipe Fittings Dozens 18,197 1,659,736,513 73,910,893
7306 Furniture Pipes Pcs 912,569 16,992,025,656 43,674,817
7310 Empty Iron Drums Pcs 176,038 83,929,637,260 210,241,564
7310 Iron Tanks Pcs 27 56,700,000 55,391,493
7313 Barberd Fencing Wire KGs 813,686 4,442,726,106 823,702,483
Trade Statistical Bulletin 2022
Macroeconomics & Statistics Department Page 31
Tariff Number Description Unit/Measure Quantity Value Duties
7314 Cross Section Wire KGs 347,818 4,955,277,374 474,927,765
7314 Iron Net "X-pin" Sheet 70,618 3,954,591,200 273,804,854
7314 Iron Net for Windows(Mosquito) Meters 105,286 3,390,209,200 139,637,986
7315 Ordinary Chains Meters 86,549 193,870,723 63,347,440
7317 Iron Nails KGs 3,178,089 17,111,566,608 3,738,950,639
7321 Kerosene Stoves Pcs 10,758 13,699,667,520 43,828,736
7321 Butane Gas Cooking Pcs 6,778 909,725,736 344,403,303
7323 Enamel Ware Dozen 794,147 44,249,854,681 2,392,862,071
7323 Stainless Steel Ware KGs 749,811 13,751,526,771 2,587,034,199
7610 Aluminum Frames KGs 56,423 3,025,401,260 400,928,551
7615 Aluminum Ware KGs 4,488,939 81,070,245,564 3,748,125,893
7617 Foil Paper Rolls 178,650 2,050,365,514 31,177,323
8105 Scrap Tons 61,900 61,199,371,094 727,495,068
8201 Hand Tools Dozen 1,502,432 86,975,812,794 6,206,918,937
8210 Wheel Barrows Pcs 316,295 36,033,943,192 1,101,199,790
8212 Razor Blades Pcs 40,734 354,996,810 59,204,480
8301 Locks Dozen 63,223 13,542,351,606 463,696,232
8302 Hinges/Hand raps Dozen 83,794 9,490,540,153 298,309,130
8303 Safes Pcs 102,275 28,336,217,300 661,231,074
8401 Machines Unit 1,252,151 414,324,363,510 7,805,069,115
8414 Electric Fans Pcs 57,733 3,823,066,016 2,001,133,938
8414 Jacks & Pulley Tackles Pcs 6,240 5,284,406,400 1,304,222,279
8415 Air Condition Pcs 495,808 195,085,377,025 3,145,561,657
Trade Statistical Bulletin 2022
Macroeconomics & Statistics Department Page 32
Tariff Number Description Unit/Measure Quantity Value Duties
8416 Electric Cookers Pcs 27,653 7,806,718,430 1,881,972,956
8418 Refrigerators/Freezers Pcs 71,957 48,168,788,923 4,085,586,932
8442 Photocopy Machine Pcs 23,581 14,842,723,930 295,661,352
8471 Computer & Accessories Pcs 262,974 24,298,780,044 8,730,040,008
8501 Electric Generators Units 66,161 92,625,666,000 3,555,876,733
8504 Transformers “Regulators” Pcs 7,924 3,605,420,000 225,353,169
8506 Dry Cell Battery Dozen 3,822,242 69,029,681,490 1,948,596,422
8506 Car Battery Pcs 225,414 49,246,283,968 6,635,033,775
8509 Electric Appliance Pcs 537,344 38,554,421,955 5,575,333,545
8513 Torches Dozen 406,652 17,990,274,747 2,910,020,132
8516 Electric Iron Pcs 11,555 467,535,125 120,550,233
8517 Telecommunication Parts Items 2,348,496 266,319,487,224 17,850,604,677
8518 Loud Speakers Pcs 795,841 12,868,743,149 877,994,270
8519 Radio Recorders Pcs 29,815 417,414 386,308,655
8519 Cassettes for Recorders Dozen/Pcs 8,694 852,021,800 304,501,774
8525 Cameras Pcs 4,677 173,844,090 2,395,837,708
8526 T.V Accessories Pcs 844,606 89,925,223,179 4,328,547,544
8536 Electric Fittings Dozen 227,481 19,554,263,322 1,495,503,807
8541 Solar Pcs 87,772 14,807,119,530 3,833,899,713
8544 Wires and Cables Meters 13,349,327 36,443,663,666 7,450,976,376
8701 Tractors Units 799 3,494,206,897 422,801,608
8703 Pick Up Cars Units 901 75,684,000,000 2,845,143,514
8703 Station Wagon Units 1,020 107,100,000,000 22,737,916,620
Trade Statistical Bulletin 2022
Macroeconomics & Statistics Department Page 33
Tariff Number Description Unit/Measure Quantity Value Duties
8703 Passenger Buses Units 8,094 215,296,410,000 3,769,701,152
8703 Trucks Units 2,653 41,993,688,874 11,873,160,078
8703 Saloon Cars Units 3,173 44,422,000,000 36,462,348,718
8708 Spare Parts Items 3,710,676 60,521,127,191 13,855,901,437
8712 Bicycles Units 10,743 639,208,500 643,611,564
8714 Motor Cycles Units 29,413 7,784,651,369 5,269,261,536
8715 Baby Walkers Pcs 27,038 824,116,239 267,204,387
9001 Sunglass Dozen 117,825 3,579,516,513 632,297,935
9006 Photographic Camera Pcs 4,475 898,435,129 98,905,323
9022 X-ray Units 12,462 11,427,626,490 541,436,740
9102 Baby Watches Dozen 21,809 610,639,960 44,375,341
9102 Watches Dozen 19,507 669,105,192 377,418,910
9105 Clocks Pcs 4,220 109,213,575 75,745,467
9201 Music Instrument Pcs 45,291 279,511,662 143,060,503
9401 Furniture Pcs 1,048,584 125,662,300,568 18,443,778,680
9402 Hospital Beds Pcs 445 6,634,950 19,237,438
9405 Glass For Lamps Dozen 460 19,674,200 2,853,642
9501 Toys Dozen 132,652 7,994,947,491 1,406,673,244
9504 Games Sets 149,960 13,793,274,810 456,196,999
9506 Sport Equipment Pcs 118,912 8,182,307,196 612,267,844
9601 Miscellaneous Dozen 6,143,474 29,242,937,954 9,299,921,309
Trade Statistical Bulletin 2022
Macroeconomics & Statistics Department Page 34
Appendix 3: Number of Containers imported from Global Countries 2021/2022
No. Country name Container 2021 Container 2022 Diff %
1 UNITED ARAB EMIRATES 8,705 12,833 4,128 47%
2 CHINA 7,545 6,440 -1,105 -15%
3 TURKEY 5,909 6,211 302 5%
4 INDIA 8,027 5,339 -2,688 -33%
5 SAUDI ARABIA 3,166 3,304 138 4%
6 Others (NOT CLEAR) 259 2,197 1,213 468%
7 UNITED STATES 711 836 125 18%
8 BRAZIL 901 773 -128 -14%
9 EGYPT 765 706 -59 -8%
10 MALAYSIA 1,697 583 -1,114 -66%
11 KENYA 410 572 162 40%
12 PAKISTAN 460 543 83 18%
13 INDONESIA 634 390 -244 -38%
14 OMAN 191 344 153 80%
15 ITALY 296 294 -2 -1%
16 THAILAND 218 231 13 6%
17 SPAIN 101 222 121 120%
18 BELGIUM 334 187 -147 -44%
19 UKRAINE 120 178 58 48%
20 UNITED KINGDOM 151 150 -1 -1%
21 IRAN ISLAMIC REP 40 138 98 245%
22 NETHERLANDS 187 138 -49 -26%
23 YEMEN 142 136 -6 -4%
24 MALTA 53 113 60 113%
25 SLOVENIA 33 95 62 188%
26 DENMARK 87 87 0 0%
27 FRANCE 83 83 0 0%
Trade Statistical Bulletin 2022
Macroeconomics & Statistics Department Page 35
28 VIETNAM SOC REP OF 61 81 20 33%
29 DJIBOUTI 895 74 -821 -92%
30 BANGLADESH 258 69 -189 -73%
31 KOREA, REP OF 91 66 -25 -27%
32 SINGAPORE 53 63 10 19%
33 JORDAN 33 49 16 48%
34 TAIWAN 18 47 29 161%
35 QATAR 56 46 -10 -18%
36 SOUTH AFRICA 97 44 -53 -55%
37 CANADA 23 36 13 57%
38 JAPAN 180 36 -144 -80%
39 GERMANY, FED REP OF 29 34 5 17%
40 AUSTRALIA 16 30 14 88%
41 MOROCCO 24 21 -3 -13%
42 POLAND 11 21 10 91%
43 SWEDEN 15 15 0 0%
44 CROATIA 0 14 14 #DIV/0!
45 SOMALI 51 13 -38 -75%
46 KUWAIT 5 12 7 140%
47 RUSSIA 0 10 10 #DIV/0!
48 HONG KONG, CHINA 6 8 2 33%
49 TUNISIA 1 7 6 600%
50 LEBANON 15 6 -9 -60%
51 MAURITIUS 2 6 4 200%
52 NORWAY 10 6 -4 -40%
53 NEW ZEALAND 10 5 -5 -50%
54 SYRIAN ARAB REP 4 4 0 0%
55 ALBANIA 5 3 -2 -40%
56 GREECE 1 3 2 200%
57 TANZANIA 5 3 -2 -40%
Trade Statistical Bulletin 2022
Macroeconomics & Statistics Department Page 36
58 COTE D’IVOIRE 1 2 1 100%
59 FINLAND 7 2 -5 -71%
60 GABON 0 2 2 100%
61 HUNGARY 0 2 2 100%
62 SENEGAL 1 2 1 100%
63 SUDAN 0 2 2 100%
64 ARGENTINA 0 1 1 100%
65 BAHRAIN 16 1 -15 -94%
66 ESTONIA 0 1 1 100%
67 GEORGIA 0 1 1 100%
68 IRELAND 7 1 -6 -86%
69 MOZAMBIQUE 0 1 1 100%
70 ROMANIA 0 1 1 100%
71 SRI LANKA 2 1 -1 -50%
72 UGANDA 0 1 1 100%
73 CHANA 3 0 -3 -100%
74 PANAMA 3 0 -3 -100%
75 IRAN 1 0 -1 -100%
76 PORTUGAL 1 0 -1 -100%
77 CYPRUS 1 0 -1 -100%
78 SIERA LEONE 2 0 -2 -100%
43,245 43,976 731 2%

Annual-Trade-Statistical-Bulletin-2022-F-1.pdf

  • 1.
    Trade Statistical Bulletin2022 Ministry of Finance Development Macroeconomics and Statistics
  • 2.
    Trade Statistical Bulletin2022 Macroeconomics & Statistics Department Page 2 Contents 1. Exports................................................................................................................................. 3 1.1.Livestock Exports: Jan-December 2022........................................................................ 3 1.2.Commodities Exports: Jan-December 2022................................................................. 4 1.3. Comparison of Livestock Export Jan-December 2021/2022................................... 5 2. Imports...................................................................................................................................... 9 2.1. Trade Balance: Jan–Dec 2022 ..................................................................................... 11 Table 1: Livestock Exportation Jan-December 2022...................................................................... 3 Table 2: Commodities Exported During Jan-December 2022........................................................ 4 Table 3: Comparison of Export Commodities 2021/2022.............................................................. 5 Table 4: Comparison of Livestock Exportation(Sheep/Goat) Jan-December 2021/2022 ............. 6 Table 5: Comparison of Livestock Exportation (Camel) Jan-December 2021/2022 ..................... 7 Table 6: Comparison of Livestock Exportation (Cattle) Jan-December 2021/2022 ...................... 8 Table 7: Container Imports of Jan-December 2021/2022............................................................... 9 Table 8: Import Classification of Jan-December 2022................................................................. 10 Table 9: Import Classification of Jan-December 2021................................................................. 10 Figure 1: Summary of Livestock Export by Type 2022........................................................... 3 Figure 2: Comparison of Livestock Exportation (Sheep/Goat) Jan-Dec 2021/2022...................... 6 Figure 3: Comparison of Livestock Exportation (Camel) Jan-December 2021/2022.................... 7 Figure 4: Comparison of Livestock Exportation (Cattle) Jan-December 2021/2022..................... 8 Figure 5: Net Trade Balance of Somaliland 2022 ....................................................................... 11
  • 3.
    Trade Statistical Bulletin2022 Macroeconomics & Statistics Department Page 3 1. Exports Export of animals to the Arab Gulf States, especially Saudi Arabia, represents the largest share of the Somaliland export earnings. The three types of livestock that Somaliland exports are sheep/goat, camel, and cattle. There are also other items that accompanies the livestock export. Skins, hides and fish are the main exports that Somaliland traders share with the entire world. 1.1. Livestock Exports: Jan-December 2022 The table (1) below illustrates the category of livestock market share per type of exports. The price of livestock per type is shown in the table and data was collected by the team from the Macroeconomic Department, and targeted livestock markets across the regions of Somaliland. The quantity of livestock exported during Jan-December 2022 is multiplied by the current local livestock price per head, which gives the total value of exports. Figure 1 clearly specifies that sheep/goat has the largest share of livestock exports of 92%, then with Cattle and Camel at 6%, 2% of quantity exported respectively. Table 1: Livestock Exportation Jan-December 2022 No Name Quantity Unit Price Export Total Value 1 Sheep/Goat 2,063,597 $ 80.74* $ 166,614,822 2 Cattle 125,243 $ 403.69* $ 50,559,347 3 Camel 46,630 $ 611.30* $ 28,504,919 Total $245,679,087 Source: Macroeconomics & Statistics Department of MOFD *Livestock Market Information Collected by Macroeconomic and Statistics Department Figure 1: Summary of Livestock Export by Type 2022 Source: MoFD/Customs Department Sheep/Goat 92% Cattle 6% Camel 2%
  • 4.
    Trade Statistical Bulletin2022 Macroeconomics & Statistics Department Page 4 1.2. Commodities Exports: Jan-December 2022 The exports from Somaliland other than livestock are not as that as significant. Few items or commodities are exported through the main port of Berbera and Zaila border. The Table 2 below shows the list of items that Somaliland exports to other countries. Skins and hides, gums, fish, powder soap and watermelon hold prominent positions in terms of quantities exported. The values in the table are collected by a particular team from Macroeconomic department, and the price values sometimes vary significantly from current local market prices. Table 2: Commodities Exported During Jan-December 2022 No Item Name Unit Measure Quantity Exported Unit Price Value* Total Value 1 Skins Pcs 324,500 $1.25 $ 405,625 2 Hides Pcs 89,900 $5.00 $ 449,500 3 Fresh Fish KGs 576,231 $4.00 $ 2,304,924 4 Lobster KGs 50,420 $20.00 $ 1,008,400 5 Foox KGs 1,593,203 $14.00 $ 22,304,842 6 Malmal KGs 85,130 $16.00 $ 1,362,080 7 Battery Scrap Tons 2,641 $100 $ 264,112 8 Copper Scrap Tons 1,506 $300 $ 451,819 9 Powder Soap KGs 3,530,592 $2.38 $ 8,402,809 10 Sorghum Bags of 50 KGs 680 $9.50 $ 6,460 11 Ethiopian Daafi Bags of 50 KGS 440,000 $47.00 $ 20,680,000 12 Watermelon KGs 968,000 $3.00 $ 2,904,000 13 Xabag (Gum) KGs 77,010 $8.00 $ 616,080 14 Fresh Fruits KGs 976,965 $1.80 $ 1,758,537 15 Gold bars Grams 761,784 $47.00 $ 35,803,867 16 Iron Scrap Tons 979 $400 $ 391,600 17 Fish Oil Litter 72,000 $0.34 $ 24,480 18 Mineral Litter 54 $0.38 $ 21 19 Aquaria Fish KG 17,548 $4.00 $ 70,192 20 Another medicated tree Pieces 1,061 $1.00 $ 1,061.00 21 Wheat KG 25 $9.50 $ 238 22 Maize KG 10,334 $9.50 $ 98,173 23 Fresh Vegetable KG 17,800 $1.80 $ 32,040 24 Sea Cucumber KG 488,873 $20.00 $ 9,777,460 Total $ 109,118,318 Source: MoFD/Customs Department *Macroeconomic team collected the current Market local price
  • 5.
    Trade Statistical Bulletin2022 Macroeconomics & Statistics Department Page 5 Table 3: Comparison of Export Commodities 2021/2022 No Description Unit Measure 2021 2022 Difference Percent 1 Skins Pcs 495,000 324,500 (170,500) -34% 2 Hides Pcs 123,700 89,900 (33,800) -27% 3 Fresh Fish KGs 577,299 576,231 (1,068) 0% 4 Sea Cucumber KGS 2,125 488,873 486,748 22906% 5 Aquaria Fish KGs - 17,548 17,548 100% 6 Lobster KGs 18,900 50,420 31,520 167% 7 Incense (Foox) KGs 1,345,461 1,593,203 247,742 18% 8 Myrrh (Malmal) KGs 57,135 85,130 27,995 49% 9 Battery Scrap Tons 2,047 2,641 594 29% 10 Copper Scrap Tons 1,539 1,506 (33) -2% 11 Powder Soap KGs 1,790,264 3,530,592 1,740,328 97% 12 Sorghum Bags of 50 KGs 29,542 680 (28,862) -98% 13 Ethiopian Daafi Bags of 50 KGS 101,980 440,000 338,020 331% 14 Gold bars Grams 784,187 761,784 (22,403) -3% 15 Watermelon KGs 1,893,000 968,000 (925,000) -49% 16 Vegetables KGs 28,462 17,800 (10,662) -37% 17 Wheat Husk KGs 2,840 (2,840) -100% 18 Iron Scrab Tons 422 979 557 132% 19 Gum (Xabag) KGs 758 77,010 76,252 10060% 20 Wheat Pcs - 25 25 100% 21 Maize KGs - 10,334 10,334 100% 22 Fresh Fruits KGs 211,050 976,965 765,915 363% 23 Sesame oil KGs 240,000 (240,000) -100% 24 Fish Oil Litter 33,800 72,000 38,200 113% 25 Mineral KGs 482 54 (428) -89% 26 Other medicated tree Pieces - 1,061 1,061 100% 1.3. Comparison of Livestock Exports (Sheep/Goat) Jan-December 2021/2022 As the comparative figures between 2021 and 2022 in Table 4 below shows, the month of May in 2022 has the highest percentage increase in exports compared to the same month in the previous year. In aggregate, livestock (Sheep/Goats) exports in the year of 2022 were 10% higher than exports of the same period in 2021.
  • 6.
    Trade Statistical Bulletin2022 Macroeconomics & Statistics Department Page 6 Table 4: Comparison of Livestock Exportation (Sheep/Goat) Jan-December 2021/2022 Sheep/Goat 2021 2022 Difference Percent ∆ January 112,287 95,517 (16,770) -15% February 121,302 152,545 31,243 26% March 131,824 119,954 (11,870) -9% April 145,272 150,323 5,051 3% May 69,939 140,042 70,103 100% June 549,202 771,853 222,651 41% July 388,688 257,120 (131,568) -34% August 52,103 47,673 (4,430) -9% September 61,448 55,643 (5,805) -9% October 47,517 66,037 18,520 39% November 90,991 99,566 8,575 9% December 97,092 107,324 10,232 11% G/Total 1,867,665 2,063,597 195,932 10% Source: MoFD/Customs Department Figure 2 below shows the comparison between the two annual statistical reports of Jan-Dec 2021 and 2022. The month of May has the highest difference in 2021/2022 which total sheep/goat exports doubling. The figure also shows a clear seasonal pattern in the exports of livestock. Figure 2: Comparison of Livestock Exportation (Sheep/Goat) Jan-Dec 2021/2022 Source: MoFD/Customs Department 0 100,000 200,000 300,000 400,000 500,000 600,000 700,000 800,000 900,000 2021 2022
  • 7.
    Trade Statistical Bulletin2022 Macroeconomics & Statistics Department Page 7 Table 5 and Figure 3 below show the comparison of camel’s exports during the fiscal years of 2021/2022. Camel exports in August 2022 has the highest year-on-year (YoY) increase of 58,540%, while July has the largest YoY decrease. This is different from the rest of the livestock exports, which follow a more seasonal pattern. In aggregate, Jan-Dec 2022 camel exports increased 67% compared to the Jan-Dec 2021 camel export. There is also significant monthly variation in the quantity of camels exported. Table 5: Comparison of Livestock Exportation (Camel) Jan-December 2021/2022 Camel 2021 2022 Difference Percentage Change January 3,357 2,628 (729) -22% February 4,610 10,931 6,321 137% March 4,888 2,927 (1,961) -40% April 3,850 3,777 (73) -2% May 1,214 3,346 2,132 176% June 2,486 3,516 1,030 41% July 4,196 205 (3,991) -95% August 5 2,932 2,927 58540% September 710 5,420 4,710 663% October 714 3,013 2,299 322% November 1,000 1,997 997 100% December 930 5,938 5,008 538% G/Total 27,960 46,630 18,670 67% Source: MoFD/Customs Department Figure 3: Comparison of Livestock Exportation (Camel) Jan-December 2021/2022 Source: MoFD/Customs Department 0 2,000 4,000 6,000 8,000 10,000 12,000 2021 2022
  • 8.
    Trade Statistical Bulletin2022 Macroeconomics & Statistics Department Page 8 As can been seen in Table 6 and Figure 4 below, cattle are the second largest livestock export after sheep and goats. The table indicates that from Jan-Dec 2022, cattle exports increased 22% compared to Jan-Dec 2021 cattle. January has the highest YoY decrease of cattle exports at 62%, while September had the largest YoY increase at 248%. Table 6: Comparison of Livestock Exportation (Cattle) Jan-December 2021/2022 Cattle 2021 2022 Difference Percentage Change January 17,190 6,583 (10,607) -62% February 7,815 8,904 1,089 14% March 8,257 10,088 1,831 22% April 8,931 11,045 2,114 24% May 5,216 6,966 1,750 34% June 9,694 16,093 6,399 66% July 11,815 10,598 (1,217) -10% August 1,939 6,441 4,502 232% September 4,166 14,481 10,315 248% October 9,592 10,309 717 7% November 9,767 10,449 682 7% December 7,964 13,286 5,322 67% G/Total 102,346 125,243 22,897 22% Source: MoFD/Customs Department Figure 4: Comparison of Livestock Exportation (Cattle) Jan-December 2021/2022 Source: MoFD/Customs Department 0 2,000 4,000 6,000 8,000 10,000 12,000 14,000 16,000 18,000 20,000 2021 2022
  • 9.
    Trade Statistical Bulletin2022 Macroeconomics & Statistics Department Page 9 2. Imports Somaliland imports a wide range of products consisting mainly of food items, petroleum products, building materials, machinery and equipment, consumer goods, pharmaceuticals, tobacco and motor vehicles, etc. The bulk of the imports originates from Ethiopia, China, Kenya, U.A.E, Yemen, Saudi Arabia, India, Thailand, and Malaysia. Table 7 below shows the import of containers through Jan-Dec 2021/2022, where there was a 2% increase in containers YoY. India, United Arab Emirates, and China have the greatest number of import containers, which is listed in full in Appendix 3. Table 7: Container Imports of Jan-December 2021/2022 Month Containers Jan-Dec 2021 Containers Jan-Dec 2022 Difference %Change January 3,665 4,197 532 15% February 3,926 2,967 (959) -24% March 4,113 3,548 (565) -14% April 2,838 3,164 326 11% May 3,638 3,109 (529) -15% June 4,074 2,712 (1,362) -33% July 2,599 3,876 1,277 49% August 5,009 3,696 (1,313) -26% September 3,179 4,505 1,326 42% October 3,695 4,157 462 13% November 3,198 4,068 870 27% December 3,311 3,977 666 20% Total 43,245 43,976 731 2% Source: MoFD/Customs Department The trade of khat and its consumption play a significant role in the Somliland economy. It provides employment opportunities to thousands of people and it is a main source of revenue for the Ministry of Finance, however khat trade constitues a big drain on the foreign currency resources of the country. Taxation of imports/exports could be a primary source of potential revenue but it is constrained by lack of regulation and the effective promotion of trade. Unlike most developing countries which grow their food, Somaliland relies on food imports despite having enough arable land in the country. This is mainly due to the nomadic way of life and the subsistence approach to food production that is prevelent in Somaliland. Tables of 8 & 9 illustrates the classification of imports into seven categories. Food stuffs and building materials have the highest duty collected as a proportion of total import value, with 39% and 15% respectively. This import classifications are extracted from the full list of imported items in Appendix 1.
  • 10.
    Trade Statistical Bulletin2022 Macroeconomics & Statistics Department Page 10 Table 8: Import Classification of Jan-December 2022 Value (S.L.sh) Duty (S.L.sh) % Against value Food Stuff 3,884,933,164,047 498,580,834,355 39 Oleaginous* 1,009,894,962,156 410,580,786,141 10 Fuel & Transportation 1,021,466,178,492 176,465,043,147 10 Shopping’s 825,824,291,385 185,836,394,772 8 Building Material 1,440,522,846,812 183,084,961,760 15 Electronics 1,494,321,069,857 89,123,760,415 15 Others 184,588,477,490 35,537,718,802 2 Grand Total 9,861,550,990,239* 1,579,209,499,392 100 Source: MoFD/Customs Department *includes Khat, Cigarettes, tobaco and Medicines *This value is derived from computation of Invoice value collected by the Customs Authorities from importers and traders in the fiscal year of 2022. Table 9: Import Classification of Jan-December 2021 Value (S.L.sh) Duty (S.L.sh) % Against value Food Stuff 7,316,690,465,736 430,869,848,041 32% Oleaginous* 1,925,919,001,867 554,771,527,129 8% Fuel & Transportation 1,720,226,050,918 207,939,086,927 8% Shopping’s 8,025,528,644,669 201,893,861,359 35% Building Material 2,016,526,274,666 172,489,294,583 9% Electronics 1,369,817,788,583 83,053,358,929 6% Others 391,320,523,986 29,087,428,398 2% Grand Total 22,766,028,750,424* 1,680,104,405,365 100% Source: MoFD/Customs Department *This value (2021) was based on current market value which was collected by the Department of Macroeconomic and statistics. Because at that time the traders didn’t display the invoice value of the commodities, the department drived invoice value from the selling/shelf price of the commodities which shows the invoice value was 40% of the selling/shelf price whereas 60% selling/shelf price was the cost, profit and loss issues. Where MV= Marginal Value (Invoice Value) LMP= Local Market Price CPL= Cost Profit and Loss MV=LMP-CPL
  • 11.
    Trade Statistical Bulletin2022 Macroeconomics & Statistics Department Page 11 2.1. Trade Balance: Jan–Dec 2022 Figure 5 below shows the trade balance of Somaliland in the fiscal year of 2022. Somaliland registered a trade deficit of $1,053,970,217 which is to some extent an underestimation of the true value, as import values are based on recently collected imports invoice values, and these are sometimes an under-valuation due to informal import channels and weak commitment by importers to using the real invoice values. Figure 5: Net Trade Balance of Somaliland 2022 *This value is derived from computation of Invoice value collected by the Customs Authorities from importers and traders in the fiscal year of 2022. The total value of imports in Somaliland Shilling = 9,861,550,990,239 The total value of exports in Somaliland Shilling= 2,483,581,837,415 Equivalent Value of Imports to USD = $ 1,408,767,622 * Equivalent Value of Exports to USD = $ 354,797,405 The Net Trade Balance of Somaliland = $354,797,405 - $1,408,767,622 = ($ 1,053,970,217)
  • 12.
    Appendix 1: Summaryof Comparison Imports Jan-December 2021/2022 Tariff Number Description Unit/Measure Quantity 2021 Quantity 2022 Difference % 207 Chicken Meat KGs 2,096,922 2,475,194 378,272 18% 302 Fresh Fish KGs 215,585 7,517 (208,068) -97% 402 Milk Powder KGs 14,081,597 17,252,464 3,170,867 23% 404 Fresh Milk Litters 5,423,186 8,341,978 2,918,792 54% 405 Butter Ghee KGs 1,451,096 971,993 (479,103) -33% 408 Eggs Dozen 25,406 3,483 (21,923) -86% 409 Natural Honey KGs 25,781,686 95,898 (25,685,787) -100% 701 Fresh Vegetable KGs 39,303,068 56,046,334 16,743,266 43% 804 Dates KGs 20,557,560 15,438,609 (5,118,951) -25% 804 Fresh Fruit KGs 14,228,254 15,786,077 1,557,822 11% 807 Resins "Sabiib" KGs 165,422 128,681 (36,741) -22% 901 Coffee KGs 153,783 132,518 (21,265) -14% 902 Coffee Husk KGs 239 5,054 4,815 2015% 904 Tea Leaves KGs 2,311,853 2,898,338 586,485 25% 910 Spices KGs 4,398,540 3,174,089 (1,224,451) -28% 1001 Wheat Bags of 50 KGs 962,411 15,140 (947,271) -98% 1005 Maize Bags of 50 KGs 1,021,621 333,545 (688,075) -67% 1006 Rice Bags of 50 KGs 1,228,683 8,713,632 7,484,949 609% 1007 Sorghum Bags of 50 KGs 125,981 24,426 (101,555) -81% 1008 Beans Bags of 50 KGs 20,236 15,757 (4,479) -22% 1008 Ethiopian Daafi Bags of 50 KGs 5,987 77,586 71,598 1196% 1008 Wheat Husk Bags of 50 KGs 7,018 18,541 11,523 164%
  • 13.
    Trade Statistical Bulletin2022 Macroeconomics & Statistics Department Page 13 Tariff Number Description Unit/Measure Quantity 2021 Quantity 2022 Difference % 1101 Wheat Flour Bags of 50 KGs 1,201,497 5,451,756 4,250,259 354% 1108 Starches Bags of 50 KGs 37 27,733 27,695 74012% 1202 Ground Nuts KGs 10,892 36,609 25,717 236% 1209 Seeds KGs 185,239 100,458 (84,781) -46% 1214 Kat KGs 44,958,197 27,365,947 (17,592,251) -39% 1301 Arabian Gums KGs 467,195 1,007,296 540,101 116% 1513 Non-Edible Oil Litters 1,585,415 1,679,209 93,794 6% 1515 Cooking Oil Litters 59,616,635 62,308,217 2,691,583 5% 1515 Sesame Oil Litters 648,690 467,183 (181,507) -28% 1522 Medicated Oil “Abu-Faas” Litters 9,043 22,308 13,265 147% 1604 Preserved Fish KGs 1,821,987 2,268,662 446,675 25% 1701 Sugar Bags of 50 KGs 2,989,665 12,475,816 9,486,151 317% 1704 Sweet Drops KGs 6,305,456 7,550,701 1,245,245 20% 1704 Chewing Gum KGs 2,030,686 4,365,220 2,334,534 115% 1704 Daaxuuniyad KGs 17,830 25,537 7,707 43% 1901 Custard Powder KGs 230,241 267,970 37,729 16% 1901 Infant Food KGs 66,478 4,281,956 4,215,478 6341% 1902 Pasta/Macaroni KGs 99,355,098 70,860,404 (28,494,694) -29% 1902 Preserved Beans KGs 4,483,611 4,472,774 (10,837) 0% 1904 Corn Flakes KGs 77,783 147,967 70,184 90% 1904 Chips KGs 156,130 235,895 79,765 51% 1904 Oats KGs 1,299,745 1,080,395 (219,350) -17% 1905 Pop Corn KGs 238,854 1,096,969 858,115 359%
  • 14.
    Trade Statistical Bulletin2022 Macroeconomics & Statistics Department Page 14 Tariff Number Description Unit/Measure Quantity 2021 Quantity 2022 Difference % 1905 Biscuits KGs 9,023,601 11,199,266 2,175,665 24% 2002 Tomato Paste KGs 8,777,258 5,497,215 (3,280,043) -37% 2008 Preserved Fruits KGs 32,060 8,251 (23,809) -74% 2101 Nes Coffee KGs 3,373 13,627 10,254 304% 2102 Yeast KGs 718,379 493,248 (225,130) -31% 2104 Soup “Jumbo” KGs 12,440 639,686 627,245 5042% 2105 Ice Cream Powder KGs 262,328 403,179 140,852 54% 2106 Mooniyoos KGs 221,040 20,226,302 20,005,262 9051% 2203 Malt Drinks Litters 1,340,939 1,611,530 270,591 20% 2206 Soft Drinks Litters 14,173,637 13,910,232 (263,405) -2% 2209 Soft Drinks Powder KGs 2,383,863 2,533,149 149,285 6% 2209 Vinegar KGs 1,996 86,731 84,735 4245% 2403 Tobacco KGs 407,601 373,077 (34,524) -8% 2402 Cigarette KGs 6,753,934 6,202,817 (551,117) -8% 2501 Salt KG 1,033,794 287,354 (746,440) -72% 2523 Cements Bags 7,312,604 9,001,802 1,689,198 23% 2524 Limestone "Nuurad" Bags 515 1,754 1,239 241% 2710 Gas Oil M3 131,093 149,978 18,884 14% 2710 Mogas "Petrol" M3 100,482 81,831 (18,651) -19% 2710 Jet A1 M3 6,132 7,305 1,173 19% 2710 Kerosene M3 2,259 2,524 265 12% 2710 Lubricants/Oil Litters/KGs 5,761,819 7,807,669 2,045,850 36%
  • 15.
    Trade Statistical Bulletin2022 Macroeconomics & Statistics Department Page 15 Tariff Number Description Unit/Measure Quantity 2021 Quantity 2022 Difference % 2711 Butane Gas Litters 73,869 5,440 (68,429) -93% 2715 Bituminous Tons 622 2,013 1,391 224% 2806 Acid Litters 88,319 60,249 (28,070) -32% 2807 Distilled Water Litters 162,813 108,868 (53,944) -33% 2915 Organic Chemicals KGs 241,877 18,596 (223,281) -92% 3004 Medicines Vials/Tabs/Bottles 40,464,647 12,769,478 (27,695,169) -68% 3004 Medical Equipment Pcs 656,378 905,748 249,370 38% 3204 Dye Litters 58,483 5,741 (52,742) -90% 3210 Paint/Distemper Litters/KGs 5,017,637 5,017,640 3 0% 3214 Putty KGs 1,035,519 630,660 (404,858) -39% 3215 Printer/Photocopy Inks Pcs 39,314 42,244 2,930 7% 3301 Cosmetics Litters/KGs 3,698,302 3,797,465 99,164 3% 3304 Toilet Perfume Litters 434,703 554,270 119,566 28% 3304 Tooth Paste KGs 143,495 206,610 63,114 44% 3305 Shampoo Litters 432,804 906,462 473,658 109% 3307 Uunsi KGs 74,134 38,878 (35,256) -48% 3307 Jaawi KGs 611 21,140 20,529 3360% 3401 Toilet Soap KGs 455,059 985,843 530,784 117% 3401 Laundry Soap KGs 7,817,985 5,962,793 (1,855,192) -24% 3401 Powder Soap KGs 2,321,509 6,511,928 4,190,419 181% 3401 Liquid Detergent Litters 145,027 63,367 (81,659) -56% 3405 Boot Polish KGs 63,200 63,260 60 0% 3405 Wood Polish KGs 113,974 89,972 (24,002) -21%
  • 16.
    Trade Statistical Bulletin2022 Macroeconomics & Statistics Department Page 16 Tariff Number Description Unit/Measure Quantity 2021 Quantity 2022 Difference % 3406 Candles KGs 55,179 77,308 22,129 40% 3506 Glue KGs 461,534 378,718 (82,816) -18% 3604 Matches Gross 37,471 130,895 93,424 249% 3702 Film Rolls Pcs 136,931 117,794 (19,137) -14% 3808 Insecticide Litters 186,677 226,605 39,928 21% 3810 Brazing KGs 590 212,670 212,080 35934% 3814 Thinner Litters 162,716 165,678 2,962 2% 3917 Plastic Pipes “P.V.C” Pcs 266,038 310,006 43,968 17% 3917 Plastic Hose Pipe Meters 534,601 559,805 25,204 5% 3920 Plastic Sheet Meters 4,153,959 4,188,720 34,761 1% 3921 Plothylene Mats Pcs 1,320,547 752,762 (567,785) -43% 3921 Plothlene Shopping Bags Gross 236,961 385,109 148,147 63% 3923 Plastic Material Dozen/Pcs 3,431,787 2,381,618 (1,050,169) -31% 3923 Empty Bottles Pcs 1,368,704 1,670,997 302,293 22% 3926 Plastic Bangles/Ear Rings Doz/Gross 127,195 80,425 (46,769) -37% 4009.1 Hose Pipes “Rubber” Meters 110,481 910,702 800,221 724% 4011 Rubber Tyres Pcs 666,661 771,832 105,171 16% 4011 Rubber Tubes Pcs 355,742 369,666 13,924 4% 4014 Rubber Teats Gross 23,858 198,654 174,796 733% 4016 Car Mats Dozen 695 90,281 89,586 12886% 4016 Rubber Band CTN 7,746 5,891 (1,855) -24% 4104 Maas KGs 385 3,811 3,426 890% 4202 Suit Case & Hand Bags Dozen/Pcs 229,390 277,501 48,111 21%
  • 17.
    Trade Statistical Bulletin2022 Macroeconomics & Statistics Department Page 17 Tariff Number Description Unit/Measure Quantity 2021 Quantity 2022 Difference % 4407 Timber Wood M3 49,774 51,828 2,053 4% 4407.2 Wooden Posts Pcs 379,296 105,030 (274,266) -72% 4407.3 Articles of Wood Pcs 109,412 203,179 93,767 86% 4407.5 Ceiling Hardboard Pcs 441,399 273,141 (168,258) -38% 4412.13 Ply Wood Pcs 410,818 410,969 151 0% 4601 Praying Mats Dozen 1,406 2,482 1,076 76% 4602 Hand Brooms Dozen 2,172 36,854 34,683 1597% 4802 Stationary Reams/Dozens 1,887,746 2,783,486 895,740 47% 4818 Napkin Tissue/Toilet Papers Dozen/PKT 316,460 387,174 70,713 22% 4819 Empty Cartons Pcs 85,131 27,580 (57,551) -68% 4820 Exercise Books Dozens 71,277 29,437 (41,840) -59% 4901 Text Books Dozen 121,287 270,342 149,054 123% 4902 Old Newspapers KGs 246,075 412,834 166,759 68% 4907 Sim Cards Pcs 1,424,182 2,261,048 836,866 59% 4910 Calenders Dozens 1,129 433 (695) -62% 5204 Sewing Thread BKT 8,018 127,558 119,540 1491% 5513 Unstitched Cloths Yards 144,032,777 136,172,320 (7,860,457) -5% 5607 Nylon Ropes Rolls 1,515,476 1,695,457 179,981 12% 5701 Carpets Meters 614,658 874,529 259,870 42% 5705 Door Mats " Dacsado" Dozen 50,781 496,786 446,005 878% 5803 Children Bombers Dozen 18,294,608 8,373,287 (9,921,321) -54% 5803 Mosquito Net Pcs 22,555 125,126 102,571 455%
  • 18.
    Trade Statistical Bulletin2022 Macroeconomics & Statistics Department Page 18 Tariff Number Description Unit/Measure Quantity 2021 Quantity 2022 Difference % 5904 Linoleum "Shamac" Meters 4,618,713 4,583,546 (35,167) -1% 5908 Wicks Dozen 8,342,121 3,030,691 (5,311,430) -64% 6203 Men's Jackets Pcs 472,246 167,180 (305,066) -65% 6205 Stitched Clothes Dozen 3,948,401 2,951,973 (996,428) -25% 6207 Stitched Clothes Scores 866,504 380,304 (486,200) -56% 6217 Belts Dozen 126,307 41,464 (84,842) -67% 6301 Blankets Pcs 1,558,157 1,216,600 (341,557) -22% 6309 Used Clothes Bundles 24,458 147,374 122,916 503% 6302 Bed Sheets Scores 310,805 113,928 (196,877) -63% 6303 Ready Made Curtains Yards 373,483 256,699 (116,785) -31% 6305 Empty Gunny Bags Pcs 47,700 44,604 (3,096) -6% 6309 Used Shoes Bundles 158,459 124,097 (34,363) -22% 6403 Rubber Sandals Dozen 1,284,896 917,010 (367,886) -29% 6403 Plastic Sandals/Shoes Dozen 582,107 932,247 350,140 60% 6403 Leather Shoes Dozen 238,148 122,331 (115,817) -49% 6501 Arabian Hats Dozen 59,367 59,428 61 0% 6601 Umbrellas Dozen 995 7,495 6,499 653% 6602 Walking Sticks Dozen 13,300 12,392 (908) -7% 6702 Artificial Flowers Pcs 94,188 81,330 (12,858) -14% 6811 Burjiko Pcs 276,107 119,801 (156,305) -57% 6904 Floor Tiles SQ Meters 2,253,648 3,697,804 1,444,157 64% 6905 Gypsum Ceiling "Roof Tiles" SQ Meter 2,140,092 321,947 (1,818,144) -85% 6910 Toilet Basins Pcs 63,553 61,109 (2,443) -4%
  • 19.
    Trade Statistical Bulletin2022 Macroeconomics & Statistics Department Page 19 Tariff Number Description Unit/Measure Quantity 2021 Quantity 2022 Difference % 6911 Broceiling Ware Sets 121,999 90,409 (31,590) -26% 7000 Toilet Mirror Pcs 36,973 52,112 15,139 41% 7003 Looking Mirror Dozen 70,540 39,096 (31,444) -45% 7003 Glass Sheet SQ Meter 191,792 323,462 131,670 69% 7011 Electric Bulbs Dozen 517,294 577,511 60,218 12% 7011 Torch Bulbs CTN 33 28,177 28,144 85286% 7013 Glass Ware Dozen 221,922 869,832 647,910 292% 7018 Glass Marbles Gross 948 68,772 67,824 7151% 7117 Jewelry Gross 6,701 7,157 456 7% 7208 Flat Bars “Bayaati” Pcs 215,123 148,697 (66,426) -31% 7216 U Shaped Channels Pcs - 116,168 116,168 #DIV/0! 7222 Iron Bars Tons 23,540 43,367 19,827 84% 7222 Bending Wire KGs 933,988 724,078 (209,910) -22% 7301 Iron Sheets Pcs 3,641,124 3,336,670 (304,454) -8% 7301 Square Tubes Pcs 1,102,841 1,221,873 119,032 11% 7301 M.S Sheet Pcs 2,955 80,161 77,206 2613% 7306 Angular Bars Pcs 279,855 190,107 (89,748) -32% 7306 G.Iron Pipes Pcs 75,167 147,944 72,777 97% 7306 Water Pipe Fittings Dozens 8,997 18,197 9,200 102% 7306 Furniture Pipes Pcs 878,908 912,569 33,661 4% 7310 Empty Iron Drums Pcs 6,540 176,038 169,498 2592% 7310 Iron Tanks Pcs 39 27 (12) -31% 7313 Barberd Fencing Wire KGs 487,204 813,686 326,482 67%
  • 20.
    Trade Statistical Bulletin2022 Macroeconomics & Statistics Department Page 20 Tariff Number Description Unit/Measure Quantity 2021 Quantity 2022 Difference % 7314 Cross Section Wire KGs 91,995 347,818 255,823 278% 7314 Iron Net "X-pin" Sheet 7,050 70,618 63,568 902% 7314 Iron Net for Windows (Mosquito) Meters 1,143 105,286 104,143 9111% 7315 Ordinary Chains Meters 3,675 86,549 82,874 2255% 7317 Iron Nails KGs 2,849,871 3,178,089 328,217 12% 7321 Kerosene Stoves Pcs 1,092 10,758 9,666 885% 7321 Butane Gas Cooking Pcs 3,760 6,778 3,018 80% 7323 Enamel Ware Dozen 429,923 794,147 364,223 85% 7323 Stainless Steel Ware KGs 1,133,719 749,811 (383,909) -34% 7323 Iron Charcoal Pcs 336 - (336) -100% 7610 Aluminum Frames KGs 150,230 56,423 (93,807) -62% 7615 Aluminum Ware KGs 4,204,189 4,488,939 284,750 7% 7617 Foil Paper Rolls 232,040 178,650 (53,390) -23% 8105 Scrap Tons 80,167 61,900 (18,267) -23% 8201 Hand Tools Dozen 2,096,777 1,502,432 (594,344) -28% 8210 Wheel Barrows Pcs 20,414 316,295 295,881 1449% 8212 Razor Blades Pcs - 40,734 40,734 #DIV/0! 8301 Locks Dozen 63,783 63,223 (560) -1% 8302 Hinges/Hand raps Dozen 20,285 83,794 63,509 313% 8303 Safes Pcs 139,013 102,275 (36,738) -26% 8311 Welding Rods KGs 51 - (51) -100% 8401 Machines Unit 215,676 1,252,151 1,036,475 481% 8414 Electric Fans Pcs 44,960 57,733 12,773 28%
  • 21.
    Trade Statistical Bulletin2022 Macroeconomics & Statistics Department Page 21 Tariff Number Description Unit/Measure Quantity 2021 Quantity 2022 Difference % 8414 Jacks & Pulley Tackles Pcs 918 6,240 5,322 580% 8415 Air Condition Pcs 12,528 495,808 483,280 3858% 8416 Electric Cookers Pcs 22,226 27,653 5,427 24% 8418 Refrigerators/Freezers Pcs 31,266 71,957 40,692 130% 8442 Photocopy Machine Pcs 33 23,581 23,548 71357% 8471 Computer & Accessories Pcs 493,098 262,974 (230,125) -47% 8501 Electric Generators Units 25,596 66,161 40,565 158% 8504 Transformers “Regulators” Pcs 3,114 7,924 4,810 154% 8506 Dry Cell Battery Dozen 6,657,918 3,822,242 (2,835,677) -43% 8506 Car Battery Pcs 347,364 225,414 (121,949) -35% 8509 Electric Appliance Pcs 863,997 537,344 (326,653) -38% 8513 Torches Dozen 470,696 406,652 (64,044) -14% 8516 Electric Iron Pcs 195 11,555 11,360 5826% 8517 Telecommunication Parts Items 2,022,357 2,348,496 326,139 16% 8518 Loud Speakers Pcs 9,567 795,841 786,274 8219% 8519 Radio Recorders Pcs 87,992 29,815 (58,177) -66% 8519 Cassettes for Recorders Dozen/Pcs 36,340 8,694 (27,646) -76% 8525 Cameras Pcs 1,544 4,677 3,133 203% 8526 T.V Accessories Pcs 1,200,510 844,606 (355,903) -30% 8536 Electric Fittings Dozen 254,047 227,481 (26,566) -10% 8541 Solar Pcs 133,344 87,772 (45,572) -34% 8544 Wires and Cables Meters 11,252,791 13,349,327 2,096,537 19% 8701 Tractors Units 261 799 538 206%
  • 22.
    Trade Statistical Bulletin2022 Macroeconomics & Statistics Department Page 22 Tariff Number Description Unit/Measure Quantity 2021 Quantity 2022 Difference % 8703 Pick Up Cars Units 1,172 901 (271) -23% 8703 Station Wagon Units 972 1,020 48 5% 8703 Passenger Buses Units 2,390 8,094 5,704 239% 8703 Trucks Units 1,874 2,653 779 42% 8703 Saloon Cars Units 4,977 3,173 (1,804) -36% 8708 Spare Parts Items 3,650,783 3,710,676 59,893 2% 8712 Bicycles Units 16,931 10,743 (6,188) -37% 8714 Motor Cycles Units 5,356 29,413 24,057 449% 8715 Baby Walkers Pcs 112,836 27,038 (85,797) -76% 9001 Sunglass Dozen 206,589 117,825 (88,765) -43% 9006 Photographic Camera Pcs 2,587 4,475 1,889 73% 9022 X-ray Units 680 12,462 11,782 1734% 9102 Baby Watches Dozen 25,076 21,809 (3,268) -13% 9102 Watches Dozen 15,518 19,507 3,989 26% 9105 Clocks Pcs 4,424 4,220 (204) -5% 9201 Music Instrument Pcs 42,915 45,291 2,376 6% 9401 Furniture Pcs 509,897 1,048,584 38,687 106% 9402 Hospital Beds Pcs 2,492 445 (2,047) -82% 9405 Hurricane Lamps Dozen 9 - (9) -100% 9405 Glass For Lamps Dozen 1 460 459 34486% 9501 Toys Dozen 128,678 132,652 3,975 3% 9504 Games Sets 15,880 149,960 134,079 844% 9506 Sport Equipment Pcs 238,364 118,912 (119,453) -50% 9601 Miscellaneous Dozen 6,067,280 6,143,474 76,195 1%
  • 23.
    Appendix 2: Summaryof Import Goods Jan-December 2022 Tariff Number Description Unit/Measure Quantity Value Duties 207 Chicken Meat KGs 2,475,194 57,176,986,944 5,277,987,801 302 Fresh Fish KGs 7,517 79,980,880 65,992,758 402 Milk Powder KGs 17,252,464 329,694,586,658 27,778,466,389 404 Fresh Milk Litters 8,341,978 49,634,769,695 8,927,809,246 405 Butter Ghee KGs 971,993 11,022,397,218 1,020,225,362 408 Eggs Dozen 3,483 177,633,000 28,161,198 409 Natural Honey KGs 95,898 1,564,104,046 79,987,431 701 Fresh Vegetable KGs 56,046,334 168,699,464,317 10,612,408,385 804 Dates KGs 15,438,609 37,824,592,540 11,389,356,469 804 Fresh Fruit KGs 15,786,077 176,804,057,920 6,292,601,377 807 Resins "Sabiib" KGs 128,681 909,777,498 213,281,782 901 Coffee KGs 132,518 5,101,926,830 721,306,353 902 Coffee Husk KGs 5,054 32,901,540 7,756,765 904 Tea Leaves KGs 2,898,338 47,271,896,368 3,803,235,409 910 Spices KGs 3,174,089 48,880,973,064 6,070,830,380 1001 Wheat Bags of 50 KGs 15,140 1,271,767,560 54,432,966 1005 Maize Bags of 50 KGs 333,545 25,099,280,815 1,525,873,298 1006 Rice Bags of 50 KGs 8,713,632 860,035,441,881 55,801,868,994 1007 Sorghum Bags of 50 KGs 24,426 1,838,064,025 87,147,333 1008 Beans Bags of 50 KGs 15,757 666,193,276 54,495,726 1008 Ethiopian Daafi Bags of 50 KGs 77,586 4,996,507,488 168,632,878 1008 Wheat Husk Bags of 50 KGs 18,541 868,278,776 17,822,230
  • 24.
    Trade Statistical Bulletin2022 Macroeconomics & Statistics Department Page 24 Tariff Number Description Unit/Measure Quantity Value Duties 1101 Wheat Flour Bags of 50 KGs 5,451,756 220,959,673,517 32,728,059,972 1108 Starches Bags of 50 KGs 27,733 537,735,890 142,848,295 1202 Ground Nuts KGs 36,609 33,314,263 11,081,667 1209 Seeds KGs 100,458 267,217,482 61,419,542 1214 Kat KGs 27,365,947 746,132,531,323 275,522,832,322 1301 Arabian Gums KGs 1,007,296 1,339,703,680 247,772,678 1513 Non-Edible Oil Litters 1,679,209 2,468,437,304 2,550,001,582 1515 Cooking Oil Litters 62,308,217 379,457,043,357 38,220,267,497 1515 Sesame Oil Litters 467,183 3,630,012,920 307,942,617 1522 Medicated Oil “Abu-Faas” Litters 22,308 281,080,800 92,253,995 1604 Preserved Fish KGs 2,268,662 22,550,496,900 9,568,760,376 1701 Sugar Bags of 50 KGs 12,475,816 710,872,004,797 116,148,252,858 1704 Sweet Drops KGs 7,550,701 16,385,022,212 4,656,835,964 1704 Chewing Gum KGs 4,365,220 7,028,003,910 2,876,718,417 1704 Daaxuuniyad KGs 25,537 28,601,194 111,477,573 1901 Custard Powder KGs 267,970 2,457,280,865 567,646,667 1901 Infant Food KGs 4,281,956 22,480,270,260 3,361,285,376 1902 Pasta/Macaroni KGs 70,860,404 188,488,673,682 52,710,553,973 1902 Preserved Beans KGs 4,472,774 45,874,871,527 5,069,847,124 1904 Corn Flakes KGs 147,967 1,149,702,891 279,283,612 1904 Chips KGs 235,895 2,658,531,579 400,942,853 1904 Oats KGs 1,080,395 11,873,536,764 1,429,619,612 1905 Pop Corn KGs 1,096,969 9,905,629,619 1,193,454,659
  • 25.
    Trade Statistical Bulletin2022 Macroeconomics & Statistics Department Page 25 Tariff Number Description Unit/Measure Quantity Value Duties 1905 Biscuits KGs 11,199,266 177,956,329,907 10,849,405,466 2002 Tomato Paste KGs 5,497,215 51,563,876,325 8,480,418,462 2008 Preserved Fruits KGs 8,251 101,074,750 8,162,496 2101 Nes Coffee KGs 13,627 176,473,535 67,759,331 2102 Yeast KGs 493,248 11,152,345,646 582,758,129 2104 Soup “Jumbo” KGs 639,686 29,060,927,711 1,178,026,097 2105 Ice Cream Powder KGs 403,179 2,201,358,541 525,842,296 2106 Mooniyoos KGs 20,226,302 42,475,234,242 33,551,470,600 2203 Malt Drinks Litters 1,611,530 6,768,427,176 4,369,315,524 2206 Soft Drinks Litters 13,910,232 56,475,541,189 20,905,174,588 2209 Soft Drinks Powder KGs 2,533,149 26,420,739,064 4,727,972,386 2209 Vinegar KGs 86,731 121,423,148 237,605,230 2403 Tobacco KGs 373,077 2,715,997,648 5,533,120,416 2402 Cigarette KGs 6,202,817 207,980,454,010 125,008,700,980 2501 Salt KG 287,354 362,065,864 453,170,303 2523 Cements Bags 9,001,802 220,544,156,105 34,943,682,302 2524 Limestone "Nuurad" Bags 1,754 18,419,100 5,154,519 2710 Gas Oil M3 149,978 146,978,116,600 14,978,394,504 2710 Mogas "Petrol" M3 81,831 85,922,508,000 12,792,053,826 2710 Jet A1 M3 7,305 12,762,902,369 580,282,429 2710 Kerosene M3 2,524 30,037,742,000 527,744,214 2710 Lubricants/Oil Litters/KGs 7,807,669 68,317,102,613 8,477,299,105
  • 26.
    Trade Statistical Bulletin2022 Macroeconomics & Statistics Department Page 26 Tariff Number Description Unit/Measure Quantity Value Duties 2711 Butane Gas Litters 5,440 68,541,732 179,474,933 2715 Bituminous Tons 2,013 939,354,500 213,695,666 2806 Acid Litters 60,249 21,087,136 65,837,116 2807 Distilled Water Litters 108,868 642,685,610 38,860,786 2915 Organic Chemicals KGs 18,596 328,034,498 64,535,760 3004 Medicines Vials/Tabs/Bottles 12,769,478 52,737,944,677 4,451,596,663 3004 Medical Equipment Pcs 905,748 56,998,724,157 2,469,522,210 3204 Dye Litters 5,741 32,149,600 5,643,912 3210 Paint/Distemper Litters/KGs 5,017,640 96,765,184,507 8,337,532,292 3214 Putty KGs 630,660 485,608,269 958,330,715 3215 Printer/Photocopy Inks Pcs 42,244 487,921,434 443,733,287 3301 Cosmetics Litters/KGs 3,797,465 32,696,177,352 21,948,019,898 3304 Toilet Perfume Litters 554,270 6,945,000,218 5,038,848,450 3304 Tooth Paste KGs 206,610 289,253,398 2,072,797,420 3305 Shampoo Litters 906,462 1,586,308,640 2,631,614,055 3307 Uunsi KGs 38,878 258,535,907 46,938,431 3307 Jaawi KGs 21,140 9,470,536 30,425,392 3401 Toilet Soap KGs 985,843 13,180,724,386 1,931,561,548 3401 Laundry Soap KGs 5,962,793 47,583,084,948 5,083,235,274 3401 Powder Soap KGs 6,511,928 65,640,230,208 5,174,573,735 3401 Liquid Detergent Litters 63,367 527,848,360 122,344,376 3405 Boot Polish KGs 63,260 199,269,189 185,371,300 3405 Wood Polish KGs 89,972 107,066,406 147,508,690
  • 27.
    Trade Statistical Bulletin2022 Macroeconomics & Statistics Department Page 27 Tariff Number Description Unit/Measure Quantity Value Duties 3406 Candles KGs 77,308 324,691,710 128,622,669 3506 Glue KGs 378,718 3,313,780,225 896,420,067 3604 Matches Gross 130,895 407,610,590 283,616,047 3702 Film Rolls Pcs 117,794 98,946,725 291,745,769 3808 Insecticide Litters 226,605 1,380,025,668 160,218,853 3810 Brazing KGs 212,670 794,215,742 157,313,660 3814 Thinner Litters 165,678 788,627,280 166,294,646 3917 Plastic Pipes “P.V.C” Pcs 310,006 4,752,395,046 1,794,384,429 3917 Plastic Hose Pipe Meters 559,805 10,149,267,913 204,243,248 3920 Plastic Sheet Meters 4,188,720 2,932,104,077 1,414,761,475 3921 Plothylene Mats Pcs 752,762 4,268,159,576 1,760,497,600 3921 Plothlene Shopping Bags Gross 385,109 3,504,489,716 293,560,341 3923 Plastic Material Dozen/Pcs 2,381,618 12,336,780,515 3,887,193,824 3923 Empty Bottles Pcs 1,670,997 1,169,698,152 1,199,690,034 3926 Plastic Bangles/Ear Rings Doz/Gross 80,425 144,685,439 129,140,007 4009.1 Hose Pipes “Rubber” Meters 910,702 10,072,365,226 399,822,182 4011 Rubber Tyres Pcs 771,832 106,435,632,800 39,963,861,693 4011 Rubber Tubes Pcs 369,666 14,076,881,280 1,265,561,150 4014 Rubber Teats Gross 198,654 4,489,100,142 152,638,597 4016 Car Mats Dozen 90,281 473,977,140 99,475,403 4016 Rubber Band CTN 5,891 65,151,142 82,909,143 4104 Maas KGs 3,811 109,846,471 63,156,870 4202 Suit Case & Hand Bags Dozen/Pcs 277,501 5,167,067,317 3,196,729,456
  • 28.
    Trade Statistical Bulletin2022 Macroeconomics & Statistics Department Page 28 Tariff Number Description Unit/Measure Quantity Value Duties 4407 Timber Wood M3 51,828 4,963,021,510 15,185,021,807 4407.2 Wooden Posts Pcs 105,030 2,082,091,571 2,711,967,397 4407.3 Articles of Wood Pcs 203,179 1,564,478,377 702,862,907 4407.5 Ceiling Hardboard Pcs 273,141 3,938,693,220 2,000,116,277 4412.13 Ply Wood Pcs 410,969 7,796,081,930 3,838,421,778 4601 Praying Mats Dozen 2,482 178,959,410 20,762,843 4602 Hand Brooms Dozen 36,854 185,746,579 35,264,997 4802 Stationary Reams/Dozens 2,783,486 4,091,724,846 3,465,471,709 4818 Napkin Tissue/Toilet Papers Dozen/PKT 387,174 4,390,547,603 329,729,285 4819 Empty Cartons Pcs 27,580 154,447,384 63,041,498 4820 Exercise Books Dozens 29,437 103,028,170 185,595,642 4901 Text Books Dozen 270,342 2,460,109,197 771,465,503 4902 Old Newspapers KGs 412,834 924,748,160 251,570,543 4907 Sim Cards Pcs 2,261,048 3,046,762,625 365,599,250 4910 Calendars Dozens 433 303,240 1,907,785 5204 Sewing Thread BKT 127,558 696,465,970 92,767,004 5513 Unstitched Cloths Yards 136,172,320 219,237,434,508 37,422,120,724 5607 Nylon Ropes Rolls 1,695,457 10,800,061,472 497,931,813 5701 Carpets Meters 874,529 11,876,099,203 8,160,050,650 5705 Door Mats " Dacsado" Dozen 496,786 3,860,029,473 261,589,642 5803 Children Bombers Dozen 8,373,287 97,883,723,043 2,554,591,240 5803 Mosquito Net Pcs 125,126 446,699,213 220,184,574
  • 29.
    Trade Statistical Bulletin2022 Macroeconomics & Statistics Department Page 29 Tariff Number Description Unit/Measure Quantity Value Duties 5904 linoleum "Shamac" Meters 4,583,546 15,400,714,963 3,940,332,712 5908 Wicks Dozen 3,030,691 11,880,309,347 154,341,454 6203 Men's Jackets Pcs 167,180 1,521,339,274 909,626,406 6205 Stitched Clothes Dozen 2,951,973 107,245,172,187 23,863,957,853 6207 Stitched Clothes Scores 380,304 7,320,853,348 4,122,502,844 6217 Belts Dozen 41,464 362,814,113 231,055,456 6301 Blankets Pcs 1,216,600 23,589,879,623 8,758,016,648 6309 Used Clothes Bundles 147,374 31,165,249,565 4,273,296,532 6302 Bed Sheets Scores 113,928 1,228,145,996 509,870,289 6303 Ready Made Curtains Yards 256,699 2,210,176,840 500,485,293 6305 Empty Gunny Bags Pcs 44,604 237,293,280 150,388,521 6309 Used Shoes Bundles 124,097 9,373,008,645 3,029,744,831 6403 Rubber Sandals Dozen 917,010 8,665,743,555 8,897,189,734 6403 Plastic Sandals/Shoes Dozen 932,247 15,727,004,866 9,244,113,188 6403 Leather Shoes Dozen 122,331 3,939,043,388 2,756,574,912 6501 Arabian Hats Dozen 59,428 507,515,632 543,445,069 6601 Umbrellas Dozen 7,495 142,175,787 106,242,964 6602 Walking Sticks Dozen 12,392 93,681,857 183,004,366 6702 Artificial Flowers Pcs 81,330 927,973,246 262,244,885 6811 Burjiko Pcs 119,801 1,576,586,556 312,621,581 6904 Floor Tiles SQ Meters 3,697,804 54,357,724,974 17,838,230,476 6905 Gypsum Ceiling "Roof Tiles" SQ Meter 321,947 5,228,426,263 1,710,185,697 6910 Toilet Basins Pcs 61,109 11,977,397,320 1,900,338,487
  • 30.
    Trade Statistical Bulletin2022 Macroeconomics & Statistics Department Page 30 Tariff Number Description Unit/Measure Quantity Value Duties 6911 Broceiling Ware Sets 90,409 1,961,870,743 918,217,610 7000 Toilet Mirror Pcs 52,112 3,414,378,240 491,564,748 7003 Looking Mirror Dozen 39,096 158,728,055 250,963,221 7003 Glass Sheet SQ Meter 323,462 6,520,990,493 1,095,405,304 7011 Electric Bulbs Dozen 577,511 33,876,814,618 10,083,884,012 7011 Torch Bulbs CTN 28,177 1,232,756,875 27,271,582 7013 Glass Ware Dozen 869,832 75,257,877,618 4,541,835,657 7018 Glass Marbles Gross 68,772 - 312,905,134 7117 Jewelry Gross 7,157 370,242,991 175,207,082 7208 Flat Bars “Bayaati” Pcs 148,697 5,142,983,139 160,093,929 7216 U Shaped Channels Pcs 116,168 73,267,157,600 139,174,281 7222 Iron Bars Tons 43,367 51,074,555,799 26,193,940,872 7222 Bending Wire KGs 724,078 4,115,659,352 519,808,515 7301 Iron Sheets Pcs 3,336,670 71,307,974,570 14,690,062,755 7301 Square Tubes Pcs 1,221,873 93,057,847,680 3,755,613,471 7301 M.S Sheet Pcs 80,161 19,229,822,290 313,939,141 7306 Angular Bars Pcs 190,107 8,410,330,583 411,198,384 7306 G.Iron Pipes Pcs 147,944 27,671,445,760 706,945,107 7306 Water Pipe Fittings Dozens 18,197 1,659,736,513 73,910,893 7306 Furniture Pipes Pcs 912,569 16,992,025,656 43,674,817 7310 Empty Iron Drums Pcs 176,038 83,929,637,260 210,241,564 7310 Iron Tanks Pcs 27 56,700,000 55,391,493 7313 Barberd Fencing Wire KGs 813,686 4,442,726,106 823,702,483
  • 31.
    Trade Statistical Bulletin2022 Macroeconomics & Statistics Department Page 31 Tariff Number Description Unit/Measure Quantity Value Duties 7314 Cross Section Wire KGs 347,818 4,955,277,374 474,927,765 7314 Iron Net "X-pin" Sheet 70,618 3,954,591,200 273,804,854 7314 Iron Net for Windows(Mosquito) Meters 105,286 3,390,209,200 139,637,986 7315 Ordinary Chains Meters 86,549 193,870,723 63,347,440 7317 Iron Nails KGs 3,178,089 17,111,566,608 3,738,950,639 7321 Kerosene Stoves Pcs 10,758 13,699,667,520 43,828,736 7321 Butane Gas Cooking Pcs 6,778 909,725,736 344,403,303 7323 Enamel Ware Dozen 794,147 44,249,854,681 2,392,862,071 7323 Stainless Steel Ware KGs 749,811 13,751,526,771 2,587,034,199 7610 Aluminum Frames KGs 56,423 3,025,401,260 400,928,551 7615 Aluminum Ware KGs 4,488,939 81,070,245,564 3,748,125,893 7617 Foil Paper Rolls 178,650 2,050,365,514 31,177,323 8105 Scrap Tons 61,900 61,199,371,094 727,495,068 8201 Hand Tools Dozen 1,502,432 86,975,812,794 6,206,918,937 8210 Wheel Barrows Pcs 316,295 36,033,943,192 1,101,199,790 8212 Razor Blades Pcs 40,734 354,996,810 59,204,480 8301 Locks Dozen 63,223 13,542,351,606 463,696,232 8302 Hinges/Hand raps Dozen 83,794 9,490,540,153 298,309,130 8303 Safes Pcs 102,275 28,336,217,300 661,231,074 8401 Machines Unit 1,252,151 414,324,363,510 7,805,069,115 8414 Electric Fans Pcs 57,733 3,823,066,016 2,001,133,938 8414 Jacks & Pulley Tackles Pcs 6,240 5,284,406,400 1,304,222,279 8415 Air Condition Pcs 495,808 195,085,377,025 3,145,561,657
  • 32.
    Trade Statistical Bulletin2022 Macroeconomics & Statistics Department Page 32 Tariff Number Description Unit/Measure Quantity Value Duties 8416 Electric Cookers Pcs 27,653 7,806,718,430 1,881,972,956 8418 Refrigerators/Freezers Pcs 71,957 48,168,788,923 4,085,586,932 8442 Photocopy Machine Pcs 23,581 14,842,723,930 295,661,352 8471 Computer & Accessories Pcs 262,974 24,298,780,044 8,730,040,008 8501 Electric Generators Units 66,161 92,625,666,000 3,555,876,733 8504 Transformers “Regulators” Pcs 7,924 3,605,420,000 225,353,169 8506 Dry Cell Battery Dozen 3,822,242 69,029,681,490 1,948,596,422 8506 Car Battery Pcs 225,414 49,246,283,968 6,635,033,775 8509 Electric Appliance Pcs 537,344 38,554,421,955 5,575,333,545 8513 Torches Dozen 406,652 17,990,274,747 2,910,020,132 8516 Electric Iron Pcs 11,555 467,535,125 120,550,233 8517 Telecommunication Parts Items 2,348,496 266,319,487,224 17,850,604,677 8518 Loud Speakers Pcs 795,841 12,868,743,149 877,994,270 8519 Radio Recorders Pcs 29,815 417,414 386,308,655 8519 Cassettes for Recorders Dozen/Pcs 8,694 852,021,800 304,501,774 8525 Cameras Pcs 4,677 173,844,090 2,395,837,708 8526 T.V Accessories Pcs 844,606 89,925,223,179 4,328,547,544 8536 Electric Fittings Dozen 227,481 19,554,263,322 1,495,503,807 8541 Solar Pcs 87,772 14,807,119,530 3,833,899,713 8544 Wires and Cables Meters 13,349,327 36,443,663,666 7,450,976,376 8701 Tractors Units 799 3,494,206,897 422,801,608 8703 Pick Up Cars Units 901 75,684,000,000 2,845,143,514 8703 Station Wagon Units 1,020 107,100,000,000 22,737,916,620
  • 33.
    Trade Statistical Bulletin2022 Macroeconomics & Statistics Department Page 33 Tariff Number Description Unit/Measure Quantity Value Duties 8703 Passenger Buses Units 8,094 215,296,410,000 3,769,701,152 8703 Trucks Units 2,653 41,993,688,874 11,873,160,078 8703 Saloon Cars Units 3,173 44,422,000,000 36,462,348,718 8708 Spare Parts Items 3,710,676 60,521,127,191 13,855,901,437 8712 Bicycles Units 10,743 639,208,500 643,611,564 8714 Motor Cycles Units 29,413 7,784,651,369 5,269,261,536 8715 Baby Walkers Pcs 27,038 824,116,239 267,204,387 9001 Sunglass Dozen 117,825 3,579,516,513 632,297,935 9006 Photographic Camera Pcs 4,475 898,435,129 98,905,323 9022 X-ray Units 12,462 11,427,626,490 541,436,740 9102 Baby Watches Dozen 21,809 610,639,960 44,375,341 9102 Watches Dozen 19,507 669,105,192 377,418,910 9105 Clocks Pcs 4,220 109,213,575 75,745,467 9201 Music Instrument Pcs 45,291 279,511,662 143,060,503 9401 Furniture Pcs 1,048,584 125,662,300,568 18,443,778,680 9402 Hospital Beds Pcs 445 6,634,950 19,237,438 9405 Glass For Lamps Dozen 460 19,674,200 2,853,642 9501 Toys Dozen 132,652 7,994,947,491 1,406,673,244 9504 Games Sets 149,960 13,793,274,810 456,196,999 9506 Sport Equipment Pcs 118,912 8,182,307,196 612,267,844 9601 Miscellaneous Dozen 6,143,474 29,242,937,954 9,299,921,309
  • 34.
    Trade Statistical Bulletin2022 Macroeconomics & Statistics Department Page 34 Appendix 3: Number of Containers imported from Global Countries 2021/2022 No. Country name Container 2021 Container 2022 Diff % 1 UNITED ARAB EMIRATES 8,705 12,833 4,128 47% 2 CHINA 7,545 6,440 -1,105 -15% 3 TURKEY 5,909 6,211 302 5% 4 INDIA 8,027 5,339 -2,688 -33% 5 SAUDI ARABIA 3,166 3,304 138 4% 6 Others (NOT CLEAR) 259 2,197 1,213 468% 7 UNITED STATES 711 836 125 18% 8 BRAZIL 901 773 -128 -14% 9 EGYPT 765 706 -59 -8% 10 MALAYSIA 1,697 583 -1,114 -66% 11 KENYA 410 572 162 40% 12 PAKISTAN 460 543 83 18% 13 INDONESIA 634 390 -244 -38% 14 OMAN 191 344 153 80% 15 ITALY 296 294 -2 -1% 16 THAILAND 218 231 13 6% 17 SPAIN 101 222 121 120% 18 BELGIUM 334 187 -147 -44% 19 UKRAINE 120 178 58 48% 20 UNITED KINGDOM 151 150 -1 -1% 21 IRAN ISLAMIC REP 40 138 98 245% 22 NETHERLANDS 187 138 -49 -26% 23 YEMEN 142 136 -6 -4% 24 MALTA 53 113 60 113% 25 SLOVENIA 33 95 62 188% 26 DENMARK 87 87 0 0% 27 FRANCE 83 83 0 0%
  • 35.
    Trade Statistical Bulletin2022 Macroeconomics & Statistics Department Page 35 28 VIETNAM SOC REP OF 61 81 20 33% 29 DJIBOUTI 895 74 -821 -92% 30 BANGLADESH 258 69 -189 -73% 31 KOREA, REP OF 91 66 -25 -27% 32 SINGAPORE 53 63 10 19% 33 JORDAN 33 49 16 48% 34 TAIWAN 18 47 29 161% 35 QATAR 56 46 -10 -18% 36 SOUTH AFRICA 97 44 -53 -55% 37 CANADA 23 36 13 57% 38 JAPAN 180 36 -144 -80% 39 GERMANY, FED REP OF 29 34 5 17% 40 AUSTRALIA 16 30 14 88% 41 MOROCCO 24 21 -3 -13% 42 POLAND 11 21 10 91% 43 SWEDEN 15 15 0 0% 44 CROATIA 0 14 14 #DIV/0! 45 SOMALI 51 13 -38 -75% 46 KUWAIT 5 12 7 140% 47 RUSSIA 0 10 10 #DIV/0! 48 HONG KONG, CHINA 6 8 2 33% 49 TUNISIA 1 7 6 600% 50 LEBANON 15 6 -9 -60% 51 MAURITIUS 2 6 4 200% 52 NORWAY 10 6 -4 -40% 53 NEW ZEALAND 10 5 -5 -50% 54 SYRIAN ARAB REP 4 4 0 0% 55 ALBANIA 5 3 -2 -40% 56 GREECE 1 3 2 200% 57 TANZANIA 5 3 -2 -40%
  • 36.
    Trade Statistical Bulletin2022 Macroeconomics & Statistics Department Page 36 58 COTE D’IVOIRE 1 2 1 100% 59 FINLAND 7 2 -5 -71% 60 GABON 0 2 2 100% 61 HUNGARY 0 2 2 100% 62 SENEGAL 1 2 1 100% 63 SUDAN 0 2 2 100% 64 ARGENTINA 0 1 1 100% 65 BAHRAIN 16 1 -15 -94% 66 ESTONIA 0 1 1 100% 67 GEORGIA 0 1 1 100% 68 IRELAND 7 1 -6 -86% 69 MOZAMBIQUE 0 1 1 100% 70 ROMANIA 0 1 1 100% 71 SRI LANKA 2 1 -1 -50% 72 UGANDA 0 1 1 100% 73 CHANA 3 0 -3 -100% 74 PANAMA 3 0 -3 -100% 75 IRAN 1 0 -1 -100% 76 PORTUGAL 1 0 -1 -100% 77 CYPRUS 1 0 -1 -100% 78 SIERA LEONE 2 0 -2 -100% 43,245 43,976 731 2%