3. 2014 Year End Membership
GNYC Membership Dec-13 Dec-14 CHANGE % YE Goal Gap
Bronx River 1,208 1,323 115 9.5% 1,308 15
Pathfinder 1,039 1,081 42 4.0% 1,124 -43
Aquehonga 2,264 2,328 64 2.8% 2,350 -22
Breukelen 1,249 1,278 29 2.3% 1,314 -36
Big Apple 990 993 3 0.3% 1,070 -77
Tomahawk 353 354 1 0.3% 390 -36
Founders 1,143 1,122 -21 -1.8% 1,236 -114
Lenape Bay 1,318 1,182 -136 -10.3% 1,369 -187
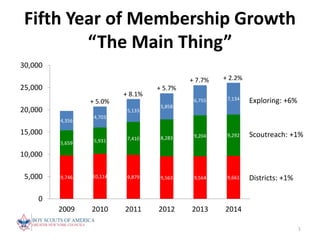
District Total 9,564 9,661 97 1.0% 10,161 -500
Scoutreach 9,204 9,292 88 1.0% 9,400 -108
Total Traditional 18,768 18,953 185 1.0% 19,561 -608
Exploring 6,755 7,134 379 5.6% 7,100 34
Traditional + Exploring 25,523 26,087 564 2.2% 26,661 -574
Learning for Life 20091 20291 200 1.0% 20,000 291
Total Membership 45,614 46,378 764 1.7% 46,661 -283
4. Predicting More Scouting in
New York City
Empowering people who care about
neighborhood kids to create impact using data.
5. Three Value Propositions for GNYC
2.
What areas in NYC
are better suited
for Traditional
Scouting
resources?
3.
Develop a Tool to
Help NYC Decision
Makers Help Us
Attract and Retain
More Scouts.
1.
What areas in
NYC are better
suited for
Scoutreach
resources?
6. GNYC- BSA Membership vs
Median Income
GNYC – BSA Youth
Membership Heat
map
Density
Low High
7. The Next Six Months
• Share findings with key community leaders.
• Invite these leaders to join in identifying prospective
new units along with adult leadership.
• Train volunteers and staff how to effectively use the
Sum All findings to better allocate our Council
resources and grow scouting in existing Packs,
Troops, Crews and Posts.