
Recommended
More Related Content
Similar to Annual CBO Performance Report 2014.08.06
Similar to Annual CBO Performance Report 2014.08.06 (20)
More from William (Bill) Kosanovich
More from William (Bill) Kosanovich (6)
Annual CBO Performance Report 2014.08.06
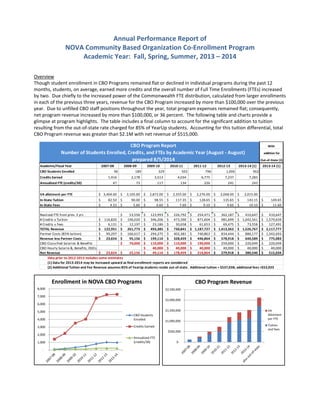
- 1. Annual Performance Report of NOVA Community Based Organization Co‐Enrollment Program Academic Year: Fall, Spring, Summer, 2013 – 2014 Overview Though student enrollment in CBO Programs remained flat or declined in individual programs during the past 12 months, students, on average, earned more credits and the overall number of Full Time Enrollments (FTEs) increased by two. Due chiefly to the increased power of the Commonwealth FTE distribution, calculated from larger enrollments in each of the previous three years, revenue for the CBO Program increased by more than $100,000 over the previous year. Due to unfilled CBO staff positions throughout the year, total program expenses remained flat; consequently, net program revenue increased by more than $100,000, or 36 percent. The following table and charts provide a glimpse at program highlights. The table includes a final column to account for the significant addition to tuition resulting from the out‐of‐state rate charged for 85% of YearUp students. Accounting for this tuition differential, total CBO Program revenue was greater than $2.1M with net revenue of $515,000. ‐ 1,000 2,000 3,000 4,000 5,000 6,000 7,000 8,000 Enrollment in NOVA CBO Programs CBO Students Enrolled Credits Earned Annualized FTE (credits/30) $‐ $500,000 $1,000,000 $1,500,000 $2,000,000 $2,500,000 CBO Program Revenue VA Allotment per FTE Tuition and fees CBO Program Report With Number of Students Enrolled, Credits, and FTEs by Academic Year (August ‐ August) addition for prepared 8/5/2014 Out‐of‐State (2) Academic/Fiscal Year 2007‐08 2008‐09 2009‐10 2010‐11 2011‐12 2012‐13 2013‐14 (1) 2013‐14 (1) CBO Students Enrolled 96 189 329 502 796 1,006 962 Credits Earned 1,416 2,178 3,513 4,034 6,775 7,237 7,283 Annualized FTE (credits/30) 47 73 117 134 226 241 243 VA allotment per FTE 3,404.00$ 3,105.00$ 2,872.00$ 2,355.00$ 2,276.00$ 2,048.00$ 2,015.00$ In‐State Tuition 82.50$ 90.00$ 98.55$ 117.35$ 128.65$ 135.65$ 143.15$ 149.65$ In‐State Fees 4.33$ 5.60$ 6.60$ 7.60$ 9.10$ 9.60$ 10.10$ 11.60$ Realized FTE from prev. 3 yrs 53,556$ 123,993$ 226,792$ 254,471$ 362,187$ 410,647$ 410,647$ # Credits x Tuition 116,820$ 196,020$ 346,206$ 473,390$ 871,604$ 981,699$ 1,042,561$ 1,579,639$ # Credits x Fees 6,131$ 12,197$ 23,186$ 30,658$ 61,653$ 69,475$ 73,558$ 127,491$ TOTAL Revenue 122,951$ 261,773$ 493,385$ 730,841$ 1,187,727$ 1,413,362$ 1,526,767$ 2,117,777$ Partner Costs (85% tuition) 99,297$ 166,617$ 294,275$ 402,381$ 740,863$ 834,444$ 886,177$ 1,342,693$ Revenue less Partner Costs 23,654$ 95,156$ 199,110$ 328,459$ 446,864$ 578,918$ 640,589$ 775,083$ CBO Classified Salaries & Benefits 70,000$ 110,000$ 110,000$ 190,000$ 259,000$ 220,049$ 220,049$ CBO Hourly Salarie &, Benefits, ODCs 40,000$ 40,000$ 40,000$ 40,000$ 40,000$ 40,000$ Net Revenue 23,654$ 25,156$ 49,110$ 178,459$ 216,864$ 279,918$ 380,540$ 515,034$ Data prior to 2012‐2013 includes some estimates (1) Data for 2013‐2014 may be increased upward as final enrollment reports are considered (2) Additional Tuition and Fee Revenue assumes 85% of YearUp students reside out‐of‐state. Additional tuition = $537,038; additional fees =$53,933
- 2. NOVA CBO Co‐Enrollment Program Annual Performance Report 2013‐2014, August 5, 2014 Page 2 Major Accomplishments, 2013‐2014 First two cohorts completed NVFS Training Futures program at MIP TF Curriculum revisions implemented allowing first TF cohort to receive CSC in BIT at graduation ESL III Program launched with EDG in Arlington; anticipate offering two levels in fall semester Newest Partner: Quantom Studios Launched after school program with w/ Urban Alliance; feeds students into PtB Launched program with Alexandria City Public Schools Plugged In Virginia Program Awarded Institutional Champion of Access and Success by the Institute for Higher Education Policy Awarded competitive grant from AACC for the Walmart Foundation; one of only four mentor colleges nationally Looking forward to 2014‐2015 Implement CBO Program Staffing Plan Three Coordinator positions: Student Services (vacant), Program Operations (vacant), Faculty & Curriculum Three new part time Program Advisor positions incorporating roles of project manager and student advisor. Program Advisors will be embedded onsite with CBO Programs to regularize and improve overall NOVA service to CBO partners and develop stronger and deeper connection with students with anticipated impact of CBO students increasing further NOVA study. New Partner and Program Development Arlington County Sheriff’s Department Catholic Charities ESL prequel to TF at MIP National Apartment Association for Certified Apartment Maintenance Technician (CAM‐T) OAR in Fairfax County CORE hub in Bailey’s Crossing UCM or NVFS in Rt. 1 Corridor Leverage size, scope, and resources of CBO partners & CBO Program to develop combined marketing strategy Conclusion As the power of FTE averaging increased in 2013‐2014, total CBO Program revenue and net revenue rose significantly – in spite of flat enrollments. The CBO program has now consistently demonstrated by a wide margin sustainability derived solely from tuition and state FTE funding. A closer analysis of cost per credit should be conducted in comparison with cost per credit of students on campuses. It would be of value to investigate if it is less expensive to offer a wider variety of educational opportunities off campus and in partnership with community‐based organizations that deliver a broad range of complementary services that support high levels of student achievement and success. Ron Buchanan has indicated a “decision” regarding program sustainability in November. When sustainability is further demonstrated in November, no further cost would be required and second position could be filled to deliver on‐site presence and NOVA support to all CBO partners. hi i l fl h t D bi l i d l $‐ $200,000 $400,000 $600,000 $800,000 $1,000,000 $1,200,000 $1,400,000 $1,600,000 $1,800,000 CBO Program Expenses Hourly Staff & Program CBO Classified Staff Partner Costs (85% tuition) $‐ $500,000 $1,000,000 $1,500,000 $2,000,000 $2,500,000 CBO Program Net Revenue TOTAL Revenue TOTAL Expenses Net Revenue