SlideShare a Scribd company logo
averages to eliminate monthly and
seasonal variations.
If you are planning on selling your property,
call me for a free comparative market
analysis.
The median sales price for single-family,
re-sale was down 3.3% in June from May.
It was down 13.8% year-over-year.
The average sales price for single-family,
re-sale homes was down 5.4% month-
over-month. Year-over-year, it was down
10.9%.
Sales of single-family, re-sale homes fell
13.9% year-over-year. There were 198
homes sold in San Francisco last month.
The average since 2000 is 214.
The median sales price for condos/lofts
was down 12.2% year-over-year.
The average sales price was down 7.3%
year-over-year.
Sales of condos/lofts fell 35.3% year-over-
year. There were 189 condos/lofts sold
last month. The average since 2000 is
230.
The sales price to list price ratio, or what
buyers are paying over what sellers are
asking, rose from 104.1% to 105% for
homes. The ratio for condos/townhomes
rose from 99.9% to 100.3%.
Average days on market, or the time from
when a property is listed to when it goes
into contract, was 25 for homes and 50
for condos/lofts.
Sales momentum…
for homes rose from –45.9 to –44.3.
Sales momentum for condos/lofts was
down 0.4 of a point to –
67.7.
Pricing
momentum…
for single-family homes
fell 1 point to –17.5.
Pricing momentum for
condos/lofts fell 1.3
points to –9.4.
Our momentum
statistics are based on
12-month moving
Sotheby's International Realty
117 Greenwich Street
San Francisco, CA 94111
Cell: (415) 819-2663
AnnieWilliamsSF@gmail.com
http://www.anniewilliamshomes.com
Annie Williams
ANNIE WILLIAMS | ANNIEWILLIAMSSF@GMAIL.COM | HTTP://WWW.ANNIEWILLIAMSHOMES.COM
Prices and Sales Continue to Drop
Local Market Trends July 2023
San Francisco
Jun 23 Month % May 23 Year % Jun 22
Median Price: 1,595,000
$ -3.3% 1,650,000
$ -13.8% 1,850,070
$
Average Price: 2,021,635
$ -5.4% 2,138,057
$ -10.9% 2,269,212
$
Home Sales: 198 7.6% 184 -13.9% 230
Sale/List Price Ratio: 105.0% 0.9% 104.1% -8.2% 114.4%
Days on Market: 25 -12.2% 28 53.7% 16
(Condominiums)
Jun 23 Month % May 23 Year % Jun 22
Median Price: 1,100,000
$ -4.3% 1,150,000
$ -12.2% 1,252,500
$
Average Price: 1,264,974
$ 6.3% 1,189,507
$ -7.3% 1,365,157
$
Condo Sales: 189 -14.5% 221 -35.3% 292
Sale/List Price Ratio: 100.3% 0.4% 99.9% -4.8% 105.3%
Days on Market: 50 -10.1% 56 32.5% 38
Trends at a Glance
(Single-family Homes)
0
10
20
30
40
50
60
70
80
90
1
0
A J O 1
1
A J O 1
2
A J O 1
3
A J O 1
4
A J O 1
5
A J O 1
6
A J O 1
7
A J O 1
8
A J O 1
9
A J O 2
0
A J O 2
1
A J O 2
2
A J O 2
3
A
San Francisco Homes: Days on Market
© 2023 rereport.com
Jun 30, 2023 -- It's becoming both clearer and
more likely that the Fed will lift rates at its next meet-
ing in July, and based on comments this week from
Fed Chair Jay Powell, the potential also exists that
back-to-back increases could come over the next two
meetings, as a pair of moves is "not off the table", per
Mr. Powell. He also noted that "If you look at the data
over the last quarter, what you see is stronger than
expected growth, a tighter than expected labor mar-
ket, and higher than expected inflation."
That trio of factors gives the Fed plenty of reason to
resume its rate hiking campaign. Perhaps the only
items that might see the Fed extend their so-far one-
meeting "pause" are the unclear effects of this
spring's banking troubles and that there's little history
on how the economy and inflation will fully react to a
500 basis point increase in short-term rates over just
a year's time.
Could the central bank "skip" July, too? It's certainly
possible, as another six weeks of holding off would
likely do little damage in the inflation fight. However,
with few signs that the economy is rapidly slowing,
the labor market loosening measurably or inflation
cooling at a faster rate, there's not a lot of reason to
expect the Fed to hold their fire. That said, there is
still a month's worth of data due out before the next
Fed meeting, and a stronger nudge in the right direc-
tion on one or more of these fronts might be enough
proof that policy already in place is sufficient to reach
the Fed's goals, but probably not.
Economic growth is also getting a bit of support from
home building and sales, and thin inventories of
homes for sale in the existing housing market are
pushing at least some buyers over to the new con-
struction market. Sales of newly-constructed home
rose by a stout 12.2% in May, climbing to a 763,000
annual rate of sale, the fastest pace since February
2022. The surge in sales pulled the supply of new
homes down to 6.7 months at the current rate of sale,
with the 428,000 units available the fewest number in
more than a year. This should provide builders with
incentive to keep construction humming over at least
the next few months. To help move stock, builders
have been using incentives that include price conces-
sions and subsidizing financing, but those discounts
and offers are being used somewhat less often of
late, at least according to the National Association of
(Continued on page 4)
ANNIE WILLIAMS
SOTHEBY'S INTERNATIONAL REALTY
ANNIEWILLIAMSSF@GMAIL.COM
2 Local Market Trends | San Francisco |
Stronger Data, Firmer Rates
The chart above shows the National monthly
average for 30-year fixed rate mortgages as
compiled by http://www.freddiemac.com/.
July 2023
1.0% 3.0% 5.0% 7.0% 9.0%
01-10
07-10
01-11
07-11
01-12
07-12
01-13
07-13
01-14
07-14
01-15
07-15
01-16
07-16
01-17
07-17
01-18
07-18
01-19
07-19
01-20
07-20
01-21
07-21
01-22
07-22
01-23
30-Year Fixed Mortgage Rates
0
50
100
150
200
250
300
350
$300
$800
$1,300
$1,800
$2,300
$2,800
1
0
A J O 1
1
A J O 1
2
A J O 1
3
A J O 1
4
A J O 1
5
A J O 1
6
A J O 1
7
A J O 1
8
A J O 1
9
A J O 2
0
A J O 2
1
A J O 2
2
A J O 2
3
A
San Francisco Homes: Sold Prices & Unit Sales
(3-month moving average — $000's)
Ave Med Units © 2023 rereport.com
Unit
Median Average Sales DOM SP/LP Median Average Sales Median Average Sales
San Francisco $1,595,000 $2,021,635 198 25 105.0% -13.8% -10.9% -13.9% -3.3% -5.4% 7.6%
D1: Northwest $2,330,000 $2,520,952 21 24 103.8% -6.8% 5.9% 31.3% 24.1% 6.3% 162.5%
D2: Central West $1,525,000 $1,520,286 32 22 115.2% -16.1% -20.0% -37.3% -4.7% -12.7% -13.5%
D3: Southwest $1,288,000 $1,468,182 11 18 115.8% -15.9% -9.3% 10.0% -4.6% 8.4% -26.7%
D4: Twin Peaks $1,700,000 $1,804,380 25 20 110.2% -20.6% -24.1% -26.5% -6.8% -7.9% 8.7%
D5: Central $1,803,000 $2,196,410 21 29 101.1% -35.7% -24.3% -44.7% -23.9% -20.6% -32.3%
D6: Central North $1,837,500 $1,815,850 6 32 121.3% -43.2% -40.4% 50.0% -33.8% -34.6% 200.0%
D7: North $4,797,500 $5,524,714 14 40 95.2% -24.7% 1.1% 75.0% -24.2% -18.0% 16.7%
D8: Northeast $3,700,000 $3,700,000 1 35 97.7% -26.0% -37.8% -75.0% n/a n/a n/a
D9: Central East $1,817,500 $2,018,500 26 25 104.5% -4.3% 3.6% 23.8% 23.6% 26.2% 85.7%
D10: Southeast $1,125,000 $1,128,805 39 25 108.3% -11.8% -14.4% -11.4% -5.1% -2.9% -9.3%
June Sales Statistics
(Single-family Homes)
Prices Yearly Change Monthly Change
Table Definitions
_______________
Median Price
The price at which 50% of prices
were higher and 50% were lower.
Average Price
Add all prices and divide by the
number of sales.
SP/LP
Sales price to list price ratio or the
price paid for the property divided
by the asking price.
DOI
Days of Inventory, or how many
days it would take to sell all the
property for sale at the current rate
of sales.
Pend
Property under contract to sell that
hasn’t closed escrow.
Inven
Number pf properties actively for
sale as of the last day of the month.
Local Market Trends | San Francisco | 3
July 2023
ANNIE WILLIAMS
SOTHEBY'S INTERNATIONAL REALTY
ANNIEWILLIAMSSF@GMAIL.COM
80.0%
85.0%
90.0%
95.0%
100.0%
105.0%
110.0%
115.0%
120.0%
125.0%
1
0
A J O 1
1
A J O 1
2
A J O 1
3
A J O 1
4
A J O 1
5
A J O 1
6
A J O 1
7
A J O 1
8
A J O 1
9
A J O 2
0
A J O 2
1
A J O 2
2
A J O 2
3
A
San Francisco Homes: Sales Price to List Price Ratio
© 2023 rereport.com
-50.0
-40.0
-30.0
-20.0
-10.0
0.0
10.0
20.0
30.0
40.0
0
6
A J O 0
7
A J O 0
8
A J O 0
9
A J O 1
0
A J O 1
1
A J O 1
2
A J O 1
3
A J O 1
4
A J O 1
5
A J O 1
6
A J O 1
7
A J O 1
8
A J O 1
9
A J O 2
0
A J O 2
1
A J O 2
2
A J O 2
3
A
San Francisco Homes: Sales Momentum
Sales Pricing © 2023 rereport.com
0
100
200
300
400
500
$300
$500
$700
$900
$1,100
$1,300
$1,500
$1,700
1
0
A J O 1
1
A J O 1
2
A J O 1
3
A J O 1
4
A J O 1
5
A J O 1
6
A J O 1
7
A J O 1
8
A J O 1
9
A J O 2
0
A J O 2
1
A J O 2
2
A J O 2
3
A
San Francisco Condos: Sold Prices & Unit Sales
(3-month moving average — $000's)
Ave Med Units © 2023 rereport.com
Unit
Median Average Sales DOM SP/LP Median Average Sales Median Average Sales
San Francisco $1,100,000 $1,264,974 189 50 100.3% -12.2% -7.3% -35.3% -4.3% 6.3% -14.5%
D1: Northwest $1,150,000 $1,435,636 11 25 103.6% -20.4% 9.8% -15.4% -14.2% 4.8% -26.7%
D2: Central West $952,500 $1,040,750 4 25 100.8% -38.5% -40.9% 33.3% -32.7% -26.4% 100.0%
D3: Southwest $1,475,000 $1,475,000 1 42 105.4% 25.0% 46.0% -80.0% 38.4% 38.3% -75.0%
D4: Twin Peaks $980,000 $839,939 3 67 93.2% 9.0% -20.2% 0.0% 17.4% -11.8% -66.7%
D5: Central $1,227,500 $1,343,328 32 36 103.9% -18.2% -12.1% -54.3% -12.3% -7.7% -25.6%
D6: Central North $1,010,000 $1,108,597 24 42 102.9% -19.2% -14.1% -25.0% -15.5% -12.2% 9.1%
D7: North $1,601,500 $1,865,857 14 45 102.5% -5.8% 6.0% -48.1% 8.6% 20.1% -46.2%
D8: Northeast $922,000 $1,156,306 36 45 99.6% -12.2% -10.3% -12.2% 15.4% 20.8% 2.9%
D9: Central East $1,117,500 $1,256,170 56 56 96.7% -2.0% -0.5% -37.8% 33.0% 26.6% -5.1%
D10: Southeast $898,500 $892,167 6 218 98.1% 30.7% 24.7% -25.0% 6.4% 21.7% 50.0%
June Sales Statistics
(Condos/TICs/Co-ops/Lofts)
Prices Yearly Change Monthly Change
San Francisco
This Real Estate Report is published and copyrighted by http://rereport.com.
Information contained herein is deemed accurate and correct, but no warranty is implied or given.
Annie Williams
Sotheby's International Realty
117 Greenwich Street
San Francisco, CA 94111
Go online to see the full report with the district by district breakdown: https://rereport.com/sf/aw/
Home Builders. The median price of a new home
sold in May was $416,300, turning higher again
after a meaningful decline from last October's
$496,800 peak, probably reflect the lessened use
of price cuts by builders last month.
Price discounts and financing help are far less com-
mon in the existing home market, but may become
more of a part of the marketing arsenal if mortgage
rates don't show a meaningful decline
soon. Sales of existing homes are only
perking along at a modest level, one that
is likely to become even more modest in
the coming month or two. The National
Association of Realtors Pending Home
Sales Index for May posted a 2.7% de-
cline; this measure of purchase contracts
signed suggests that existing home sales
for June and July will struggle to hold
present levels of about 4.3 million
(annualized). The PHSI has now posted
declines in each of the last three months,
usually the busiest time of year for hous-
ing.
Despite mortgage rates closer to recent
highs than not, applications for mortgages
managed a small increase last week. In
(Continued from page 2) the week ending June 25, the Mortgage Bankers
Association reported a 3% increase in requests for
mortgage credit, a third consecutive gain. Applica-
tions for purchase-money mortgages rose by 2.8%;
those to refinance existing loans managed a 3.3%
bump. A holiday is on tap again for next week and
mortgage rates seem poised to rise a bit more in
the coming days, and this will probably break the
unexpected streak of small increases in applica-
tions seen over the last few weeks.
2009 2010 2011 2012 2013 2014 2015 2016 2017 2018 2019 2020 2021 2022 2023
Condos 730 1,218 1,311 1,542 1,581 1,575 1,447 1,315 1,420 1,545 1,460 959 2,234 1,775 1,096
Homes 835 1,167 1,184 1,258 1,367 1,095 1,265 1,228 1,039 1,071 1,038 748 1,386 1,256 881
0
500
1,000
1,500
2,000
2,500
3,000
3,500
4,000
Property Sales
(Year-to-Date)
© 2023 rereport.com

More Related Content

Similar to Annie Williams Real Estate Report-July 2023

Annie Williams Real Estate Report-September 2023-9.pdf
Annie Williams Real Estate Report-September 2023-9.pdfAnnie Williams Real Estate Report-September 2023-9.pdf
Annie Williams Real Estate Report-September 2023-9.pdf
Annie Williams
 
Annie Williams Real Estate Report - August 2020
Annie Williams Real Estate Report - August 2020Annie Williams Real Estate Report - August 2020
Annie Williams Real Estate Report - August 2020
Jon Weaver
 
Annie Williams Real Estate Report - April 2023
Annie Williams Real Estate Report - April 2023Annie Williams Real Estate Report - April 2023
Annie Williams Real Estate Report - April 2023
Annie Williams
 
Annie Williams Real Estate Report - November 2020
Annie Williams Real Estate Report - November 2020Annie Williams Real Estate Report - November 2020
Annie Williams Real Estate Report - November 2020
Jon Weaver
 
Annie Williams Real Estate Report - July 2020
Annie Williams Real Estate Report - July 2020Annie Williams Real Estate Report - July 2020
Annie Williams Real Estate Report - July 2020
Jon Weaver
 
Annie Williams Real Estate Report - September 2020
Annie Williams Real Estate Report - September 2020Annie Williams Real Estate Report - September 2020
Annie Williams Real Estate Report - September 2020
Jon Weaver
 
Annie Williams Real Estate Report - August 2021
Annie Williams Real Estate Report - August 2021Annie Williams Real Estate Report - August 2021
Annie Williams Real Estate Report - August 2021
Annie Williams
 
Annie Williams Real Estate Report - February 2022
Annie Williams Real Estate Report - February 2022Annie Williams Real Estate Report - February 2022
Annie Williams Real Estate Report - February 2022
Annie Williams
 
Annie Williams Real Estate Report - January 2021
Annie Williams Real Estate Report - January 2021Annie Williams Real Estate Report - January 2021
Annie Williams Real Estate Report - January 2021
Jon Weaver
 
Annie Williams Real Estate Report - March 2020
Annie Williams Real Estate Report - March 2020Annie Williams Real Estate Report - March 2020
Annie Williams Real Estate Report - March 2020
Jon Weaver
 
Annie Williams Real Estate Report - December 2021
Annie Williams Real Estate Report - December 2021Annie Williams Real Estate Report - December 2021
Annie Williams Real Estate Report - December 2021
Annie Williams
 
Annie Williams Real Estate Report - November 2021
Annie Williams Real Estate Report - November 2021Annie Williams Real Estate Report - November 2021
Annie Williams Real Estate Report - November 2021
Annie Williams
 
Annie Williams Real Estate Report - February 2020
Annie Williams Real Estate Report - February 2020Annie Williams Real Estate Report - February 2020
Annie Williams Real Estate Report - February 2020
Jon Weaver
 
Annie Williams Market Trends June-July 2016
Annie Williams Market Trends June-July 2016Annie Williams Market Trends June-July 2016
Annie Williams Market Trends June-July 2016
Jon Weaver
 
Annie Williams Real Estate Report - November 2019
Annie Williams Real Estate Report - November 2019Annie Williams Real Estate Report - November 2019
Annie Williams Real Estate Report - November 2019
Jon Weaver
 
Annie Williams Real Estate Report - October 2019
Annie Williams Real Estate Report - October 2019Annie Williams Real Estate Report - October 2019
Annie Williams Real Estate Report - October 2019
Jon Weaver
 
Annie Williams Real Estate Report - October 2021
Annie Williams Real Estate Report - October 2021Annie Williams Real Estate Report - October 2021
Annie Williams Real Estate Report - October 2021
Annie Williams
 
Prices Reach All-Time Highs, Again - Real Estate Report July/August
Prices Reach All-Time Highs, Again - Real Estate Report July/AugustPrices Reach All-Time Highs, Again - Real Estate Report July/August
Prices Reach All-Time Highs, Again - Real Estate Report July/August
AMSI, San Francisco
 
Annie Williams Real Estate Report - September 2021
Annie Williams Real Estate Report - September 2021Annie Williams Real Estate Report - September 2021
Annie Williams Real Estate Report - September 2021
Annie Williams
 
Annie Williams Real Estate Report Sept-Oct 2016
Annie Williams Real Estate Report Sept-Oct 2016Annie Williams Real Estate Report Sept-Oct 2016
Annie Williams Real Estate Report Sept-Oct 2016
Annie Williams
 

Similar to Annie Williams Real Estate Report-July 2023 (20)

Annie Williams Real Estate Report-September 2023-9.pdf
Annie Williams Real Estate Report-September 2023-9.pdfAnnie Williams Real Estate Report-September 2023-9.pdf
Annie Williams Real Estate Report-September 2023-9.pdf
 
Annie Williams Real Estate Report - August 2020
Annie Williams Real Estate Report - August 2020Annie Williams Real Estate Report - August 2020
Annie Williams Real Estate Report - August 2020
 
Annie Williams Real Estate Report - April 2023
Annie Williams Real Estate Report - April 2023Annie Williams Real Estate Report - April 2023
Annie Williams Real Estate Report - April 2023
 
Annie Williams Real Estate Report - November 2020
Annie Williams Real Estate Report - November 2020Annie Williams Real Estate Report - November 2020
Annie Williams Real Estate Report - November 2020
 
Annie Williams Real Estate Report - July 2020
Annie Williams Real Estate Report - July 2020Annie Williams Real Estate Report - July 2020
Annie Williams Real Estate Report - July 2020
 
Annie Williams Real Estate Report - September 2020
Annie Williams Real Estate Report - September 2020Annie Williams Real Estate Report - September 2020
Annie Williams Real Estate Report - September 2020
 
Annie Williams Real Estate Report - August 2021
Annie Williams Real Estate Report - August 2021Annie Williams Real Estate Report - August 2021
Annie Williams Real Estate Report - August 2021
 
Annie Williams Real Estate Report - February 2022
Annie Williams Real Estate Report - February 2022Annie Williams Real Estate Report - February 2022
Annie Williams Real Estate Report - February 2022
 
Annie Williams Real Estate Report - January 2021
Annie Williams Real Estate Report - January 2021Annie Williams Real Estate Report - January 2021
Annie Williams Real Estate Report - January 2021
 
Annie Williams Real Estate Report - March 2020
Annie Williams Real Estate Report - March 2020Annie Williams Real Estate Report - March 2020
Annie Williams Real Estate Report - March 2020
 
Annie Williams Real Estate Report - December 2021
Annie Williams Real Estate Report - December 2021Annie Williams Real Estate Report - December 2021
Annie Williams Real Estate Report - December 2021
 
Annie Williams Real Estate Report - November 2021
Annie Williams Real Estate Report - November 2021Annie Williams Real Estate Report - November 2021
Annie Williams Real Estate Report - November 2021
 
Annie Williams Real Estate Report - February 2020
Annie Williams Real Estate Report - February 2020Annie Williams Real Estate Report - February 2020
Annie Williams Real Estate Report - February 2020
 
Annie Williams Market Trends June-July 2016
Annie Williams Market Trends June-July 2016Annie Williams Market Trends June-July 2016
Annie Williams Market Trends June-July 2016
 
Annie Williams Real Estate Report - November 2019
Annie Williams Real Estate Report - November 2019Annie Williams Real Estate Report - November 2019
Annie Williams Real Estate Report - November 2019
 
Annie Williams Real Estate Report - October 2019
Annie Williams Real Estate Report - October 2019Annie Williams Real Estate Report - October 2019
Annie Williams Real Estate Report - October 2019
 
Annie Williams Real Estate Report - October 2021
Annie Williams Real Estate Report - October 2021Annie Williams Real Estate Report - October 2021
Annie Williams Real Estate Report - October 2021
 
Prices Reach All-Time Highs, Again - Real Estate Report July/August
Prices Reach All-Time Highs, Again - Real Estate Report July/AugustPrices Reach All-Time Highs, Again - Real Estate Report July/August
Prices Reach All-Time Highs, Again - Real Estate Report July/August
 
Annie Williams Real Estate Report - September 2021
Annie Williams Real Estate Report - September 2021Annie Williams Real Estate Report - September 2021
Annie Williams Real Estate Report - September 2021
 
Annie Williams Real Estate Report Sept-Oct 2016
Annie Williams Real Estate Report Sept-Oct 2016Annie Williams Real Estate Report Sept-Oct 2016
Annie Williams Real Estate Report Sept-Oct 2016
 

More from Annie Williams

Annie Williams Real Estate Report - March 2022
Annie Williams Real Estate Report - March 2022Annie Williams Real Estate Report - March 2022
Annie Williams Real Estate Report - March 2022
Annie Williams
 
Annie Williams Real Estate Report - March 2021
Annie Williams Real Estate Report - March 2021Annie Williams Real Estate Report - March 2021
Annie Williams Real Estate Report - March 2021
Annie Williams
 
Annie Williams Real Estate Report - February 2021
Annie Williams Real Estate Report - February 2021Annie Williams Real Estate Report - February 2021
Annie Williams Real Estate Report - February 2021
Annie Williams
 
Annie Williams - San Francisco Demographics - Household Expenditures
Annie Williams - San Francisco Demographics - Household ExpendituresAnnie Williams - San Francisco Demographics - Household Expenditures
Annie Williams - San Francisco Demographics - Household Expenditures
Annie Williams
 
Annie Williams - San Francisco Demographics - Commuting
Annie Williams - San Francisco Demographics - CommutingAnnie Williams - San Francisco Demographics - Commuting
Annie Williams - San Francisco Demographics - Commuting
Annie Williams
 
Annie Williams - San Francisco Demographics - Employment
Annie Williams - San Francisco Demographics - EmploymentAnnie Williams - San Francisco Demographics - Employment
Annie Williams - San Francisco Demographics - Employment
Annie Williams
 
Annie Williams - San Francisco Demographics - Median Income by Education & Sex
Annie Williams - San Francisco Demographics - Median Income by Education & SexAnnie Williams - San Francisco Demographics - Median Income by Education & Sex
Annie Williams - San Francisco Demographics - Median Income by Education & Sex
Annie Williams
 
Annie Williams - San Francisco Demographics - Education
Annie Williams - San Francisco Demographics - EducationAnnie Williams - San Francisco Demographics - Education
Annie Williams - San Francisco Demographics - Education
Annie Williams
 
Annie Williams Real Estate Report - March 2018
Annie Williams Real Estate Report - March 2018Annie Williams Real Estate Report - March 2018
Annie Williams Real Estate Report - March 2018
Annie Williams
 
Annie Williams - San Francisco Demographics - Beliefs & Practices
Annie Williams - San Francisco Demographics - Beliefs & PracticesAnnie Williams - San Francisco Demographics - Beliefs & Practices
Annie Williams - San Francisco Demographics - Beliefs & Practices
Annie Williams
 
Annie Williams - San Francisco Demographics - Religion or Lack Thereof
Annie Williams - San Francisco Demographics - Religion or Lack ThereofAnnie Williams - San Francisco Demographics - Religion or Lack Thereof
Annie Williams - San Francisco Demographics - Religion or Lack Thereof
Annie Williams
 
Annie Williams Real Estate Report July-Aug 2017
Annie Williams Real Estate Report July-Aug 2017Annie Williams Real Estate Report July-Aug 2017
Annie Williams Real Estate Report July-Aug 2017
Annie Williams
 
Annie W: Interest Rate History since 1995
Annie W: Interest Rate History since 1995Annie W: Interest Rate History since 1995
Annie W: Interest Rate History since 1995
Annie Williams
 
Annie Williams 2016 Annual Real Estate Report
Annie Williams 2016 Annual Real Estate ReportAnnie Williams 2016 Annual Real Estate Report
Annie Williams 2016 Annual Real Estate Report
Annie Williams
 
Annie Williams Real Estate Report Nov-Dec 2016
Annie Williams Real Estate Report Nov-Dec 2016Annie Williams Real Estate Report Nov-Dec 2016
Annie Williams Real Estate Report Nov-Dec 2016
Annie Williams
 

More from Annie Williams (15)

Annie Williams Real Estate Report - March 2022
Annie Williams Real Estate Report - March 2022Annie Williams Real Estate Report - March 2022
Annie Williams Real Estate Report - March 2022
 
Annie Williams Real Estate Report - March 2021
Annie Williams Real Estate Report - March 2021Annie Williams Real Estate Report - March 2021
Annie Williams Real Estate Report - March 2021
 
Annie Williams Real Estate Report - February 2021
Annie Williams Real Estate Report - February 2021Annie Williams Real Estate Report - February 2021
Annie Williams Real Estate Report - February 2021
 
Annie Williams - San Francisco Demographics - Household Expenditures
Annie Williams - San Francisco Demographics - Household ExpendituresAnnie Williams - San Francisco Demographics - Household Expenditures
Annie Williams - San Francisco Demographics - Household Expenditures
 
Annie Williams - San Francisco Demographics - Commuting
Annie Williams - San Francisco Demographics - CommutingAnnie Williams - San Francisco Demographics - Commuting
Annie Williams - San Francisco Demographics - Commuting
 
Annie Williams - San Francisco Demographics - Employment
Annie Williams - San Francisco Demographics - EmploymentAnnie Williams - San Francisco Demographics - Employment
Annie Williams - San Francisco Demographics - Employment
 
Annie Williams - San Francisco Demographics - Median Income by Education & Sex
Annie Williams - San Francisco Demographics - Median Income by Education & SexAnnie Williams - San Francisco Demographics - Median Income by Education & Sex
Annie Williams - San Francisco Demographics - Median Income by Education & Sex
 
Annie Williams - San Francisco Demographics - Education
Annie Williams - San Francisco Demographics - EducationAnnie Williams - San Francisco Demographics - Education
Annie Williams - San Francisco Demographics - Education
 
Annie Williams Real Estate Report - March 2018
Annie Williams Real Estate Report - March 2018Annie Williams Real Estate Report - March 2018
Annie Williams Real Estate Report - March 2018
 
Annie Williams - San Francisco Demographics - Beliefs & Practices
Annie Williams - San Francisco Demographics - Beliefs & PracticesAnnie Williams - San Francisco Demographics - Beliefs & Practices
Annie Williams - San Francisco Demographics - Beliefs & Practices
 
Annie Williams - San Francisco Demographics - Religion or Lack Thereof
Annie Williams - San Francisco Demographics - Religion or Lack ThereofAnnie Williams - San Francisco Demographics - Religion or Lack Thereof
Annie Williams - San Francisco Demographics - Religion or Lack Thereof
 
Annie Williams Real Estate Report July-Aug 2017
Annie Williams Real Estate Report July-Aug 2017Annie Williams Real Estate Report July-Aug 2017
Annie Williams Real Estate Report July-Aug 2017
 
Annie W: Interest Rate History since 1995
Annie W: Interest Rate History since 1995Annie W: Interest Rate History since 1995
Annie W: Interest Rate History since 1995
 
Annie Williams 2016 Annual Real Estate Report
Annie Williams 2016 Annual Real Estate ReportAnnie Williams 2016 Annual Real Estate Report
Annie Williams 2016 Annual Real Estate Report
 
Annie Williams Real Estate Report Nov-Dec 2016
Annie Williams Real Estate Report Nov-Dec 2016Annie Williams Real Estate Report Nov-Dec 2016
Annie Williams Real Estate Report Nov-Dec 2016
 

Recently uploaded

原版制作(Greenwich毕业证书)格林威治大学毕业证PDF成绩单一模一样
原版制作(Greenwich毕业证书)格林威治大学毕业证PDF成绩单一模一样原版制作(Greenwich毕业证书)格林威治大学毕业证PDF成绩单一模一样
原版制作(Greenwich毕业证书)格林威治大学毕业证PDF成绩单一模一样
a7xjm8n4
 
BEST FARMLAND FOR SALE | FARM PLOTS NEAR BANGALORE | KANAKAPURA | CHICKKABALP...
BEST FARMLAND FOR SALE | FARM PLOTS NEAR BANGALORE | KANAKAPURA | CHICKKABALP...BEST FARMLAND FOR SALE | FARM PLOTS NEAR BANGALORE | KANAKAPURA | CHICKKABALP...
BEST FARMLAND FOR SALE | FARM PLOTS NEAR BANGALORE | KANAKAPURA | CHICKKABALP...
knox groups real estate
 
Dholera Smart City Latest Development Status 2024.pdf
Dholera Smart City Latest Development Status 2024.pdfDholera Smart City Latest Development Status 2024.pdf
Dholera Smart City Latest Development Status 2024.pdf
Shivgan Infratech
 
Stark Builders: Where Quality Meets Craftsmanship!
Stark Builders: Where Quality Meets Craftsmanship!Stark Builders: Where Quality Meets Craftsmanship!
Stark Builders: Where Quality Meets Craftsmanship!
shuilykhatunnil
 
SVN Live 6.17.24 Weekly Property Broadcast
SVN Live 6.17.24 Weekly Property BroadcastSVN Live 6.17.24 Weekly Property Broadcast
SVN Live 6.17.24 Weekly Property Broadcast
SVN International Corp.
 
SVN Live 6.10.24 Weekly Property Broadcast
SVN Live 6.10.24 Weekly Property BroadcastSVN Live 6.10.24 Weekly Property Broadcast
SVN Live 6.10.24 Weekly Property Broadcast
SVN International Corp.
 
AVRUPA KONUTLARI ESENTEPE - ENGLISH - Listing Turkey
AVRUPA KONUTLARI ESENTEPE - ENGLISH - Listing TurkeyAVRUPA KONUTLARI ESENTEPE - ENGLISH - Listing Turkey
AVRUPA KONUTLARI ESENTEPE - ENGLISH - Listing Turkey
Listing Turkey
 
Living in an UBER World - June '24 Sales Meeting
Living in an UBER World - June '24 Sales MeetingLiving in an UBER World - June '24 Sales Meeting
Living in an UBER World - June '24 Sales Meeting
Tom Blefko
 
Deed 3754 S Honeysuckle Mesa AZ 85212 owner Shawn Freeman - Pamela Brown Nota...
Deed 3754 S Honeysuckle Mesa AZ 85212 owner Shawn Freeman - Pamela Brown Nota...Deed 3754 S Honeysuckle Mesa AZ 85212 owner Shawn Freeman - Pamela Brown Nota...
Deed 3754 S Honeysuckle Mesa AZ 85212 owner Shawn Freeman - Pamela Brown Nota...
olgashriki
 

Recently uploaded (9)

原版制作(Greenwich毕业证书)格林威治大学毕业证PDF成绩单一模一样
原版制作(Greenwich毕业证书)格林威治大学毕业证PDF成绩单一模一样原版制作(Greenwich毕业证书)格林威治大学毕业证PDF成绩单一模一样
原版制作(Greenwich毕业证书)格林威治大学毕业证PDF成绩单一模一样
 
BEST FARMLAND FOR SALE | FARM PLOTS NEAR BANGALORE | KANAKAPURA | CHICKKABALP...
BEST FARMLAND FOR SALE | FARM PLOTS NEAR BANGALORE | KANAKAPURA | CHICKKABALP...BEST FARMLAND FOR SALE | FARM PLOTS NEAR BANGALORE | KANAKAPURA | CHICKKABALP...
BEST FARMLAND FOR SALE | FARM PLOTS NEAR BANGALORE | KANAKAPURA | CHICKKABALP...
 
Dholera Smart City Latest Development Status 2024.pdf
Dholera Smart City Latest Development Status 2024.pdfDholera Smart City Latest Development Status 2024.pdf
Dholera Smart City Latest Development Status 2024.pdf
 
Stark Builders: Where Quality Meets Craftsmanship!
Stark Builders: Where Quality Meets Craftsmanship!Stark Builders: Where Quality Meets Craftsmanship!
Stark Builders: Where Quality Meets Craftsmanship!
 
SVN Live 6.17.24 Weekly Property Broadcast
SVN Live 6.17.24 Weekly Property BroadcastSVN Live 6.17.24 Weekly Property Broadcast
SVN Live 6.17.24 Weekly Property Broadcast
 
SVN Live 6.10.24 Weekly Property Broadcast
SVN Live 6.10.24 Weekly Property BroadcastSVN Live 6.10.24 Weekly Property Broadcast
SVN Live 6.10.24 Weekly Property Broadcast
 
AVRUPA KONUTLARI ESENTEPE - ENGLISH - Listing Turkey
AVRUPA KONUTLARI ESENTEPE - ENGLISH - Listing TurkeyAVRUPA KONUTLARI ESENTEPE - ENGLISH - Listing Turkey
AVRUPA KONUTLARI ESENTEPE - ENGLISH - Listing Turkey
 
Living in an UBER World - June '24 Sales Meeting
Living in an UBER World - June '24 Sales MeetingLiving in an UBER World - June '24 Sales Meeting
Living in an UBER World - June '24 Sales Meeting
 
Deed 3754 S Honeysuckle Mesa AZ 85212 owner Shawn Freeman - Pamela Brown Nota...
Deed 3754 S Honeysuckle Mesa AZ 85212 owner Shawn Freeman - Pamela Brown Nota...Deed 3754 S Honeysuckle Mesa AZ 85212 owner Shawn Freeman - Pamela Brown Nota...
Deed 3754 S Honeysuckle Mesa AZ 85212 owner Shawn Freeman - Pamela Brown Nota...
 

Annie Williams Real Estate Report-July 2023

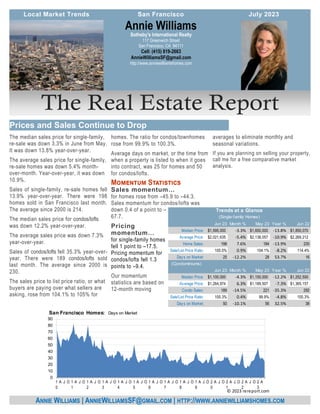
  • 1. averages to eliminate monthly and seasonal variations. If you are planning on selling your property, call me for a free comparative market analysis. The median sales price for single-family, re-sale was down 3.3% in June from May. It was down 13.8% year-over-year. The average sales price for single-family, re-sale homes was down 5.4% month- over-month. Year-over-year, it was down 10.9%. Sales of single-family, re-sale homes fell 13.9% year-over-year. There were 198 homes sold in San Francisco last month. The average since 2000 is 214. The median sales price for condos/lofts was down 12.2% year-over-year. The average sales price was down 7.3% year-over-year. Sales of condos/lofts fell 35.3% year-over- year. There were 189 condos/lofts sold last month. The average since 2000 is 230. The sales price to list price ratio, or what buyers are paying over what sellers are asking, rose from 104.1% to 105% for homes. The ratio for condos/townhomes rose from 99.9% to 100.3%. Average days on market, or the time from when a property is listed to when it goes into contract, was 25 for homes and 50 for condos/lofts. Sales momentum… for homes rose from –45.9 to –44.3. Sales momentum for condos/lofts was down 0.4 of a point to – 67.7. Pricing momentum… for single-family homes fell 1 point to –17.5. Pricing momentum for condos/lofts fell 1.3 points to –9.4. Our momentum statistics are based on 12-month moving Sotheby's International Realty 117 Greenwich Street San Francisco, CA 94111 Cell: (415) 819-2663 AnnieWilliamsSF@gmail.com http://www.anniewilliamshomes.com Annie Williams ANNIE WILLIAMS | ANNIEWILLIAMSSF@GMAIL.COM | HTTP://WWW.ANNIEWILLIAMSHOMES.COM Prices and Sales Continue to Drop Local Market Trends July 2023 San Francisco Jun 23 Month % May 23 Year % Jun 22 Median Price: 1,595,000 $ -3.3% 1,650,000 $ -13.8% 1,850,070 $ Average Price: 2,021,635 $ -5.4% 2,138,057 $ -10.9% 2,269,212 $ Home Sales: 198 7.6% 184 -13.9% 230 Sale/List Price Ratio: 105.0% 0.9% 104.1% -8.2% 114.4% Days on Market: 25 -12.2% 28 53.7% 16 (Condominiums) Jun 23 Month % May 23 Year % Jun 22 Median Price: 1,100,000 $ -4.3% 1,150,000 $ -12.2% 1,252,500 $ Average Price: 1,264,974 $ 6.3% 1,189,507 $ -7.3% 1,365,157 $ Condo Sales: 189 -14.5% 221 -35.3% 292 Sale/List Price Ratio: 100.3% 0.4% 99.9% -4.8% 105.3% Days on Market: 50 -10.1% 56 32.5% 38 Trends at a Glance (Single-family Homes) 0 10 20 30 40 50 60 70 80 90 1 0 A J O 1 1 A J O 1 2 A J O 1 3 A J O 1 4 A J O 1 5 A J O 1 6 A J O 1 7 A J O 1 8 A J O 1 9 A J O 2 0 A J O 2 1 A J O 2 2 A J O 2 3 A San Francisco Homes: Days on Market © 2023 rereport.com
  • 2. Jun 30, 2023 -- It's becoming both clearer and more likely that the Fed will lift rates at its next meet- ing in July, and based on comments this week from Fed Chair Jay Powell, the potential also exists that back-to-back increases could come over the next two meetings, as a pair of moves is "not off the table", per Mr. Powell. He also noted that "If you look at the data over the last quarter, what you see is stronger than expected growth, a tighter than expected labor mar- ket, and higher than expected inflation." That trio of factors gives the Fed plenty of reason to resume its rate hiking campaign. Perhaps the only items that might see the Fed extend their so-far one- meeting "pause" are the unclear effects of this spring's banking troubles and that there's little history on how the economy and inflation will fully react to a 500 basis point increase in short-term rates over just a year's time. Could the central bank "skip" July, too? It's certainly possible, as another six weeks of holding off would likely do little damage in the inflation fight. However, with few signs that the economy is rapidly slowing, the labor market loosening measurably or inflation cooling at a faster rate, there's not a lot of reason to expect the Fed to hold their fire. That said, there is still a month's worth of data due out before the next Fed meeting, and a stronger nudge in the right direc- tion on one or more of these fronts might be enough proof that policy already in place is sufficient to reach the Fed's goals, but probably not. Economic growth is also getting a bit of support from home building and sales, and thin inventories of homes for sale in the existing housing market are pushing at least some buyers over to the new con- struction market. Sales of newly-constructed home rose by a stout 12.2% in May, climbing to a 763,000 annual rate of sale, the fastest pace since February 2022. The surge in sales pulled the supply of new homes down to 6.7 months at the current rate of sale, with the 428,000 units available the fewest number in more than a year. This should provide builders with incentive to keep construction humming over at least the next few months. To help move stock, builders have been using incentives that include price conces- sions and subsidizing financing, but those discounts and offers are being used somewhat less often of late, at least according to the National Association of (Continued on page 4) ANNIE WILLIAMS SOTHEBY'S INTERNATIONAL REALTY ANNIEWILLIAMSSF@GMAIL.COM 2 Local Market Trends | San Francisco | Stronger Data, Firmer Rates The chart above shows the National monthly average for 30-year fixed rate mortgages as compiled by http://www.freddiemac.com/. July 2023 1.0% 3.0% 5.0% 7.0% 9.0% 01-10 07-10 01-11 07-11 01-12 07-12 01-13 07-13 01-14 07-14 01-15 07-15 01-16 07-16 01-17 07-17 01-18 07-18 01-19 07-19 01-20 07-20 01-21 07-21 01-22 07-22 01-23 30-Year Fixed Mortgage Rates 0 50 100 150 200 250 300 350 $300 $800 $1,300 $1,800 $2,300 $2,800 1 0 A J O 1 1 A J O 1 2 A J O 1 3 A J O 1 4 A J O 1 5 A J O 1 6 A J O 1 7 A J O 1 8 A J O 1 9 A J O 2 0 A J O 2 1 A J O 2 2 A J O 2 3 A San Francisco Homes: Sold Prices & Unit Sales (3-month moving average — $000's) Ave Med Units © 2023 rereport.com Unit Median Average Sales DOM SP/LP Median Average Sales Median Average Sales San Francisco $1,595,000 $2,021,635 198 25 105.0% -13.8% -10.9% -13.9% -3.3% -5.4% 7.6% D1: Northwest $2,330,000 $2,520,952 21 24 103.8% -6.8% 5.9% 31.3% 24.1% 6.3% 162.5% D2: Central West $1,525,000 $1,520,286 32 22 115.2% -16.1% -20.0% -37.3% -4.7% -12.7% -13.5% D3: Southwest $1,288,000 $1,468,182 11 18 115.8% -15.9% -9.3% 10.0% -4.6% 8.4% -26.7% D4: Twin Peaks $1,700,000 $1,804,380 25 20 110.2% -20.6% -24.1% -26.5% -6.8% -7.9% 8.7% D5: Central $1,803,000 $2,196,410 21 29 101.1% -35.7% -24.3% -44.7% -23.9% -20.6% -32.3% D6: Central North $1,837,500 $1,815,850 6 32 121.3% -43.2% -40.4% 50.0% -33.8% -34.6% 200.0% D7: North $4,797,500 $5,524,714 14 40 95.2% -24.7% 1.1% 75.0% -24.2% -18.0% 16.7% D8: Northeast $3,700,000 $3,700,000 1 35 97.7% -26.0% -37.8% -75.0% n/a n/a n/a D9: Central East $1,817,500 $2,018,500 26 25 104.5% -4.3% 3.6% 23.8% 23.6% 26.2% 85.7% D10: Southeast $1,125,000 $1,128,805 39 25 108.3% -11.8% -14.4% -11.4% -5.1% -2.9% -9.3% June Sales Statistics (Single-family Homes) Prices Yearly Change Monthly Change
  • 3. Table Definitions _______________ Median Price The price at which 50% of prices were higher and 50% were lower. Average Price Add all prices and divide by the number of sales. SP/LP Sales price to list price ratio or the price paid for the property divided by the asking price. DOI Days of Inventory, or how many days it would take to sell all the property for sale at the current rate of sales. Pend Property under contract to sell that hasn’t closed escrow. Inven Number pf properties actively for sale as of the last day of the month. Local Market Trends | San Francisco | 3 July 2023 ANNIE WILLIAMS SOTHEBY'S INTERNATIONAL REALTY ANNIEWILLIAMSSF@GMAIL.COM 80.0% 85.0% 90.0% 95.0% 100.0% 105.0% 110.0% 115.0% 120.0% 125.0% 1 0 A J O 1 1 A J O 1 2 A J O 1 3 A J O 1 4 A J O 1 5 A J O 1 6 A J O 1 7 A J O 1 8 A J O 1 9 A J O 2 0 A J O 2 1 A J O 2 2 A J O 2 3 A San Francisco Homes: Sales Price to List Price Ratio © 2023 rereport.com -50.0 -40.0 -30.0 -20.0 -10.0 0.0 10.0 20.0 30.0 40.0 0 6 A J O 0 7 A J O 0 8 A J O 0 9 A J O 1 0 A J O 1 1 A J O 1 2 A J O 1 3 A J O 1 4 A J O 1 5 A J O 1 6 A J O 1 7 A J O 1 8 A J O 1 9 A J O 2 0 A J O 2 1 A J O 2 2 A J O 2 3 A San Francisco Homes: Sales Momentum Sales Pricing © 2023 rereport.com 0 100 200 300 400 500 $300 $500 $700 $900 $1,100 $1,300 $1,500 $1,700 1 0 A J O 1 1 A J O 1 2 A J O 1 3 A J O 1 4 A J O 1 5 A J O 1 6 A J O 1 7 A J O 1 8 A J O 1 9 A J O 2 0 A J O 2 1 A J O 2 2 A J O 2 3 A San Francisco Condos: Sold Prices & Unit Sales (3-month moving average — $000's) Ave Med Units © 2023 rereport.com Unit Median Average Sales DOM SP/LP Median Average Sales Median Average Sales San Francisco $1,100,000 $1,264,974 189 50 100.3% -12.2% -7.3% -35.3% -4.3% 6.3% -14.5% D1: Northwest $1,150,000 $1,435,636 11 25 103.6% -20.4% 9.8% -15.4% -14.2% 4.8% -26.7% D2: Central West $952,500 $1,040,750 4 25 100.8% -38.5% -40.9% 33.3% -32.7% -26.4% 100.0% D3: Southwest $1,475,000 $1,475,000 1 42 105.4% 25.0% 46.0% -80.0% 38.4% 38.3% -75.0% D4: Twin Peaks $980,000 $839,939 3 67 93.2% 9.0% -20.2% 0.0% 17.4% -11.8% -66.7% D5: Central $1,227,500 $1,343,328 32 36 103.9% -18.2% -12.1% -54.3% -12.3% -7.7% -25.6% D6: Central North $1,010,000 $1,108,597 24 42 102.9% -19.2% -14.1% -25.0% -15.5% -12.2% 9.1% D7: North $1,601,500 $1,865,857 14 45 102.5% -5.8% 6.0% -48.1% 8.6% 20.1% -46.2% D8: Northeast $922,000 $1,156,306 36 45 99.6% -12.2% -10.3% -12.2% 15.4% 20.8% 2.9% D9: Central East $1,117,500 $1,256,170 56 56 96.7% -2.0% -0.5% -37.8% 33.0% 26.6% -5.1% D10: Southeast $898,500 $892,167 6 218 98.1% 30.7% 24.7% -25.0% 6.4% 21.7% 50.0% June Sales Statistics (Condos/TICs/Co-ops/Lofts) Prices Yearly Change Monthly Change
  • 4. San Francisco This Real Estate Report is published and copyrighted by http://rereport.com. Information contained herein is deemed accurate and correct, but no warranty is implied or given. Annie Williams Sotheby's International Realty 117 Greenwich Street San Francisco, CA 94111 Go online to see the full report with the district by district breakdown: https://rereport.com/sf/aw/ Home Builders. The median price of a new home sold in May was $416,300, turning higher again after a meaningful decline from last October's $496,800 peak, probably reflect the lessened use of price cuts by builders last month. Price discounts and financing help are far less com- mon in the existing home market, but may become more of a part of the marketing arsenal if mortgage rates don't show a meaningful decline soon. Sales of existing homes are only perking along at a modest level, one that is likely to become even more modest in the coming month or two. The National Association of Realtors Pending Home Sales Index for May posted a 2.7% de- cline; this measure of purchase contracts signed suggests that existing home sales for June and July will struggle to hold present levels of about 4.3 million (annualized). The PHSI has now posted declines in each of the last three months, usually the busiest time of year for hous- ing. Despite mortgage rates closer to recent highs than not, applications for mortgages managed a small increase last week. In (Continued from page 2) the week ending June 25, the Mortgage Bankers Association reported a 3% increase in requests for mortgage credit, a third consecutive gain. Applica- tions for purchase-money mortgages rose by 2.8%; those to refinance existing loans managed a 3.3% bump. A holiday is on tap again for next week and mortgage rates seem poised to rise a bit more in the coming days, and this will probably break the unexpected streak of small increases in applica- tions seen over the last few weeks. 2009 2010 2011 2012 2013 2014 2015 2016 2017 2018 2019 2020 2021 2022 2023 Condos 730 1,218 1,311 1,542 1,581 1,575 1,447 1,315 1,420 1,545 1,460 959 2,234 1,775 1,096 Homes 835 1,167 1,184 1,258 1,367 1,095 1,265 1,228 1,039 1,071 1,038 748 1,386 1,256 881 0 500 1,000 1,500 2,000 2,500 3,000 3,500 4,000 Property Sales (Year-to-Date) © 2023 rereport.com