Download to read offline
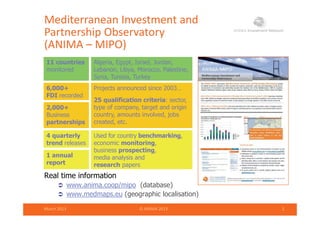
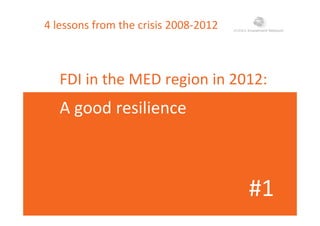
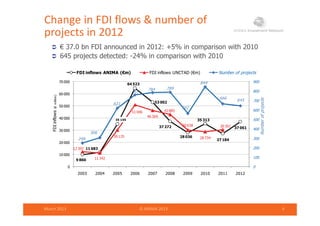
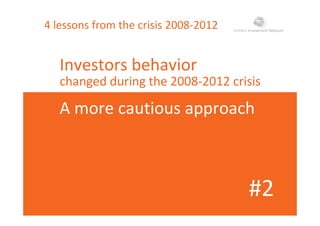
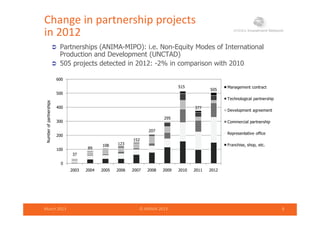
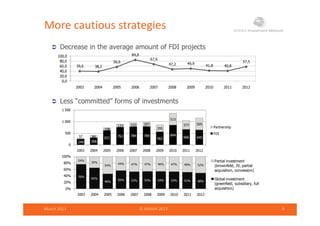
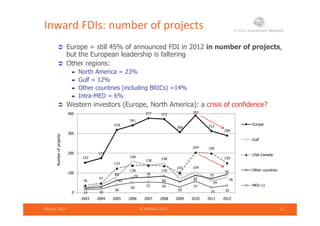
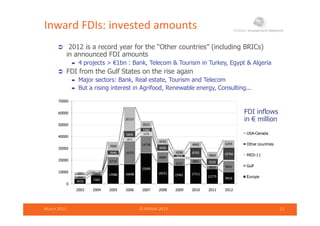
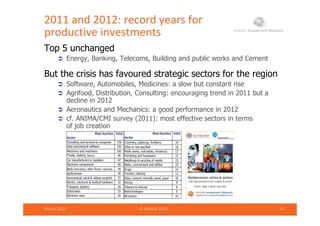
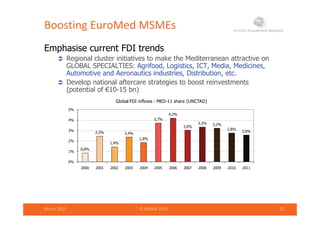

The document presents findings from the ANIMA-MIPO investment observatory regarding foreign direct investment (FDI) trends in the Mediterranean region from 2008 to 2012. It highlights a resilient FDI flow despite a decrease in project numbers, with notable changes in investor behavior toward more cautious strategies. The analysis emphasizes the need for inclusive investments and better governance to enhance local participation and project effectiveness.


![Atlas & ica fdi webinar7sept11 [alleen lezen]](https://cdn.slidesharecdn.com/ss_thumbnails/atlasicafdiwebinar7sept11alleen-lezen-110908100610-phpapp01-thumbnail.jpg?width=640&height=640&fit=bounds)


