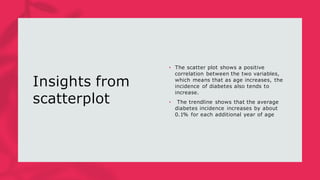
Analyzing the diabetes datasheet
using python
What is
diabetes?
Diabetes is a chronic, metabolic disease characterized by
elevated levels of blood glucose (or blood sugar), which
leads over time to serious damage to the heart, blood
vessels, eyes, kidneys and nerves.
• Type 1 diabetes (genetics & virus, where our immune
system destroy the pancreas i.e.. Beta cell )
• Type 2 diabetes ( pancreas produce less insulin)
• Gestational diabetes (due to pregnancy)
• Maturity onset diabetes of the young (MODY) (non-
obese children, adolescents, and young adults)
Average blood glucose level
is between 80Mg/dl to 12o
Mg/dl
The average blood pressure
for a healthy adult is less
than 120/80 millimeters of
mercury (mmHg)
Average BMI is 13 to 23
To import the csv file
Insights from
barplot
• The plot also shows a trendline,
which is a line that best fits the data.
The trendline shows that the average
risk of diabetes increases by about
0.5% for each additional year of
age.
Using histplot
Insights from
scatterplot
• The scatter plot shows a positive
correlation between the two variables,
which means that as age increases, the
incidence of diabetes also tends to
increase.
• The trendline shows that the average
diabetes incidence increases by about
0.1% for each additional year of age
Insights from scatterplot
• The scatter plot also shows a trendline, which is a line that best fits the
data. The trendline shows that the average glucose level increases by about
10 mg/dL for each additional pregnancy.
• The trendline shows that the average glucose level increases by about 10
mg/dL for each additional pregnancy.
Insights from
histplot
• There are more people with a BMI in the
normal range (18.5 to 24.9) than there are
people with a BMI in the overweight (25 to
29.9) or obese (30 or higher) ranges.
Insights
from
regression
and catplot
plot
insulin levels increase, skin thickness also increases. The
correlation coefficient (R-squared) is 0.75, which means that this
trendline explains 75% of the variation in the data.
positive correlation between insulin and skin thickness
The violin plot shows that people with diabetes tend to have higher
skin thickness than people without diabetes. The median skin
thickness for people with diabetes is 3.1 mm, while the median
skin thickness for people without diabetes is 2.5 mm.
Thank you

Analyzing the diabettes datasheet using python

  • 1.
    Analyzing the diabetesdatasheet using python
  • 2.
    What is diabetes? Diabetes isa chronic, metabolic disease characterized by elevated levels of blood glucose (or blood sugar), which leads over time to serious damage to the heart, blood vessels, eyes, kidneys and nerves. • Type 1 diabetes (genetics & virus, where our immune system destroy the pancreas i.e.. Beta cell ) • Type 2 diabetes ( pancreas produce less insulin) • Gestational diabetes (due to pregnancy) • Maturity onset diabetes of the young (MODY) (non- obese children, adolescents, and young adults)
  • 3.
    Average blood glucoselevel is between 80Mg/dl to 12o Mg/dl The average blood pressure for a healthy adult is less than 120/80 millimeters of mercury (mmHg) Average BMI is 13 to 23
  • 4.
    To import thecsv file
  • 6.
    Insights from barplot • Theplot also shows a trendline, which is a line that best fits the data. The trendline shows that the average risk of diabetes increases by about 0.5% for each additional year of age.
  • 7.
  • 10.
    Insights from scatterplot • Thescatter plot shows a positive correlation between the two variables, which means that as age increases, the incidence of diabetes also tends to increase. • The trendline shows that the average diabetes incidence increases by about 0.1% for each additional year of age
  • 13.
    Insights from scatterplot •The scatter plot also shows a trendline, which is a line that best fits the data. The trendline shows that the average glucose level increases by about 10 mg/dL for each additional pregnancy. • The trendline shows that the average glucose level increases by about 10 mg/dL for each additional pregnancy.
  • 15.
    Insights from histplot • Thereare more people with a BMI in the normal range (18.5 to 24.9) than there are people with a BMI in the overweight (25 to 29.9) or obese (30 or higher) ranges.
  • 18.
    Insights from regression and catplot plot insulin levelsincrease, skin thickness also increases. The correlation coefficient (R-squared) is 0.75, which means that this trendline explains 75% of the variation in the data. positive correlation between insulin and skin thickness The violin plot shows that people with diabetes tend to have higher skin thickness than people without diabetes. The median skin thickness for people with diabetes is 3.1 mm, while the median skin thickness for people without diabetes is 2.5 mm.
  • 19.