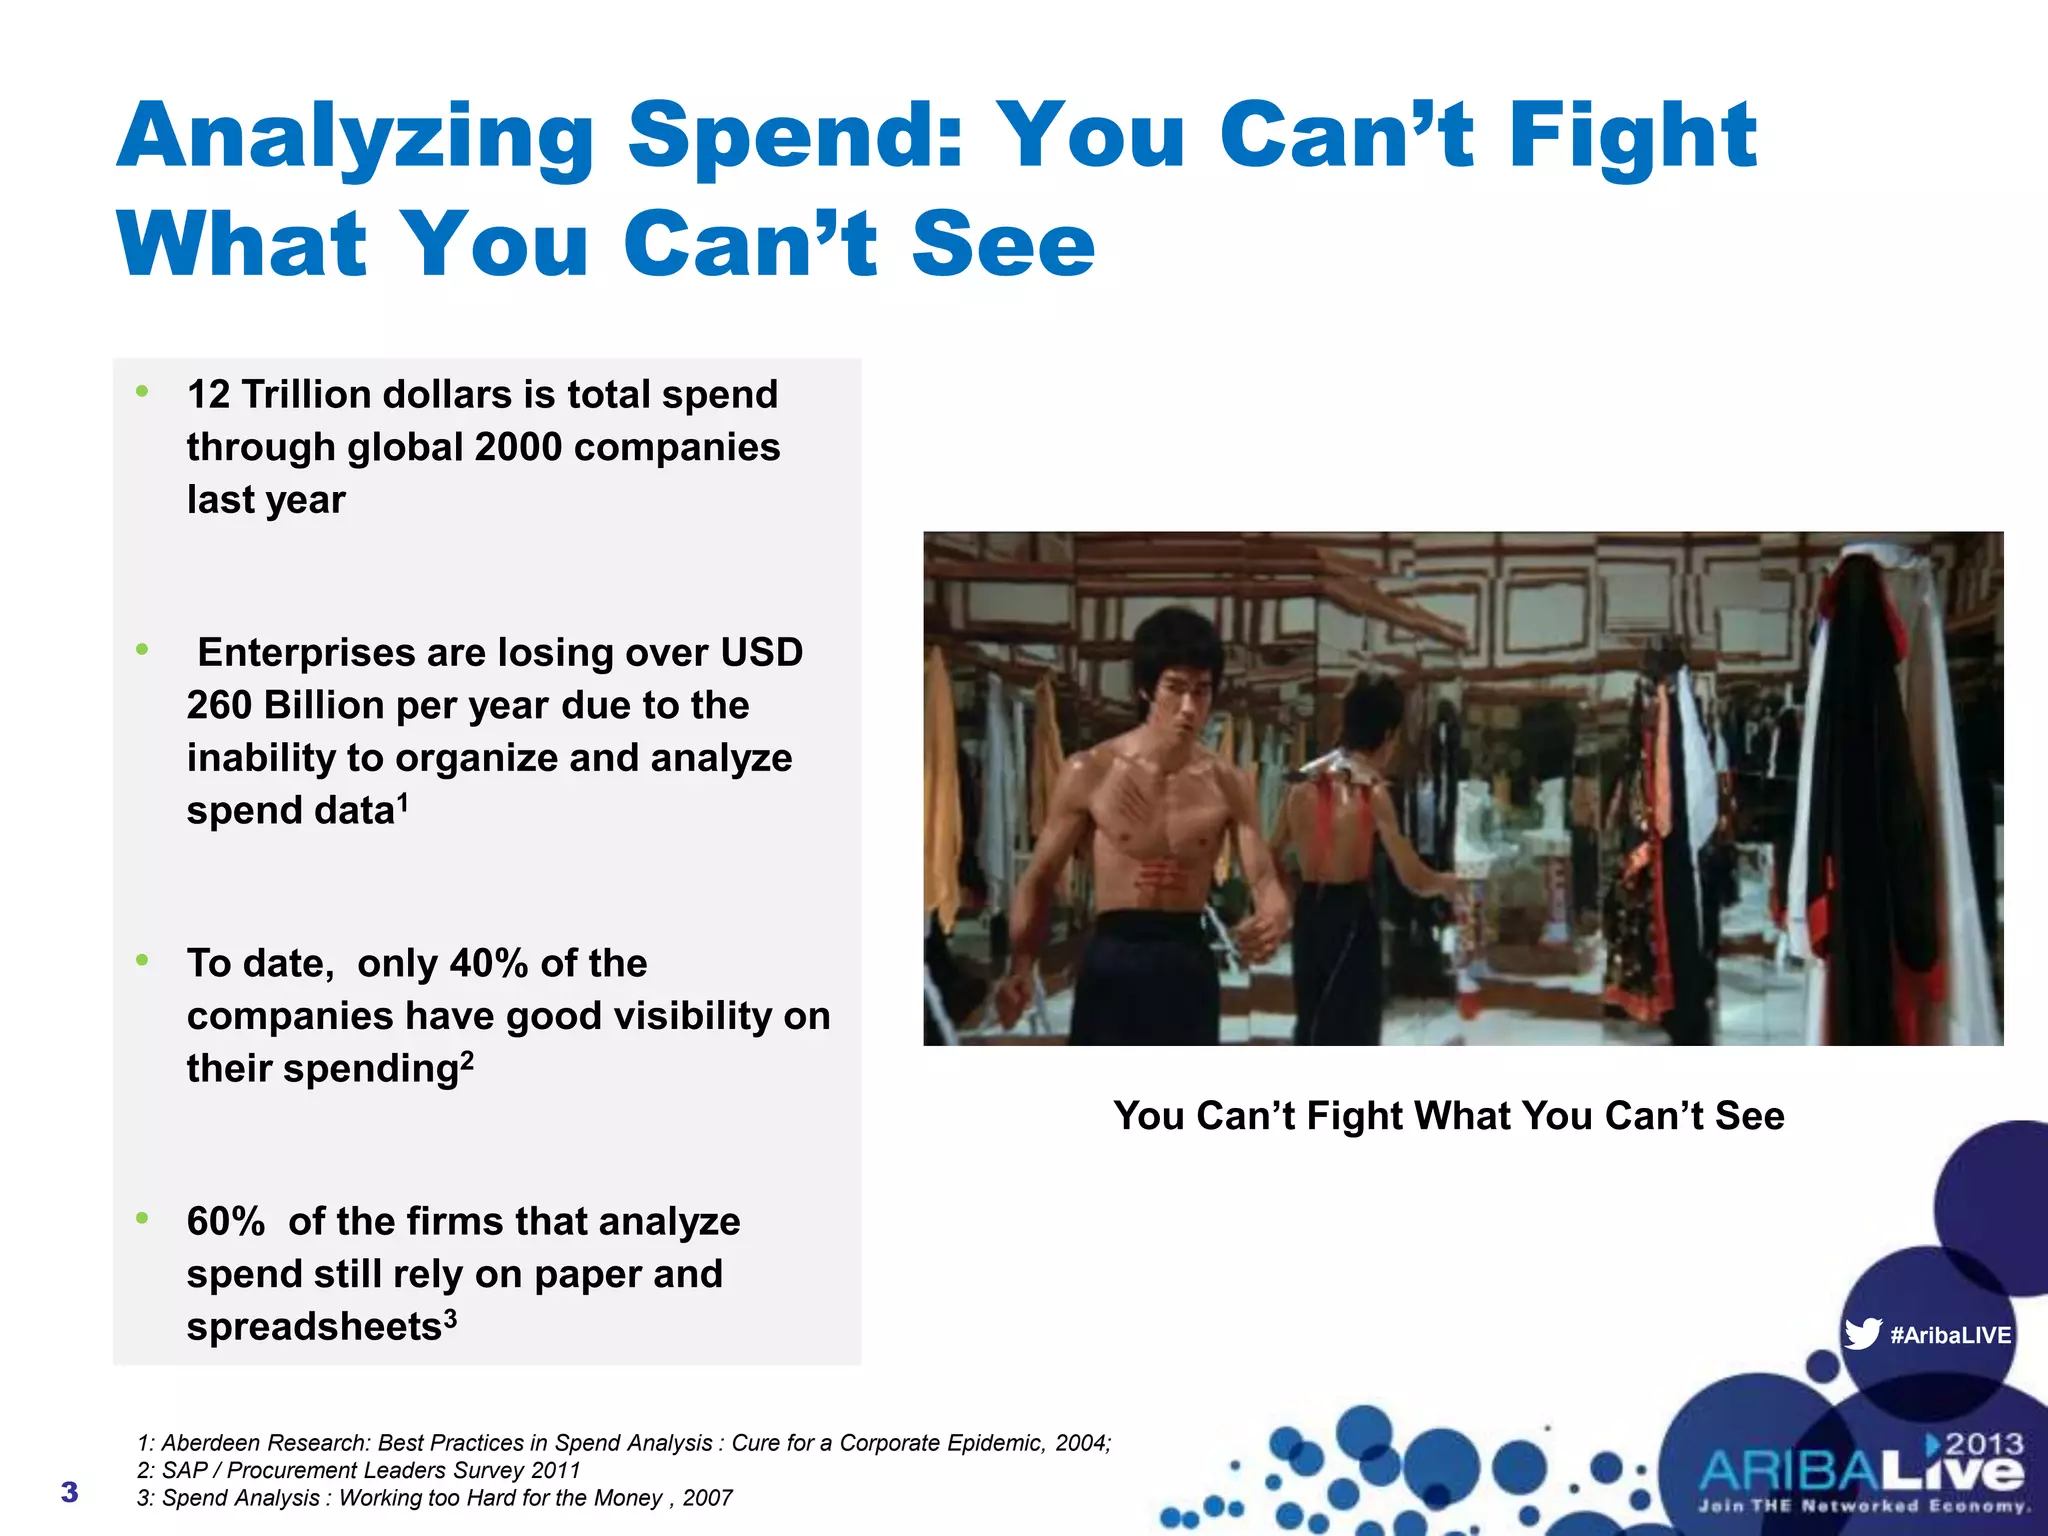
Analyzing Spend: You Can’t Fight What
You Can’t See
Speakers:
Phil Fisher – Dun & Bradstreet
Brian Delaney – MetLife
Craig Fischer – Las Vegas Sands Corp.
Moderator:
Keertan Rai – Ariba, an SAP Company
© 2013 Ariba, Inc. All rights reserved.
#AribaLIVE
Agenda
• Overview and Introductions
• Panel Presentations
Phil Fisher - VP, Strategic Alliance Partner Solutions - D&B
Brian Delaney - Director, Technology Liaison - MetLife
Craig Fischer - Director, Business Strategy & Process - Las
Vegas Sands Corp.
• Q&A
© 2013 Ariba, Inc. All rights reserved.2
#AribaLIVE
Analyzing Spend: You Can’t Fight
What You Can’t See
3
• 12 Trillion dollars is total spend
through global 2000 companies
last year
• Enterprises are losing over USD
260 Billion per year due to the
inability to organize and analyze
spend data1
• To date, only 40% of the
companies have good visibility on
their spending2
• 60% of the firms that analyze
spend still rely on paper and
spreadsheets3
You Can’t Fight What You Can’t See
1: Aberdeen Research: Best Practices in Spend Analysis : Cure for a Corporate Epidemic, 2004;
2: SAP / Procurement Leaders Survey 2011
3: Spend Analysis : Working too Hard for the Money , 2007
#AribaLIVE
© 2013 Ariba, Inc. All rights reserved.8
Panelists
Craig Fischer
Director - Business Strategy &
Process
Las Vegas Sands Corp.
Phil Fisher
Vice President, Strategic Alliance
Partner Solutions
Dun & Bradstreet, Inc
Brian Delaney
Director – Technology Liaison
MetLife
#AribaLIVE
Agenda
• Overview and Introductions
• Panel Presentations
Phil Fisher - VP, Strategic Alliance Partner
Solutions - D&B
Brian Delaney - Director, Technology Liaison - MetLife
Craig Fischer - Director, Business Strategy & Process -
Las Vegas Sands Corp.
• Q&A
© 2013 Ariba, Inc. All rights reserved.9
#AribaLIVE
Supplier and Spend Management –
Moving Beyond the Numbers
• D&B (NYSE:DNB) is the world's leading source of
commercial information on businesses, enabling
companies to Decide with Confidence® for over 170
years
• The D&B database has information on 225+ million
businesses in over 190 countries
• More than 100,000 companies rely on D&B to help build
strong business relationships with their
customers, suppliers and partners
• Supply management-specific data expertise gives the
insights companies need for supply chain optimization
© 2013 Ariba, Inc. All rights reserved.10
About D&B
#AribaLIVE
Spending Clarity Starts with Asking
the Right Questions
• How can I get more detailed
information on suppliers?
• How much am I spending with
suppliers at a corporate family level?
• How diverse is my supply base? And
how can I locate more diverse
suppliers?
• Where are the greatest risks in my
supply chain?
© 2013 Ariba, Inc. All rights reserved.11
#AribaLIVE
Stay Ahead of the Curve
Know How Your Suppliers May Behave Tomorrow
© 2013 Ariba, Inc. All rights reserved.12
The Advantage
• Get a sense of potential supply
interruption before it can impact the:
• Bottom line: through stock outs
• Top line: through idling the
manufacturing line
• Brand: through damage to quality and
product availability
The Results
• Source from financially stable suppliers
• Get advance notice to reduce risk and
protect supply chain continuity
• Deliver consistent, objective treatment
of suppliers
#AribaLIVE
Sustain Your Success Down the
Road with These Tips
• Identify the categories your company
cares about
• Instill a cross-functional process
Procurement
Finance
Operations
• Establish processes for approving/managing
suppliers
© 2013 Ariba, Inc. All rights reserved.13
#AribaLIVE
Agenda
• Overview and Introductions
• Panel Presentations
Phil Fisher - VP, Strategic Alliance Partner Solutions - D&B
Brian Delaney - Director, Technology Liaison - MetLife
Craig Fischer - Director, Business Strategy & Process -
Las Vegas Sands Corp.
• Q&A
© 2013 Ariba, Inc. All rights reserved.14
#AribaLIVE
Challenges Ahead
© 2013 Ariba, Inc. All rights reserved.15
Drive Down
Expenses by 2016
Better leverage
vendor
agreements in a
more global
manner to drive
down cost
More efficient in
the technology we
use
Increased global
savings targets
over $200M
$600M
$200M
#AribaLIVE
MetLife’s Current State
© 2013 Ariba, Inc. All rights reserved.16
Manual Data
extracts
and Review
(Excel)
…
Control Tables
Business Rules
18 countries
Auto & Home
(CAF)
International
Financials
Treasury
Workstation
Computron
PeopleSoft
Ariba
MS Access
DB’s
Shared
Drive
#AribaLIVE
Why Spend Visibility
• MetLife’s recent acquisitions have given us presence in
over 60 countries globally
• Gain the same visibility into each of the key markets spend, so we could
apply the same principals to drive expense reduction
• Need to converge multi-currency, multi-language data into single
reporting environment
• Automate as much of this process as possible – need to get out of the
business of maintaining databases and into the business of providing the
analytics (Shift from transactional to strategic)
© 2013 Ariba, Inc. All rights reserved.17
#AribaLIVE
MetLife’s Future State
© 2013 Ariba, Inc. All rights reserved.18
22 Data
Sources
D&B
Parentage
Rationalization
Data Transformation & Enrichment
Ariba Spend Visibility
Auto & Home
(CAF)
International
Financials
Treasury
Workstation
Computron PeopleSoft
#AribaLIVE
Agenda
• Overview and Introductions
• Panel Presentations
Phil Fisher - VP, Strategic Alliance Partner Solutions - D&B
Brian Delaney - Director, Technology Liaison - MetLife
Craig Fischer - Director, Business Strategy & Process -
Las Vegas Sands Corp.
• Q&A
© 2013 Ariba, Inc. All rights reserved.19
#AribaLIVE
Las Vegas Sands Corporation
Las Vegas Sands Corporation (NYSE: LVS)
• Leading global developer and operator of destination integrated resorts (IRs)
• Properties include Las Vegas, Macao, Singapore and Bethlehem, Pennsylvania
Gross Floor Area of IRs is 60,000,000 sq. ft.
Total Hotel Rooms is 19,800 rooms
Total Retail Mall Space is 4,500,000 sq. ft.
Total MICE (Meeting, incentives, conferences and exhibitions) Space is 5,200,000
sq. ft.
Total Gaming Space is 1,660,000 sq. ft.
• Net Revenue for the past 5 years from LVSC’s 2012 10-K
© 2013 Ariba, Inc. All rights reserved.20
Who We Are
Year 2008 2009 2010 2011 2012
Net Revenue $4.38B $4.56B $6.85B $9.41B $11.13B
#AribaLIVE
Spend Strategy at LVSC
Three – step process to develop a sourcing strategy:
1. Identify Spends by Category / Sub – Categories
Determine which spends are Procurement Influenced vs.
Non- Procurement Influence
2. Align Sub – Categories into a Segmentation Quadrant
Important factors are the Y – Axis and X - Axis
3. Develop Sub – Categories Strategies to source
Key elements that must be understood and will drive a sourcing strategy
© 2013 Ariba, Inc. All rights reserved.21
#AribaLIVE
Identifying Spends by Categories
at LVSC
Procurement Influenced (2012- 40%) Non-Procurement Influenced
(2012-60%)
Food & Beverage
Operating Supplies
Marketing / Advertising / Print
Facilities & Services
Outside Services
Gaming
Surveillance
Technology & IT
Development & Construction
FF&E
Ferry
Utilities
Employee Benefits
Retail
Total
8.5%
5%
4.5%
4%
7.2%
6%
.5%
8%
33.5%
4%
4.8%
8.8%
4.7%
.5%
100%
Entertainment
Legal
Leases
Insurance
Financial Services
Aviation
Commissions
Taxes
Third-Party Charges
© 2013 Ariba, Inc. All rights reserved.22
* Areas in blue did not have Procurement & Supply Chain involvement prior to 2009
#AribaLIVE
2012 LVSC Procurement Influenced
Spend Analysis
Marketing, Advertising & Print
(MAP) 4.5% Beverage 4.5%
Facility & Facility Services
4%
FF&E 4%
Food 4%
Gaming 6%
Operating Supplies 5%
Outside Services 7.2%
Pre-Development & Design &
Construction 33.5%
Surveillance 0.5%
Employee Benefits 4.7%
Ferry 4.8%
Technology 8%
Utilities
8.8%
Marketing, Advertising & Print (MAP)
Beverage
Facility & Facility Services
FF&E
Food
Gaming
Operating Supplies
Outside Services
Retail
Pre-Development & Design &
Construction
Surveillance
Employee Benefits
Ferry
Technology
Retail 0.5%
© 2013 Ariba, Inc. All rights reserved.23
2012 Procurement Influenced Spend: 40% of total spend
#AribaLIVE
2012 LVSC Non-Procurement
Influenced Spend Analysis
Taxes 78%
Entertainment 2.5%
Legal 2.0%
Intercompany Charges
9.0% Other 3.0%
Insurance 1.0%
Financing 2.0%
Aviation 1.0%
Commissions 0.5%
Other 1.0%
Taxes
Entertainment
Legal
Intercompany
Charges
Third-Party
Charges
Insurance
Financing
Aviation
Commissions
Other
© 2013 Ariba, Inc. All rights reserved.24
2012 Non-Procurement Influenced Spend: 60% of total spend
#AribaLIVE
Aligning Sub – Categories into
a Segmentation Quadrant
© 2013 Ariba, Inc. All rights reserved.25
CustomerImpact
High
Low
Low High
Category Segmentation
Switching Costs
Strategic
Tactical Critical
Alliance
#AribaLIVE
Develop a Category Sourcing Strategy
LVSC Category Strategy Template
© 2013 Ariba, Inc. All rights reserved.26
Category: Duration:Scope:
Competitor Benchmarking
Who / What / Supplier
Annual Spend -
Currency
Annualized Savings -
Currency
2012 A 2013 F Total
US
Asia
Total
2012 A 2013 F Total
US
Asia
Total
Category
Pictures
Segmentation
Strategic Alliance
Tactical Critical
Category Analysis
Cost Structure, Benchmarking, Supplier
Comparison, Index Data, Etc
Global Specification
Value Chain Information
Technology and Market
Changes
Key Cost Drivers
Category Description /
Scope
Supplier Scoring
(5 Highest , 1 Lowest)
Cost (xx%) Quality (xx%) Total
Supplier A
Supplier B
Supplier C
Others
Category Strategy /
Sourcing Recommendation
Current Situation:
Strategy:
#AribaLIVE
LVSC Category Strategy Template
Excel based – 11” by 17”
© 2013 Ariba, Inc. All rights reserved.27
#AribaLIVE
The Exciting World of Slippers
Category sourcing strategy – Part 1
© 2013 Ariba, Inc. All rights reserved.28
#AribaLIVE
The Exciting World of Slippers
Category sourcing strategy – Part 2
© 2013 Ariba, Inc. All rights reserved.29
Category Analysis
#AribaLIVE
The Exciting World of Slippers
Category sourcing strategy – Part 3
© 2013 Ariba, Inc. All rights reserved.30
#AribaLIVE
Agenda
• Overview and Introductions
• Panel Presentations
Phil Fisher - VP, Strategic Alliance Partner Solutions - D&B
Brian Delaney - Director, Technology Liaison - MetLife
Craig Fischer - Director, Business Strategy & Process -
Las Vegas Sands Corp.
• Q&A
© 2013 Ariba, Inc. All rights reserved.31
Questions?
Contact info:
Keertan Rai : krai@ariba.com
© 2013 Ariba, Inc. All rights reserved.
32

Analyzing Spend – You Can’t Fight What You Can’t See

  • 1.
    Analyzing Spend: YouCan’t Fight What You Can’t See Speakers: Phil Fisher – Dun & Bradstreet Brian Delaney – MetLife Craig Fischer – Las Vegas Sands Corp. Moderator: Keertan Rai – Ariba, an SAP Company © 2013 Ariba, Inc. All rights reserved.
  • 2.
    #AribaLIVE Agenda • Overview andIntroductions • Panel Presentations Phil Fisher - VP, Strategic Alliance Partner Solutions - D&B Brian Delaney - Director, Technology Liaison - MetLife Craig Fischer - Director, Business Strategy & Process - Las Vegas Sands Corp. • Q&A © 2013 Ariba, Inc. All rights reserved.2
  • 3.
    #AribaLIVE Analyzing Spend: YouCan’t Fight What You Can’t See 3 • 12 Trillion dollars is total spend through global 2000 companies last year • Enterprises are losing over USD 260 Billion per year due to the inability to organize and analyze spend data1 • To date, only 40% of the companies have good visibility on their spending2 • 60% of the firms that analyze spend still rely on paper and spreadsheets3 You Can’t Fight What You Can’t See 1: Aberdeen Research: Best Practices in Spend Analysis : Cure for a Corporate Epidemic, 2004; 2: SAP / Procurement Leaders Survey 2011 3: Spend Analysis : Working too Hard for the Money , 2007
  • 4.
    #AribaLIVE © 2013 Ariba,Inc. All rights reserved.8 Panelists Craig Fischer Director - Business Strategy & Process Las Vegas Sands Corp. Phil Fisher Vice President, Strategic Alliance Partner Solutions Dun & Bradstreet, Inc Brian Delaney Director – Technology Liaison MetLife
  • 5.
    #AribaLIVE Agenda • Overview andIntroductions • Panel Presentations Phil Fisher - VP, Strategic Alliance Partner Solutions - D&B Brian Delaney - Director, Technology Liaison - MetLife Craig Fischer - Director, Business Strategy & Process - Las Vegas Sands Corp. • Q&A © 2013 Ariba, Inc. All rights reserved.9
  • 6.
    #AribaLIVE Supplier and SpendManagement – Moving Beyond the Numbers • D&B (NYSE:DNB) is the world's leading source of commercial information on businesses, enabling companies to Decide with Confidence® for over 170 years • The D&B database has information on 225+ million businesses in over 190 countries • More than 100,000 companies rely on D&B to help build strong business relationships with their customers, suppliers and partners • Supply management-specific data expertise gives the insights companies need for supply chain optimization © 2013 Ariba, Inc. All rights reserved.10 About D&B
  • 7.
    #AribaLIVE Spending Clarity Startswith Asking the Right Questions • How can I get more detailed information on suppliers? • How much am I spending with suppliers at a corporate family level? • How diverse is my supply base? And how can I locate more diverse suppliers? • Where are the greatest risks in my supply chain? © 2013 Ariba, Inc. All rights reserved.11
  • 8.
    #AribaLIVE Stay Ahead ofthe Curve Know How Your Suppliers May Behave Tomorrow © 2013 Ariba, Inc. All rights reserved.12 The Advantage • Get a sense of potential supply interruption before it can impact the: • Bottom line: through stock outs • Top line: through idling the manufacturing line • Brand: through damage to quality and product availability The Results • Source from financially stable suppliers • Get advance notice to reduce risk and protect supply chain continuity • Deliver consistent, objective treatment of suppliers
  • 9.
    #AribaLIVE Sustain Your SuccessDown the Road with These Tips • Identify the categories your company cares about • Instill a cross-functional process Procurement Finance Operations • Establish processes for approving/managing suppliers © 2013 Ariba, Inc. All rights reserved.13
  • 10.
    #AribaLIVE Agenda • Overview andIntroductions • Panel Presentations Phil Fisher - VP, Strategic Alliance Partner Solutions - D&B Brian Delaney - Director, Technology Liaison - MetLife Craig Fischer - Director, Business Strategy & Process - Las Vegas Sands Corp. • Q&A © 2013 Ariba, Inc. All rights reserved.14
  • 11.
    #AribaLIVE Challenges Ahead © 2013Ariba, Inc. All rights reserved.15 Drive Down Expenses by 2016 Better leverage vendor agreements in a more global manner to drive down cost More efficient in the technology we use Increased global savings targets over $200M $600M $200M
  • 12.
    #AribaLIVE MetLife’s Current State ©2013 Ariba, Inc. All rights reserved.16 Manual Data extracts and Review (Excel) … Control Tables Business Rules 18 countries Auto & Home (CAF) International Financials Treasury Workstation Computron PeopleSoft Ariba MS Access DB’s Shared Drive
  • 13.
    #AribaLIVE Why Spend Visibility •MetLife’s recent acquisitions have given us presence in over 60 countries globally • Gain the same visibility into each of the key markets spend, so we could apply the same principals to drive expense reduction • Need to converge multi-currency, multi-language data into single reporting environment • Automate as much of this process as possible – need to get out of the business of maintaining databases and into the business of providing the analytics (Shift from transactional to strategic) © 2013 Ariba, Inc. All rights reserved.17
  • 14.
    #AribaLIVE MetLife’s Future State ©2013 Ariba, Inc. All rights reserved.18 22 Data Sources D&B Parentage Rationalization Data Transformation & Enrichment Ariba Spend Visibility Auto & Home (CAF) International Financials Treasury Workstation Computron PeopleSoft
  • 15.
    #AribaLIVE Agenda • Overview andIntroductions • Panel Presentations Phil Fisher - VP, Strategic Alliance Partner Solutions - D&B Brian Delaney - Director, Technology Liaison - MetLife Craig Fischer - Director, Business Strategy & Process - Las Vegas Sands Corp. • Q&A © 2013 Ariba, Inc. All rights reserved.19
  • 16.
    #AribaLIVE Las Vegas SandsCorporation Las Vegas Sands Corporation (NYSE: LVS) • Leading global developer and operator of destination integrated resorts (IRs) • Properties include Las Vegas, Macao, Singapore and Bethlehem, Pennsylvania Gross Floor Area of IRs is 60,000,000 sq. ft. Total Hotel Rooms is 19,800 rooms Total Retail Mall Space is 4,500,000 sq. ft. Total MICE (Meeting, incentives, conferences and exhibitions) Space is 5,200,000 sq. ft. Total Gaming Space is 1,660,000 sq. ft. • Net Revenue for the past 5 years from LVSC’s 2012 10-K © 2013 Ariba, Inc. All rights reserved.20 Who We Are Year 2008 2009 2010 2011 2012 Net Revenue $4.38B $4.56B $6.85B $9.41B $11.13B
  • 17.
    #AribaLIVE Spend Strategy atLVSC Three – step process to develop a sourcing strategy: 1. Identify Spends by Category / Sub – Categories Determine which spends are Procurement Influenced vs. Non- Procurement Influence 2. Align Sub – Categories into a Segmentation Quadrant Important factors are the Y – Axis and X - Axis 3. Develop Sub – Categories Strategies to source Key elements that must be understood and will drive a sourcing strategy © 2013 Ariba, Inc. All rights reserved.21
  • 18.
    #AribaLIVE Identifying Spends byCategories at LVSC Procurement Influenced (2012- 40%) Non-Procurement Influenced (2012-60%) Food & Beverage Operating Supplies Marketing / Advertising / Print Facilities & Services Outside Services Gaming Surveillance Technology & IT Development & Construction FF&E Ferry Utilities Employee Benefits Retail Total 8.5% 5% 4.5% 4% 7.2% 6% .5% 8% 33.5% 4% 4.8% 8.8% 4.7% .5% 100% Entertainment Legal Leases Insurance Financial Services Aviation Commissions Taxes Third-Party Charges © 2013 Ariba, Inc. All rights reserved.22 * Areas in blue did not have Procurement & Supply Chain involvement prior to 2009
  • 19.
    #AribaLIVE 2012 LVSC ProcurementInfluenced Spend Analysis Marketing, Advertising & Print (MAP) 4.5% Beverage 4.5% Facility & Facility Services 4% FF&E 4% Food 4% Gaming 6% Operating Supplies 5% Outside Services 7.2% Pre-Development & Design & Construction 33.5% Surveillance 0.5% Employee Benefits 4.7% Ferry 4.8% Technology 8% Utilities 8.8% Marketing, Advertising & Print (MAP) Beverage Facility & Facility Services FF&E Food Gaming Operating Supplies Outside Services Retail Pre-Development & Design & Construction Surveillance Employee Benefits Ferry Technology Retail 0.5% © 2013 Ariba, Inc. All rights reserved.23 2012 Procurement Influenced Spend: 40% of total spend
  • 20.
    #AribaLIVE 2012 LVSC Non-Procurement InfluencedSpend Analysis Taxes 78% Entertainment 2.5% Legal 2.0% Intercompany Charges 9.0% Other 3.0% Insurance 1.0% Financing 2.0% Aviation 1.0% Commissions 0.5% Other 1.0% Taxes Entertainment Legal Intercompany Charges Third-Party Charges Insurance Financing Aviation Commissions Other © 2013 Ariba, Inc. All rights reserved.24 2012 Non-Procurement Influenced Spend: 60% of total spend
  • 21.
    #AribaLIVE Aligning Sub –Categories into a Segmentation Quadrant © 2013 Ariba, Inc. All rights reserved.25 CustomerImpact High Low Low High Category Segmentation Switching Costs Strategic Tactical Critical Alliance
  • 22.
    #AribaLIVE Develop a CategorySourcing Strategy LVSC Category Strategy Template © 2013 Ariba, Inc. All rights reserved.26 Category: Duration:Scope: Competitor Benchmarking Who / What / Supplier Annual Spend - Currency Annualized Savings - Currency 2012 A 2013 F Total US Asia Total 2012 A 2013 F Total US Asia Total Category Pictures Segmentation Strategic Alliance Tactical Critical Category Analysis Cost Structure, Benchmarking, Supplier Comparison, Index Data, Etc Global Specification Value Chain Information Technology and Market Changes Key Cost Drivers Category Description / Scope Supplier Scoring (5 Highest , 1 Lowest) Cost (xx%) Quality (xx%) Total Supplier A Supplier B Supplier C Others Category Strategy / Sourcing Recommendation Current Situation: Strategy:
  • 23.
    #AribaLIVE LVSC Category StrategyTemplate Excel based – 11” by 17” © 2013 Ariba, Inc. All rights reserved.27
  • 24.
    #AribaLIVE The Exciting Worldof Slippers Category sourcing strategy – Part 1 © 2013 Ariba, Inc. All rights reserved.28
  • 25.
    #AribaLIVE The Exciting Worldof Slippers Category sourcing strategy – Part 2 © 2013 Ariba, Inc. All rights reserved.29 Category Analysis
  • 26.
    #AribaLIVE The Exciting Worldof Slippers Category sourcing strategy – Part 3 © 2013 Ariba, Inc. All rights reserved.30
  • 27.
    #AribaLIVE Agenda • Overview andIntroductions • Panel Presentations Phil Fisher - VP, Strategic Alliance Partner Solutions - D&B Brian Delaney - Director, Technology Liaison - MetLife Craig Fischer - Director, Business Strategy & Process - Las Vegas Sands Corp. • Q&A © 2013 Ariba, Inc. All rights reserved.31
  • 28.
    Questions? Contact info: Keertan Rai: krai@ariba.com © 2013 Ariba, Inc. All rights reserved. 32

Editor's Notes

  • #4 Overview slide by Keertan
  • #5 This slide is hidden. To be used as a back-up
  • #6 This slide is hidden. To be used as a back-up
  • #7 This slide is hidden. To be used as a back-up
  • #8 This slide is hidden. To be used as a back-up
  • #12 Eric and Greg both spoke to the importance of identifying corporate linkage, diversity status and total spend when working with their suppliers. These are just some of the categories that we’d recommend companies explore to get a clear, overall snapshot of supplier health. Companies must also take into consideration overall financial health, socio-political stability of the supplier’s location, and the health of tier-2 suppliers. Establishing a central repository of all supplier data gives companies the ability to see the entire supply chain at a glance. From my days managing supply chains for HP, I know that compiling all that information can be challenging – and worse, can lead to incorrect information being used to make decisions. As a best practice, it is always beneficial to employ some sort of third-party review of the data – that not only validates the quality of the data, but can uncover opportunities as well. At D&B we use the DUNS-Right system – every supplier/organization has a unique identifying number which allows us to identify parent and children companies, branches, violations, etc.
  • #13 Fourth: “How can I get advance warning of a supplier disruption or change in the status quo?”Advance warning of supplier trouble can mean the difference between avoiding a disruption and coming out on top or scrambling to pick up the pieces. Your options for resolution are so much broader when you have the luxury of time.
  • #14 And most importantly: “What can your company do to stay out ahead of the competition?” Having the right information, in the right place is the first step in staying ahead of the competition. It gives you the tools you need to do the proper analysis to make informed business decisions.
  • #17 2001 – MetLife managed $400M worth of spend in the US with 70 buyers. Very little strategic activity, highly transactionalToday – MetLife manages over $2.5B in the US handled by 15 buyers, much more focus on the strategic activity. With recent acquisitions, looking to expand our Spend Management Program globally.How did we get here, and how do we get where we want to be…Reporting and Metrics team pulls in data from our domestic systems into a homegrown (Access) database. Reporting and Metrics team performs all the normalization of data, apply taxonomies, D&B searches on our critical suppliers. Current State Challenges Manually Maintained Access DatabaseHours spent updating and validating data, then producing reports on a monthly basisMinimal bandwidth to expand the reporting program (International)
  • #19 2001 – MetLife managed $400M worth of spend in the US with 70 buyers. Very little strategic activity, highly transactionalToday – MetLife manages over $2.5B in the US handled by 15 buyers, much more focus on the strategic activity. With recent acquisitions, looking to expand our Spend Management Program globally.How did we get here, and how do we get where we want to be…Reporting and Metrics team pulls in data from our domestic systems into a homegrown (Access) database. Reporting and Metrics team performs all the normalization of data, apply taxonomies, D&B searches on our critical suppliers. Current State Challenges Manually Maintained Access DatabaseHours spent updating and validating data, then producing reports on a monthly basisMinimal bandwidth to expand the reporting program (International)
  • #22 Notes: Other examples of quadrants are Strategic Importance & Supply Risk/Complexity, Profit Impact & Supply Risk/Criticality, Impact & Spend, Complexity of adding capacity & Supplier willingness to add capacity
  • #26 Notes: Other examples of quadrants are Strategic Importance & Supply Risk/Complexity, Profit Impact & Supply Risk/Criticality, Impact & Spend, Complexity of adding capacity & Supplier willingness to add capacity