SlideShare a Scribd company logo
ANALYTICAL PARAGRAPH
An analytical paragraph is a form descriptive
writing which is written on the basis of a given
chart, graph, data, outline, clues, table etc. When
writing an analytical paragraph, one should
remember to describe the facts in the best
possible manner and to cover the information
provided.
In short it is the art of interpreting , analysing and
writing the given data in a comparative and
reporting manner.
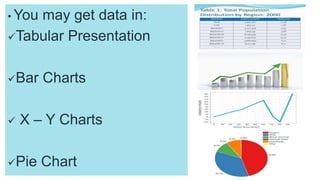
• You may get data in:
Tabular Presentation
Bar Charts
 X – Y Charts
Pie Chart
DIFFERENCE BETWEEN PARAGRAPH WRITING
& ANALYTICAL PARAGRAPH WRITING
Paragraph writing
• It can be written on
any topic.
• It has several sentences that deals
with a single subject.
Analytical Paragraph
• It studies and compiles a given set of
data and visual stimulus and frames
into a paragraph.
• Whereas it gives details of the
specified data in a precise, simple and
crisp manner.
FEATURES OF AN ANALYTICAL PARAGRAPH
1. It describes the given chart, table, data, graph, cues etc.
2. It should be brief and comprehensive (include complete information) at the same
time.
3. It should state facts that are provided by the chart.
4. It is necessary to make use of simple , comparative and accurate language.
5. It should mention figures and quantities appropriately.
6. It is appropriate to use the same tense throughout the analytical paragraph.
7. No personal observation or response should be provided.
8. It would be preferable to use the passive form of the verb.
FORMAT OF AN ANALYTICAL PARAGRAPH
• An analytical paragraph shall be divided into three parts -
1. Introduction
2. Body of the paragraph and;
3. Conclusion
INTRODUCTION
• The introduction is the first paragraph that should describe in brief what the graph
is about.
• need not go into the details.
• It is best to write the introduction in one or two lines.
• Suggestive opening lines:
 The chart given above describes
 The table suggests
 The line graph shows
 The data given provides information about
 The pie chart illustrates, etc.
THE BODY OF THE PARAGRAPH
This part of the analytical paragraph should contain details of the graph/chart given
in the question. It should contain all the important information. It is extremely
important to choose the significant details that should be included in the paragraph.
The body can be broken into two or three sub-paragraphs depending on the
information extracted from the graph.
i. Organising information
ii. Comparing information
iii. Connecting sentences
to do so:
WORDS AND PHRASES THAT HELP US
For describing trends, use phrases and words like- pattern of growth, rapidly
doubled, skyrocketed, striking increase, peaked, soaring rates, declined, plummeted,
levelled off, stagnated, fluctuate, starting to rise, starting to fall, drop down, slightly,
etc.
For describing quantities, use various styles like- 48% of, one-third of, nearly one-
fourth of, almost 80%, majority, on average, twice as much, almost equal, the
highest, the lowest, very close to 2%, roughly, approximately 5% of, just under three
per cent, etc.
For establishing relationship or contrast, use phrases and words like- relationship
between, similarly, in contrast with, in comparison to, but in the opposite case,
however, whereas, when it comes to, as opposed to, while, striking difference,
noticeable difference, etc.
For conclusion and other connecting phrases use- overall, subsequently, in all, in
a nutshell, for the chart given, in short, striking changes, including, therefore, etc.
CONCLUSION
The last paragraph should summaries the idea mentioned and the information in
general. It should be concluding in nature and act as the closing statement. One
should keep in the mind that one must not include any personal opinions,
conclusions or observations. You should simply stick to the facts.
The key is to choose wisely the important information,
organise it well, state correct facts and summaries it
properly.
SAMPLE
QUESTION

 The pie chart shows the
proportion of people from different
households living in poverty in the
UK in 2002. Write an analytical
paragraph to describe the
information in 100-120 words.
ANSWER
The given pie chart illustrates seven different categories of households living in
poverty in the UK in 2002.
It is clearly evident from the pie chart that 26% of the total poverty-stricken households
are those of sole parents. Single people without children account for the second
highest proportion with 24%. In contrast to couples without children that accounts for
just 9%, couples with children account for 15% of the poor households. Single aged
persons and aged couples proportion for 12% together for poor households.
Overall, 14% of all households in the UK were living under poverty. The younger
generation had a greater poor percentage than their aged counterparts. Couples
without children had better economic conditions than those with children.
ANALYTICAL PARAGRAPH-1.pptx

More Related Content

What's hot

7_The Squirrel
7_The Squirrel7_The Squirrel
7_The Squirrel
NVSBPL
 

What's hot (20)

"Wind" Poem
"Wind" Poem"Wind" Poem
"Wind" Poem
 
Report writing for class XI & XII
Report writing for class XI & XIIReport writing for class XI & XII
Report writing for class XI & XII
 
A long walk to freedom
A long walk to freedomA long walk to freedom
A long walk to freedom
 
the fun they had ppt
 the fun they had ppt the fun they had ppt
the fun they had ppt
 
Adventures of toto
Adventures of totoAdventures of toto
Adventures of toto
 
Direct indirect Speech
Direct indirect Speech  Direct indirect Speech
Direct indirect Speech
 
the lost child ppt
 the lost child ppt  the lost child ppt
the lost child ppt
 
A truly Beautiful Mind
A truly Beautiful MindA truly Beautiful Mind
A truly Beautiful Mind
 
The Snake and the Mirror
The Snake and the Mirror The Snake and the Mirror
The Snake and the Mirror
 
duck and kangaroo
duck and kangarooduck and kangaroo
duck and kangaroo
 
Letter writing ppt CBSE
Letter writing ppt CBSE Letter writing ppt CBSE
Letter writing ppt CBSE
 
Childhood
ChildhoodChildhood
Childhood
 
T6 Writing Articles Powerpoint
T6 Writing Articles PowerpointT6 Writing Articles Powerpoint
T6 Writing Articles Powerpoint
 
7_The Squirrel
7_The Squirrel7_The Squirrel
7_The Squirrel
 
The fun they had
The fun they hadThe fun they had
The fun they had
 
The Road Not Taken By Robert Frost PowerPoint Presentation with interactive q...
The Road Not Taken By Robert Frost PowerPoint Presentation with interactive q...The Road Not Taken By Robert Frost PowerPoint Presentation with interactive q...
The Road Not Taken By Robert Frost PowerPoint Presentation with interactive q...
 
A letter to god
A letter to god A letter to god
A letter to god
 
A tiger in the Zoo
A tiger in the ZooA tiger in the Zoo
A tiger in the Zoo
 
THE TREES (POEM BY ADRIENNA RICH)
 THE TREES (POEM BY ADRIENNA RICH) THE TREES (POEM BY ADRIENNA RICH)
THE TREES (POEM BY ADRIENNA RICH)
 
Determiners - Types of Determiners
Determiners - Types of DeterminersDeterminers - Types of Determiners
Determiners - Types of Determiners
 

Similar to ANALYTICAL PARAGRAPH-1.pptx

Data-Presentation-and-Interpretation-in-Tabular-Graphical.pptx
Data-Presentation-and-Interpretation-in-Tabular-Graphical.pptxData-Presentation-and-Interpretation-in-Tabular-Graphical.pptx
Data-Presentation-and-Interpretation-in-Tabular-Graphical.pptx
shyrahipolitoe
 
Report preparation
Report preparationReport preparation
Report preparation
Ratna Singh
 
Presentation_Analysis_and_Interpretation.ppt
Presentation_Analysis_and_Interpretation.pptPresentation_Analysis_and_Interpretation.ppt
Presentation_Analysis_and_Interpretation.ppt
MichaelCion1
 

Similar to ANALYTICAL PARAGRAPH-1.pptx (20)

Results section my presentation
Results section my presentationResults section my presentation
Results section my presentation
 
Chapter 4-Data Analysis in Practical Research 2
Chapter 4-Data Analysis in Practical Research 2Chapter 4-Data Analysis in Practical Research 2
Chapter 4-Data Analysis in Practical Research 2
 
Chapter 4 - Research Parts Guide.pptx
Chapter 4 - Research Parts Guide.pptxChapter 4 - Research Parts Guide.pptx
Chapter 4 - Research Parts Guide.pptx
 
Chapter 4
Chapter 4Chapter 4
Chapter 4
 
practical research 1 chapter 4 qualitative research
practical research 1 chapter 4 qualitative researchpractical research 1 chapter 4 qualitative research
practical research 1 chapter 4 qualitative research
 
writing the results section.pptx
writing the results section.pptxwriting the results section.pptx
writing the results section.pptx
 
Business Research Methods: Written report guidelines
Business Research Methods: Written report guidelinesBusiness Research Methods: Written report guidelines
Business Research Methods: Written report guidelines
 
Numerical & graphical presentation of data
Numerical & graphical presentation of dataNumerical & graphical presentation of data
Numerical & graphical presentation of data
 
Data-Presentation-and-Interpretation-in-Tabular-Graphical.pptx
Data-Presentation-and-Interpretation-in-Tabular-Graphical.pptxData-Presentation-and-Interpretation-in-Tabular-Graphical.pptx
Data-Presentation-and-Interpretation-in-Tabular-Graphical.pptx
 
Report preparation
Report preparationReport preparation
Report preparation
 
Tabulation of data
Tabulation of dataTabulation of data
Tabulation of data
 
Data presentation and interpretation I Quantitative Research
Data presentation and interpretation I Quantitative ResearchData presentation and interpretation I Quantitative Research
Data presentation and interpretation I Quantitative Research
 
A seminar on quantitave data analysis
A seminar on quantitave data analysisA seminar on quantitave data analysis
A seminar on quantitave data analysis
 
Analytical Writing - Bar graph
Analytical Writing - Bar graphAnalytical Writing - Bar graph
Analytical Writing - Bar graph
 
Task_1_IELTS_Writing journals.pdf
Task_1_IELTS_Writing journals.pdfTask_1_IELTS_Writing journals.pdf
Task_1_IELTS_Writing journals.pdf
 
Report Writing by Prof.Pravin Mulay
Report Writing by Prof.Pravin MulayReport Writing by Prof.Pravin Mulay
Report Writing by Prof.Pravin Mulay
 
Task 1 ielts_writing_academic_training_m
Task 1 ielts_writing_academic_training_mTask 1 ielts_writing_academic_training_m
Task 1 ielts_writing_academic_training_m
 
Ielts journal
Ielts journal   Ielts journal
Ielts journal
 
The use of data visualization to tell effective
The use of data visualization to tell effectiveThe use of data visualization to tell effective
The use of data visualization to tell effective
 
Presentation_Analysis_and_Interpretation.ppt
Presentation_Analysis_and_Interpretation.pptPresentation_Analysis_and_Interpretation.ppt
Presentation_Analysis_and_Interpretation.ppt
 

More from Judesharp1

More from Judesharp1 (6)

powerpoint-160209205440 (1).pdf
powerpoint-160209205440 (1).pdfpowerpoint-160209205440 (1).pdf
powerpoint-160209205440 (1).pdf
 
transgenicplantsandanimals-140518135541-phpapp01.pdf
transgenicplantsandanimals-140518135541-phpapp01.pdftransgenicplantsandanimals-140518135541-phpapp01.pdf
transgenicplantsandanimals-140518135541-phpapp01.pdf
 
Delhi-NTSE-Sample-Paper-SAT.pdf
Delhi-NTSE-Sample-Paper-SAT.pdfDelhi-NTSE-Sample-Paper-SAT.pdf
Delhi-NTSE-Sample-Paper-SAT.pdf
 
AGRICULTURE MAJOR CROPS.pdf
AGRICULTURE MAJOR CROPS.pdfAGRICULTURE MAJOR CROPS.pdf
AGRICULTURE MAJOR CROPS.pdf
 
Concepts of NLP.pptx
Concepts of NLP.pptxConcepts of NLP.pptx
Concepts of NLP.pptx
 
X-8-How do organisms reproduce.ppt
X-8-How do organisms reproduce.pptX-8-How do organisms reproduce.ppt
X-8-How do organisms reproduce.ppt
 

Recently uploaded

一比一原版(DU毕业证)迪肯大学毕业证成绩单
一比一原版(DU毕业证)迪肯大学毕业证成绩单一比一原版(DU毕业证)迪肯大学毕业证成绩单
一比一原版(DU毕业证)迪肯大学毕业证成绩单
zvaywau
 
一比一原版UPenn毕业证宾夕法尼亚大学毕业证成绩单如何办理
一比一原版UPenn毕业证宾夕法尼亚大学毕业证成绩单如何办理一比一原版UPenn毕业证宾夕法尼亚大学毕业证成绩单如何办理
一比一原版UPenn毕业证宾夕法尼亚大学毕业证成绩单如何办理
beduwt
 
一比一原版IIT毕业证伊利诺伊理工大学毕业证成绩单如何办理
一比一原版IIT毕业证伊利诺伊理工大学毕业证成绩单如何办理一比一原版IIT毕业证伊利诺伊理工大学毕业证成绩单如何办理
一比一原版IIT毕业证伊利诺伊理工大学毕业证成绩单如何办理
dsenv
 
一比一原版UC Berkeley毕业证加利福尼亚大学|伯克利分校毕业证成绩单如何办理
一比一原版UC Berkeley毕业证加利福尼亚大学|伯克利分校毕业证成绩单如何办理一比一原版UC Berkeley毕业证加利福尼亚大学|伯克利分校毕业证成绩单如何办理
一比一原版UC Berkeley毕业证加利福尼亚大学|伯克利分校毕业证成绩单如何办理
beduwt
 
THE SYNERGY BETWEEN TRADITIONAL “ULI” BODY PAINTING SYMBOLS AND DIGITAL ART.
THE SYNERGY BETWEEN TRADITIONAL “ULI” BODY PAINTING SYMBOLS AND DIGITAL ART.THE SYNERGY BETWEEN TRADITIONAL “ULI” BODY PAINTING SYMBOLS AND DIGITAL ART.
THE SYNERGY BETWEEN TRADITIONAL “ULI” BODY PAINTING SYMBOLS AND DIGITAL ART.
ikennaaghanya
 

Recently uploaded (20)

acting board rough title here lolaaaaaaa
acting board rough title here lolaaaaaaaacting board rough title here lolaaaaaaa
acting board rough title here lolaaaaaaa
 
CLASS XII- HISTORY-THEME 4-Thinkers, Bes
CLASS XII- HISTORY-THEME 4-Thinkers, BesCLASS XII- HISTORY-THEME 4-Thinkers, Bes
CLASS XII- HISTORY-THEME 4-Thinkers, Bes
 
Inter-Dimensional Girl Boards Segment (Act 3)
Inter-Dimensional Girl Boards Segment (Act 3)Inter-Dimensional Girl Boards Segment (Act 3)
Inter-Dimensional Girl Boards Segment (Act 3)
 
Portfolio slide deck example number one.pdf
Portfolio slide deck example number one.pdfPortfolio slide deck example number one.pdf
Portfolio slide deck example number one.pdf
 
2137ad - Characters that live in Merindol and are at the center of main stories
2137ad - Characters that live in Merindol and are at the center of main stories2137ad - Characters that live in Merindol and are at the center of main stories
2137ad - Characters that live in Merindol and are at the center of main stories
 
一比一原版(DU毕业证)迪肯大学毕业证成绩单
一比一原版(DU毕业证)迪肯大学毕业证成绩单一比一原版(DU毕业证)迪肯大学毕业证成绩单
一比一原版(DU毕业证)迪肯大学毕业证成绩单
 
一比一原版UPenn毕业证宾夕法尼亚大学毕业证成绩单如何办理
一比一原版UPenn毕业证宾夕法尼亚大学毕业证成绩单如何办理一比一原版UPenn毕业证宾夕法尼亚大学毕业证成绩单如何办理
一比一原版UPenn毕业证宾夕法尼亚大学毕业证成绩单如何办理
 
一比一原版IIT毕业证伊利诺伊理工大学毕业证成绩单如何办理
一比一原版IIT毕业证伊利诺伊理工大学毕业证成绩单如何办理一比一原版IIT毕业证伊利诺伊理工大学毕业证成绩单如何办理
一比一原版IIT毕业证伊利诺伊理工大学毕业证成绩单如何办理
 
Tackling Poverty in Nigeria, by growing Art-based SMEs
Tackling Poverty in Nigeria, by growing Art-based SMEsTackling Poverty in Nigeria, by growing Art-based SMEs
Tackling Poverty in Nigeria, by growing Art-based SMEs
 
Presentation slide deck example for portfolio
Presentation slide deck example for portfolioPresentation slide deck example for portfolio
Presentation slide deck example for portfolio
 
Sisters_Bond_storyboard.pdf_____________
Sisters_Bond_storyboard.pdf_____________Sisters_Bond_storyboard.pdf_____________
Sisters_Bond_storyboard.pdf_____________
 
Winning Shots from Siena International Photography Awards 2015
Winning Shots from Siena International Photography Awards 2015Winning Shots from Siena International Photography Awards 2015
Winning Shots from Siena International Photography Awards 2015
 
一比一原版UC Berkeley毕业证加利福尼亚大学|伯克利分校毕业证成绩单如何办理
一比一原版UC Berkeley毕业证加利福尼亚大学|伯克利分校毕业证成绩单如何办理一比一原版UC Berkeley毕业证加利福尼亚大学|伯克利分校毕业证成绩单如何办理
一比一原版UC Berkeley毕业证加利福尼亚大学|伯克利分校毕业证成绩单如何办理
 
LPU infrastructure.pdf uniinfrastructure
LPU infrastructure.pdf uniinfrastructureLPU infrastructure.pdf uniinfrastructure
LPU infrastructure.pdf uniinfrastructure
 
Copy of Final Presentation example for portfolio .pdf
Copy of Final Presentation example for portfolio .pdfCopy of Final Presentation example for portfolio .pdf
Copy of Final Presentation example for portfolio .pdf
 
thGAP - BAbyss in Moderno!! Transgenic Human Germline Alternatives Project
thGAP - BAbyss in Moderno!!  Transgenic Human Germline Alternatives ProjectthGAP - BAbyss in Moderno!!  Transgenic Human Germline Alternatives Project
thGAP - BAbyss in Moderno!! Transgenic Human Germline Alternatives Project
 
The Legacy of Breton In A New Age by Master Terrance Lindall
The Legacy of Breton In A New Age by Master Terrance LindallThe Legacy of Breton In A New Age by Master Terrance Lindall
The Legacy of Breton In A New Age by Master Terrance Lindall
 
THE SYNERGY BETWEEN TRADITIONAL “ULI” BODY PAINTING SYMBOLS AND DIGITAL ART.
THE SYNERGY BETWEEN TRADITIONAL “ULI” BODY PAINTING SYMBOLS AND DIGITAL ART.THE SYNERGY BETWEEN TRADITIONAL “ULI” BODY PAINTING SYMBOLS AND DIGITAL ART.
THE SYNERGY BETWEEN TRADITIONAL “ULI” BODY PAINTING SYMBOLS AND DIGITAL ART.
 
17ink_beatboard_single-panel-COMPLETE_001
17ink_beatboard_single-panel-COMPLETE_00117ink_beatboard_single-panel-COMPLETE_001
17ink_beatboard_single-panel-COMPLETE_001
 
Nagpur_❤️Call Girl Starting Price Rs 12K ( 7737669865 ) Free Home and Hotel D...
Nagpur_❤️Call Girl Starting Price Rs 12K ( 7737669865 ) Free Home and Hotel D...Nagpur_❤️Call Girl Starting Price Rs 12K ( 7737669865 ) Free Home and Hotel D...
Nagpur_❤️Call Girl Starting Price Rs 12K ( 7737669865 ) Free Home and Hotel D...
 

ANALYTICAL PARAGRAPH-1.pptx

  • 2. An analytical paragraph is a form descriptive writing which is written on the basis of a given chart, graph, data, outline, clues, table etc. When writing an analytical paragraph, one should remember to describe the facts in the best possible manner and to cover the information provided. In short it is the art of interpreting , analysing and writing the given data in a comparative and reporting manner.
  • 3. • You may get data in: Tabular Presentation Bar Charts  X – Y Charts Pie Chart
  • 4. DIFFERENCE BETWEEN PARAGRAPH WRITING & ANALYTICAL PARAGRAPH WRITING Paragraph writing • It can be written on any topic. • It has several sentences that deals with a single subject. Analytical Paragraph • It studies and compiles a given set of data and visual stimulus and frames into a paragraph. • Whereas it gives details of the specified data in a precise, simple and crisp manner.
  • 5. FEATURES OF AN ANALYTICAL PARAGRAPH 1. It describes the given chart, table, data, graph, cues etc. 2. It should be brief and comprehensive (include complete information) at the same time. 3. It should state facts that are provided by the chart. 4. It is necessary to make use of simple , comparative and accurate language. 5. It should mention figures and quantities appropriately. 6. It is appropriate to use the same tense throughout the analytical paragraph. 7. No personal observation or response should be provided. 8. It would be preferable to use the passive form of the verb.
  • 6. FORMAT OF AN ANALYTICAL PARAGRAPH • An analytical paragraph shall be divided into three parts - 1. Introduction 2. Body of the paragraph and; 3. Conclusion
  • 7. INTRODUCTION • The introduction is the first paragraph that should describe in brief what the graph is about. • need not go into the details. • It is best to write the introduction in one or two lines. • Suggestive opening lines:  The chart given above describes  The table suggests  The line graph shows  The data given provides information about  The pie chart illustrates, etc.
  • 8. THE BODY OF THE PARAGRAPH This part of the analytical paragraph should contain details of the graph/chart given in the question. It should contain all the important information. It is extremely important to choose the significant details that should be included in the paragraph. The body can be broken into two or three sub-paragraphs depending on the information extracted from the graph. i. Organising information ii. Comparing information iii. Connecting sentences to do so:
  • 9. WORDS AND PHRASES THAT HELP US For describing trends, use phrases and words like- pattern of growth, rapidly doubled, skyrocketed, striking increase, peaked, soaring rates, declined, plummeted, levelled off, stagnated, fluctuate, starting to rise, starting to fall, drop down, slightly, etc. For describing quantities, use various styles like- 48% of, one-third of, nearly one- fourth of, almost 80%, majority, on average, twice as much, almost equal, the highest, the lowest, very close to 2%, roughly, approximately 5% of, just under three per cent, etc. For establishing relationship or contrast, use phrases and words like- relationship between, similarly, in contrast with, in comparison to, but in the opposite case, however, whereas, when it comes to, as opposed to, while, striking difference, noticeable difference, etc. For conclusion and other connecting phrases use- overall, subsequently, in all, in a nutshell, for the chart given, in short, striking changes, including, therefore, etc.
  • 10. CONCLUSION The last paragraph should summaries the idea mentioned and the information in general. It should be concluding in nature and act as the closing statement. One should keep in the mind that one must not include any personal opinions, conclusions or observations. You should simply stick to the facts. The key is to choose wisely the important information, organise it well, state correct facts and summaries it properly.
  • 11. SAMPLE QUESTION   The pie chart shows the proportion of people from different households living in poverty in the UK in 2002. Write an analytical paragraph to describe the information in 100-120 words.
  • 12. ANSWER The given pie chart illustrates seven different categories of households living in poverty in the UK in 2002. It is clearly evident from the pie chart that 26% of the total poverty-stricken households are those of sole parents. Single people without children account for the second highest proportion with 24%. In contrast to couples without children that accounts for just 9%, couples with children account for 15% of the poor households. Single aged persons and aged couples proportion for 12% together for poor households. Overall, 14% of all households in the UK were living under poverty. The younger generation had a greater poor percentage than their aged counterparts. Couples without children had better economic conditions than those with children.