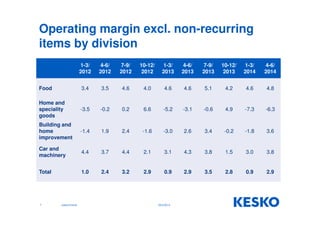
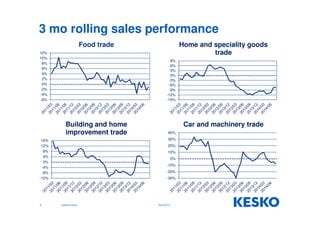
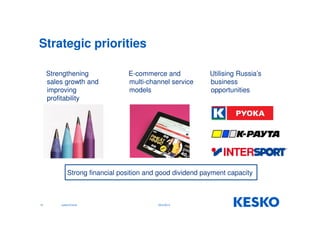
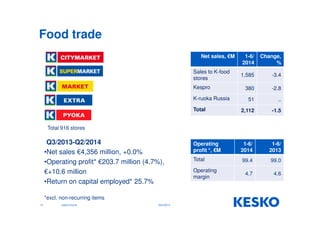
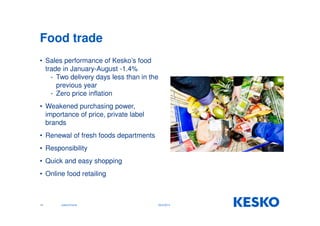
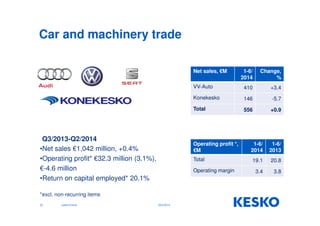
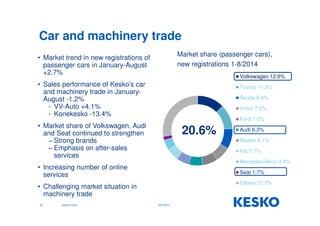
Analyst breakfast 
CFO 
Jukka Erlund 
29.9.2014
Retail trade, trend development 
115 
110 
105 
100 
95 
90 
85 
80 
75 
70 
2003 2004 2005 2006 2007 2008 2009 2010 2011 2012 2013 2014 
Turnover Volume index 
2 Jukka Erlund 29.9.2014
Consumers’ expectations for own finances 
Own finances in 12 months 
0 
2 
4 
6 
8 
10 
12 
14 
16 
1/00 
7/00 
1/01 
7/01 
1/02 
7/02 
1/03 
7/03 
1/04 
7/04 
1/05 
7/05 
1/06 
7/06 
1/07 
7/07 
1/08 
7/08 
1/09 
7/09 
1/10 
7/10 
1/11 
7/11 
1/12 
7/12 
1/13 
7/13 
1/14 
7/14 
Expectations for own finances 
Expectation, 21st century 
average 
3 Jukka Erlund 
Source: Statistics Finland 
29.9.2014
Unemployment rate 
Source: Statistics Finland 
4 Jukka Erlund 29.9.2014
Retail sales of non-food products, 
excl. fuel 
(index of turnover, yoy) 
% 
20 
15 
10 
5 
0 
-5 
2013M01 
2013M02 
2013M03 
2013M04 
2013M05 
2013M06 
2013M07 
2013M08 
2013M09 
2013M10 
2013M11 
2013M12 
2014M01 
2014M02 
2014M03 
2014M04 
2014M05 
2014M06 
2014M07 
Estonia 
Latvia 
Lithuania 
Finland 
Sweden 
Norway 
Source: Eurostat 
5 Jukka Erlund 
29.9.2014
Q3/2013-Q2/2014 key figures 
Net sales, € million 9,235 
Net sales performance, % -2.7 
Gross margin, % 13.8 
Fixed costs*, € million 1,758 
Operating profit*, € million 237 
Profit before tax, € million 206 
EPS*, € 1.75 
Liquid assets, € million 461 
Return on capital employed*, % 9.9 
Equity ratio, % 52.3 
Capital expenditure, € million 181 
* excluding non-recurring items 
6 Jukka Erlund 
29.9.2014
Operating margin excl. non-recurring 
items by division 
1-3/ 
2012 
4-6/ 
2012 
7-9/ 
2012 
10-12/ 
2012 
1-3/ 
2013 
4-6/ 
2013 
7-9/ 
2013 
10-12/ 
2013 
1-3/ 
2014 
4-6/ 
2014 
Food 3.4 3.5 4.6 4.0 4.6 4.6 5.1 4.2 4.6 4.8 
Home and 
speciality 
goods 
-3.5 -0.2 0.2 6.6 -5.2 -3.1 -0.6 4.9 -7.3 -6.3 
Building and 
home 
improvement 
-1.4 1.9 2.4 -1.6 -3.0 2.6 3.4 -0.2 -1.8 3.6 
Car and 
machinery 
4.4 3.7 4.4 2.1 3.1 4.3 3.8 1.5 3.0 3.8 
Total 1.0 2.4 3.2 2.9 0.9 2.9 3.5 2.8 0.9 2.9 
7 Jukka Erlund 29.9.2014
Kesko Group’s sales 1-8/2014 
8 Jukka Erlund 29.9.2014 
August 2014 1.1.-31.08.2014 
€ million Change, 
% 
€ million Change, % 
Food trade, total 
363.6 -3.9 2,870.2 -1.4 
Home and speciality goods trade, total 
112.5 -8.5 820.7 -9.3 
Building and home improvement trade, Finland 
100.5 -6.7 838.3 0.1 
Building and home improvement trade, other 
countries 
138.2 -2.7 984.9 0.3 
Building and home improvement trade, total 
238.7 -4.4 1,823.2 0.2 
Car and machinery trade, total 
78.1 -11.7 740.1 -1.2 
Common operations and eliminations 
-14.2 -110.1 
Grand total 778.8 -5.6 6,143.9 -2.1 
Finland, total 620.8 -5.7 4,993.0 -2.8 
Other countries, total 158.0 -5.2 1,151.0 1.3 
Grand total 778.8 -5.6 6,143.9 -2.1
3 mo rolling sales performance 
12% 
10% 
8% 
6% 
4% 
2% 
0% 
-2% 
-4% 
-6% 
Food trade 
16% 
12% 
8% 
4% 
0% 
-4% 
-8% 
9 Jukka Erlund 
9% 
6% 
3% 
0% 
-3% 
-6% 
-9% 
-12% 
-15% 
Home and speciality goods 
trade 
-12% 
Building and home 
improvement trade 
40% 
30% 
20% 
10% 
0% 
-10% 
-20% 
-30% 
Car and machinery trade 
29.9.2014
Strategic priorities 
Strengthening 
sales growth and 
improving 
profitability 
Strong financial position and good dividend payment capacity 
10 Jukka Erlund 
E-commerce and 
multi-channel service 
models 
Utilising Russia’s 
business 
opportunities 
29.9.2014
Retail trends 
• Growth of e-commerce and multi-channel 
retailing in all product lines 
• Consumers are increasingly product 
conscious and demanding 
• Importance of customer-oriented 
services as a competitive tool 
emphasized 
• Slow economic growth and 
consumers’ price awareness 
• Increasing proportion of private 
labels 
• Customer loyalty programs to be 
made interactive and provide more 
individual rewards 
11 Jukka Erlund 29.9.2014
Shopping via online 2004-2013 
% from population of ages 16-74 
Sometimes During 12 months During 3 months 
Source: Statistics Finland 
12 Jukka Erlund 
29.9.2014
Food trade 
Total 916 stores 
•Net sales €4,356 million, +0.0% 
•Operating profit* €203.7 million (4.7%), 
€+10.6 million 
•Return on capital employed* 25.7% 
*excl. non-recurring items 
13 Jukka Erlund 
29.9.2014 
Q3/2013-Q2/2014 
Net sales, €M 1-6/ 
2014 
Change, 
% 
Sales to K-food 
stores 
1,585 -3.4 
Kespro 380 -2.8 
K-ruoka Russia 51 .. 
Total 2,112 -1.5 
Operating 
profit *, €M 
1-6/ 
2014 
1-6/ 
2013 
Total 99.4 99.0 
Operating 
margin 
4.7 4.6
Food trade 
• Sales performance of Kesko’s food 
trade in January-August -1.4% 
- Two delivery days less than in the 
previous year 
- Zero price inflation 
• Weakened purchasing power, 
importance of price, private label 
brands 
• Renewal of fresh foods departments 
• Responsibility 
• Quick and easy shopping 
• Online food retailing 
14 Jukka Erlund 29.9.2014
Food trade in Russia 
• Business was begun in St. Petersburg 
- First store in 12/2012 
- Net sales for 2013 €71million 
- Today, a total of five K-ruoka 
stores 
• Net sales target for 2017 €500 million 
and a positive business result 
• ‘Best in Fresh’ concept 
− Extensive fresh foods selections 
• Purchases mainly from local markets, 
Finnish products and Pirkka have a 
prominent position 
− Majority of products not affected 
by sanctions 
15 Jukka Erlund 
29.9.2014
Home and speciality goods trade 
Q3/2013-Q2/2014 
Jukka Erlund 
16 
Net sales, €M 1-6/ 
K-citymarket, 
home and 
speciality goods 
Anttila 143 -16.1 
Intersport, Finland 78 -10.5 
Intersport, Russia 8 -21.9 
Indoor 85 -3.0 
Musta Pörssi 10 -37.2 
Kenkäkesko 10 -7.5 
Total 600 -10.0 
Operating profit *, 
€M 
2014 
267 -6.1 
1-6/ 
2014 
Change, 
% 
1-6/ 
2013 
Total -41.0 -27.8 
Operating margin -6.8 -4.2 
Total 368 stores 
•Net sales €1,390 million, -10.2% 
•Operating profit* €-21.5 million (-1.5%), 
€-26.9 million 
•Return on capital employed* -5.2% 
*excl. non-recurring items 
29.9.2014
Home and speciality goods trade 
• Sales performance of the home and speciality 
goods trade in January-August -9.3% 
• Change in customer behaviour most notably 
visible in the home and speciality goods trade 
• Consumer demand has weakened and 
competition tightened at both physical and 
online stores 
• Key objective is to achieve growth in online 
services and e-commerce 
• Improving Anttila’s profitability 
- Concept renewal 
- Improvement in cost efficiency and 
network adjustment 
17 Jukka Erlund 29.9.2014
Building and home improvement trade 
Q3/2013-Q2/2014 
18 Jukka Erlund 
Net sales, €M 1-6/ 
2014 
Change, 
% 
Rautakesko, Finland 625 +1.6 
K-rauta, Sweden 100 -3.0 
Byggmakker, 
220 -7.5 
Norway 
K-rauta, Estonia 36 +17.1 
K-rauta, Latvia 25 +6.3 
Senukai, Lithuania 137 +20.5 
K-rauta, Russia 118 -8.1 
OMA, Belarus 57 +14.4 
Total 1,317 +1.2 
Operating profit 
*, €M 
1-6/ 
2014 
1-6/ 
2013 
Total 16.2 2.9 
Operating margin 1.2 0.2 
Total 339 stores 
•Net sales €2,623 million, -3.5% 
•Operating profit* €39.0 million (1.5%), 
€+29.1 million 
•Return on capital employed* 5.5% 
*excl. non-recurring items 
29.9.2014
Building permits granted and building 
starts, mil. m3, variable annual sum 
* Preliminary data 
Source: Statistics Finland 
19 Jukka Erlund 29.9.2014
Development of the number of transactions 
of dwellings in housing companies 
80 000 
70 000 
60 000 
50 000 
40 000 
30 000 
20 000 
10 000 
0 
2008 2009 2010 2011 2012 2013 1-6/2014 
Whole country Greater Helsinki 
Source: Statistics Finland 
20 Jukka Erlund 29.9.2014
Building and home improvement trade 
• Sales performance of Kesko’s building and 
home improvement trade in January- 
August +0.2% 
- Performance in local currencies +4.3% 
• Especially in Norway and Russia, sales 
affected by exchange rate movements 
- Impact on NOK -8% 
- Impact on RUB -14% 
• Significant differences in country-specific 
market developments 
• Increasing e-commerce and online 
services and strengthening B2B sales 
21 Jukka Erlund 29.9.2014
Car and machinery trade 
Q3/2013-Q2/2014 
22 Jukka Erlund 
Net sales, €M 1-6/ 
2014 
Change, 
% 
VV-Auto 410 +3.4 
Konekesko 146 -5.7 
Total 556 +0.9 
Operating profit *, 
€M 
1-6/ 
2014 
1-6/ 
2013 
Total 19.1 20.8 
Operating margin 3.4 3.8 
•Net sales €1,042 million, +0.4% 
•Operating profit* €32.3 million (3.1%), 
€-4.6 million 
•Return on capital employed* 20.1% 
*excl. non-recurring items 
29.9.2014
Volkswagen 12.6% 
Toyota 11.5% 
Skoda 9.4% 
Volvo 7.2% 
Ford 7.0% 
Audi 6.3% 
Nissan 6.1% 
Kia 5.7% 
Mercedes-Benz 4.8% 
Seat 1.7% 
Others 27.7% 
20.6% 
Car and machinery trade 
• Market trend in new registrations of 
passenger cars in January-August 
+2.7% 
• Sales performance of Kesko’s car 
and machinery trade in January- 
August -1.2% 
- VV-Auto +4.1% 
- Konekesko -13.4% 
• Market share of Volkswagen, Audi 
and Seat continued to strengthen 
− Strong brands 
− Emphasis on after-sales 
services 
• Increasing number of online 
services 
• Challenging market situation in 
machinery trade 
23 Jukka Erlund 
Market share (passenger cars), 
new registrations 1-8/2014 
29.9.2014
New registrations of passenger cars in 
Finland 
Source: Statistics Finland 
24 Jukka Erlund 
29.9.2014
Kesko to seek more competitive multi-channel 
home and speciality goods trade 
In the home and speciality goods trade and the building and home improvement trade, the 
importance of e-commerce and online services has greatly increased and the improvement of 
competitiveness necessitates major renewal. In response to these requirements, Kesko is 
seeking synergies especially in the production of online services and the development of 
concepts. At the same time, the planned changes will form a basis to improve profitability and 
the organisational structure will be evaluated. Also the combination of the building and home 
improvement trade with the home and speciality goods trade, as well as the integration of the 
non-food part of the K-citymarket chain, currently part of the home and speciality goods 
division, into Kesko Food operations, are planned. 
The objective is to offer customers multi-channel building, interior decoration and home and speciality 
goods stores and services. The aim of the planned integration of resources is to achieve better 
customer satisfaction as well as improved competitiveness and profitability. In Kesko’s food trade, the 
annual sales are around €4.4 billion, in the building and home improvement trade around €2.7 billion 
and in the home and speciality goods trade around €1.4 billion. As at 30 June 2014, the food trade 
employed 4,035 people, the building and home improvement trade 10,520 people and the home and 
speciality goods trade 8,111 people. 
The changes will be planned in more detail and the required cooperation negotiations will be 
conducted during the rest of 2014. The aim in Kesko Group’s reporting is that starting from 1 January 
2015, the reportable segments would be the grocery trade, the home improvement and speciality 
goods trade, and the car and machinery trade. Kesko will publish comparatives according to the new 
reporting structure in the first quarter of 2015. 
President Terho Kalliokoski is responsible for the planning concerning the home improvement and 
speciality goods trade and President Jorma Rauhala is responsible for the planning concerning the 
25 grocery Jukka trade. 
Erlund 29.9.2014
Thank you! 
• IR@kesko.fi 
• www.kesko.fi/investors 
• Twitter.com/Kesko_IR 
26 Jukka Erlund 29.9.2014

Analyst Breakfast Meeting 29.9.2014

  • 1.
    Analyst breakfast CFO Jukka Erlund 29.9.2014
  • 2.
    Retail trade, trenddevelopment 115 110 105 100 95 90 85 80 75 70 2003 2004 2005 2006 2007 2008 2009 2010 2011 2012 2013 2014 Turnover Volume index 2 Jukka Erlund 29.9.2014
  • 3.
    Consumers’ expectations forown finances Own finances in 12 months 0 2 4 6 8 10 12 14 16 1/00 7/00 1/01 7/01 1/02 7/02 1/03 7/03 1/04 7/04 1/05 7/05 1/06 7/06 1/07 7/07 1/08 7/08 1/09 7/09 1/10 7/10 1/11 7/11 1/12 7/12 1/13 7/13 1/14 7/14 Expectations for own finances Expectation, 21st century average 3 Jukka Erlund Source: Statistics Finland 29.9.2014
  • 4.
    Unemployment rate Source:Statistics Finland 4 Jukka Erlund 29.9.2014
  • 5.
    Retail sales ofnon-food products, excl. fuel (index of turnover, yoy) % 20 15 10 5 0 -5 2013M01 2013M02 2013M03 2013M04 2013M05 2013M06 2013M07 2013M08 2013M09 2013M10 2013M11 2013M12 2014M01 2014M02 2014M03 2014M04 2014M05 2014M06 2014M07 Estonia Latvia Lithuania Finland Sweden Norway Source: Eurostat 5 Jukka Erlund 29.9.2014
  • 6.
    Q3/2013-Q2/2014 key figures Net sales, € million 9,235 Net sales performance, % -2.7 Gross margin, % 13.8 Fixed costs*, € million 1,758 Operating profit*, € million 237 Profit before tax, € million 206 EPS*, € 1.75 Liquid assets, € million 461 Return on capital employed*, % 9.9 Equity ratio, % 52.3 Capital expenditure, € million 181 * excluding non-recurring items 6 Jukka Erlund 29.9.2014
  • 7.
    Operating margin excl.non-recurring items by division 1-3/ 2012 4-6/ 2012 7-9/ 2012 10-12/ 2012 1-3/ 2013 4-6/ 2013 7-9/ 2013 10-12/ 2013 1-3/ 2014 4-6/ 2014 Food 3.4 3.5 4.6 4.0 4.6 4.6 5.1 4.2 4.6 4.8 Home and speciality goods -3.5 -0.2 0.2 6.6 -5.2 -3.1 -0.6 4.9 -7.3 -6.3 Building and home improvement -1.4 1.9 2.4 -1.6 -3.0 2.6 3.4 -0.2 -1.8 3.6 Car and machinery 4.4 3.7 4.4 2.1 3.1 4.3 3.8 1.5 3.0 3.8 Total 1.0 2.4 3.2 2.9 0.9 2.9 3.5 2.8 0.9 2.9 7 Jukka Erlund 29.9.2014
  • 8.
    Kesko Group’s sales1-8/2014 8 Jukka Erlund 29.9.2014 August 2014 1.1.-31.08.2014 € million Change, % € million Change, % Food trade, total 363.6 -3.9 2,870.2 -1.4 Home and speciality goods trade, total 112.5 -8.5 820.7 -9.3 Building and home improvement trade, Finland 100.5 -6.7 838.3 0.1 Building and home improvement trade, other countries 138.2 -2.7 984.9 0.3 Building and home improvement trade, total 238.7 -4.4 1,823.2 0.2 Car and machinery trade, total 78.1 -11.7 740.1 -1.2 Common operations and eliminations -14.2 -110.1 Grand total 778.8 -5.6 6,143.9 -2.1 Finland, total 620.8 -5.7 4,993.0 -2.8 Other countries, total 158.0 -5.2 1,151.0 1.3 Grand total 778.8 -5.6 6,143.9 -2.1
  • 9.
    3 mo rollingsales performance 12% 10% 8% 6% 4% 2% 0% -2% -4% -6% Food trade 16% 12% 8% 4% 0% -4% -8% 9 Jukka Erlund 9% 6% 3% 0% -3% -6% -9% -12% -15% Home and speciality goods trade -12% Building and home improvement trade 40% 30% 20% 10% 0% -10% -20% -30% Car and machinery trade 29.9.2014
  • 10.
    Strategic priorities Strengthening sales growth and improving profitability Strong financial position and good dividend payment capacity 10 Jukka Erlund E-commerce and multi-channel service models Utilising Russia’s business opportunities 29.9.2014
  • 11.
    Retail trends •Growth of e-commerce and multi-channel retailing in all product lines • Consumers are increasingly product conscious and demanding • Importance of customer-oriented services as a competitive tool emphasized • Slow economic growth and consumers’ price awareness • Increasing proportion of private labels • Customer loyalty programs to be made interactive and provide more individual rewards 11 Jukka Erlund 29.9.2014
  • 12.
    Shopping via online2004-2013 % from population of ages 16-74 Sometimes During 12 months During 3 months Source: Statistics Finland 12 Jukka Erlund 29.9.2014
  • 13.
    Food trade Total916 stores •Net sales €4,356 million, +0.0% •Operating profit* €203.7 million (4.7%), €+10.6 million •Return on capital employed* 25.7% *excl. non-recurring items 13 Jukka Erlund 29.9.2014 Q3/2013-Q2/2014 Net sales, €M 1-6/ 2014 Change, % Sales to K-food stores 1,585 -3.4 Kespro 380 -2.8 K-ruoka Russia 51 .. Total 2,112 -1.5 Operating profit *, €M 1-6/ 2014 1-6/ 2013 Total 99.4 99.0 Operating margin 4.7 4.6
  • 14.
    Food trade •Sales performance of Kesko’s food trade in January-August -1.4% - Two delivery days less than in the previous year - Zero price inflation • Weakened purchasing power, importance of price, private label brands • Renewal of fresh foods departments • Responsibility • Quick and easy shopping • Online food retailing 14 Jukka Erlund 29.9.2014
  • 15.
    Food trade inRussia • Business was begun in St. Petersburg - First store in 12/2012 - Net sales for 2013 €71million - Today, a total of five K-ruoka stores • Net sales target for 2017 €500 million and a positive business result • ‘Best in Fresh’ concept − Extensive fresh foods selections • Purchases mainly from local markets, Finnish products and Pirkka have a prominent position − Majority of products not affected by sanctions 15 Jukka Erlund 29.9.2014
  • 16.
    Home and specialitygoods trade Q3/2013-Q2/2014 Jukka Erlund 16 Net sales, €M 1-6/ K-citymarket, home and speciality goods Anttila 143 -16.1 Intersport, Finland 78 -10.5 Intersport, Russia 8 -21.9 Indoor 85 -3.0 Musta Pörssi 10 -37.2 Kenkäkesko 10 -7.5 Total 600 -10.0 Operating profit *, €M 2014 267 -6.1 1-6/ 2014 Change, % 1-6/ 2013 Total -41.0 -27.8 Operating margin -6.8 -4.2 Total 368 stores •Net sales €1,390 million, -10.2% •Operating profit* €-21.5 million (-1.5%), €-26.9 million •Return on capital employed* -5.2% *excl. non-recurring items 29.9.2014
  • 17.
    Home and specialitygoods trade • Sales performance of the home and speciality goods trade in January-August -9.3% • Change in customer behaviour most notably visible in the home and speciality goods trade • Consumer demand has weakened and competition tightened at both physical and online stores • Key objective is to achieve growth in online services and e-commerce • Improving Anttila’s profitability - Concept renewal - Improvement in cost efficiency and network adjustment 17 Jukka Erlund 29.9.2014
  • 18.
    Building and homeimprovement trade Q3/2013-Q2/2014 18 Jukka Erlund Net sales, €M 1-6/ 2014 Change, % Rautakesko, Finland 625 +1.6 K-rauta, Sweden 100 -3.0 Byggmakker, 220 -7.5 Norway K-rauta, Estonia 36 +17.1 K-rauta, Latvia 25 +6.3 Senukai, Lithuania 137 +20.5 K-rauta, Russia 118 -8.1 OMA, Belarus 57 +14.4 Total 1,317 +1.2 Operating profit *, €M 1-6/ 2014 1-6/ 2013 Total 16.2 2.9 Operating margin 1.2 0.2 Total 339 stores •Net sales €2,623 million, -3.5% •Operating profit* €39.0 million (1.5%), €+29.1 million •Return on capital employed* 5.5% *excl. non-recurring items 29.9.2014
  • 19.
    Building permits grantedand building starts, mil. m3, variable annual sum * Preliminary data Source: Statistics Finland 19 Jukka Erlund 29.9.2014
  • 20.
    Development of thenumber of transactions of dwellings in housing companies 80 000 70 000 60 000 50 000 40 000 30 000 20 000 10 000 0 2008 2009 2010 2011 2012 2013 1-6/2014 Whole country Greater Helsinki Source: Statistics Finland 20 Jukka Erlund 29.9.2014
  • 21.
    Building and homeimprovement trade • Sales performance of Kesko’s building and home improvement trade in January- August +0.2% - Performance in local currencies +4.3% • Especially in Norway and Russia, sales affected by exchange rate movements - Impact on NOK -8% - Impact on RUB -14% • Significant differences in country-specific market developments • Increasing e-commerce and online services and strengthening B2B sales 21 Jukka Erlund 29.9.2014
  • 22.
    Car and machinerytrade Q3/2013-Q2/2014 22 Jukka Erlund Net sales, €M 1-6/ 2014 Change, % VV-Auto 410 +3.4 Konekesko 146 -5.7 Total 556 +0.9 Operating profit *, €M 1-6/ 2014 1-6/ 2013 Total 19.1 20.8 Operating margin 3.4 3.8 •Net sales €1,042 million, +0.4% •Operating profit* €32.3 million (3.1%), €-4.6 million •Return on capital employed* 20.1% *excl. non-recurring items 29.9.2014
  • 23.
    Volkswagen 12.6% Toyota11.5% Skoda 9.4% Volvo 7.2% Ford 7.0% Audi 6.3% Nissan 6.1% Kia 5.7% Mercedes-Benz 4.8% Seat 1.7% Others 27.7% 20.6% Car and machinery trade • Market trend in new registrations of passenger cars in January-August +2.7% • Sales performance of Kesko’s car and machinery trade in January- August -1.2% - VV-Auto +4.1% - Konekesko -13.4% • Market share of Volkswagen, Audi and Seat continued to strengthen − Strong brands − Emphasis on after-sales services • Increasing number of online services • Challenging market situation in machinery trade 23 Jukka Erlund Market share (passenger cars), new registrations 1-8/2014 29.9.2014
  • 24.
    New registrations ofpassenger cars in Finland Source: Statistics Finland 24 Jukka Erlund 29.9.2014
  • 25.
    Kesko to seekmore competitive multi-channel home and speciality goods trade In the home and speciality goods trade and the building and home improvement trade, the importance of e-commerce and online services has greatly increased and the improvement of competitiveness necessitates major renewal. In response to these requirements, Kesko is seeking synergies especially in the production of online services and the development of concepts. At the same time, the planned changes will form a basis to improve profitability and the organisational structure will be evaluated. Also the combination of the building and home improvement trade with the home and speciality goods trade, as well as the integration of the non-food part of the K-citymarket chain, currently part of the home and speciality goods division, into Kesko Food operations, are planned. The objective is to offer customers multi-channel building, interior decoration and home and speciality goods stores and services. The aim of the planned integration of resources is to achieve better customer satisfaction as well as improved competitiveness and profitability. In Kesko’s food trade, the annual sales are around €4.4 billion, in the building and home improvement trade around €2.7 billion and in the home and speciality goods trade around €1.4 billion. As at 30 June 2014, the food trade employed 4,035 people, the building and home improvement trade 10,520 people and the home and speciality goods trade 8,111 people. The changes will be planned in more detail and the required cooperation negotiations will be conducted during the rest of 2014. The aim in Kesko Group’s reporting is that starting from 1 January 2015, the reportable segments would be the grocery trade, the home improvement and speciality goods trade, and the car and machinery trade. Kesko will publish comparatives according to the new reporting structure in the first quarter of 2015. President Terho Kalliokoski is responsible for the planning concerning the home improvement and speciality goods trade and President Jorma Rauhala is responsible for the planning concerning the 25 grocery Jukka trade. Erlund 29.9.2014
  • 26.
    Thank you! •IR@kesko.fi • www.kesko.fi/investors • Twitter.com/Kesko_IR 26 Jukka Erlund 29.9.2014