SlideShare a Scribd company logo
1 of 21
Download to read offline
Report by Johan NDONG
Rating Positive
Target Price €64.10
Price June 30, 2017 €58.99
Appreciation +8.66%
KEY STOCK DATA
P / E (TTM) 15.28
EPS (TTM) €3.86
Market Cap. €14.11 B
Shares Outstanding 239.14 M
Public Float 97.7%
Dividend Yield 2.12%
VALUATION
Price to Sales 0.85
Price to Book 3.43
Price to Cash Flow 7.46
EV to EBITDA 8.67
EV to Sales 0.96
Total Debt to EV 0.18
Total Debt / EBITDA 1.39
RANGE STOCK PRICE
52 Week High €67.80
52 Week Low €37.20
VALUATION SUMMARY
The fundamental analysis of Valeo SA highlights an 8.66% positive appreciation of the share,
which value is estimated at €64.10 compared to the price of €58.99 observed on June 30,
2017.
Innovation and expansion in Asia driving growth – Valeo strategy of innovation in CO2
emission reduction and intuitive driving, along with expansion in Asia and emerging markets,
is reaping rewards. In 2016, the Company reached €16.5 billion of sales, confirming a growth
at a compound annual rate of 8.73% over the period 2012-2016. Valeo is recognized as a
valuable partner to automakers and is among the world leaders in powertrain systems,
interior controls, driving assistance, thermal systems, and visibility systems (wipers and
lightings). With its broad portfolio of innovative products, the Company has increased its
content per vehicle over the years. Thanks to advanced capabilities in research and
development, strategic acquisitions and partnerships, and a strategic global presence –
especially in Asia –, Valeo is in a comfortable position to benefit from growth opportunities
brought by the major transformations ongoing in the automobile industry related to the shift
of the global vehicle production to Asia, the growing demand for environment-friendly cars
and vehicle connectivity, and the rise of autonomous driving.
Profitability outperforming industry peers – Valeo return on equity increased from 18.62%
in 2012 to 24.44% in 2016, outperforming its industry peers over the last five years. A focus
on strong value-added products, combined with a wise management of costs (resulting in
increased margins), allow Valeo to make comfortable profits. Good cash generation assets
and operational efficiency have strengthened the position of the Company at the top of its
industry.
Solid financial health – Valeo has sound finances with a low leverage. The Company has
strong cash generation operations and a good cash balance that allow to make the
investments to sustain its strategy of innovation and global expansion free of any financial
pressure.
Identified risks – The main risks identified for The Company are related to the cyclicity of the
automobile industry, the fierce competition for innovation between automotive suppliers,
compliance with regulations, and the financial exposure to fluctuations of global markets.
Report by Johan NDONG
DISCLAIMER
This report is a personal research work based on the author’s analysis and appreciation of
public information available at June 30, 2017. The report is not intended to be used as a
professional recommendation or advice to invest in the presented stock, and the author
declines responsibility for actions engaged on the basis of this document.
Report by Johan NDONG
COMPANY OVERVIEW
Valeo is an automotive supplier that partners all automakers worldwide. The Company
develops innovative products and systems that contribute to the reduction of CO2 emissions
and to the development of intuitive driving.
Activity
Valeo operates through four Business Groups: Comfort & Driving Assistance, Powertrain
Systems, Thermal Systems and Visibility Systems.
Comfort & Driving Assistance Systems (20% of total sales in 2016). This Business Group
develops sensor-based technologies for driving and parking assistance, short- and long-range
connectivity systems, and HMI (Human-Machine Interfaces).
Powertrain Systems (24% of total sales in 2016). This Business Group develops solutions for
vehicle electrification, transmission automation, and engine cleaning.
Thermal Systems (28% of total sales in 2016). This Business Group develops and manufactures
HVAC units, air quality systems, and heating and air conditioning systems, as well as powertrain
thermal energy management systems.
Visibility Systems (28% of total sales in 2016). This Business Group designs internal and
external lighting solutions, and wiper systems.
Valeo provides aftermarket services through the Valeo Service Entity, which supplies original
equipment spares to automakers and replacement parts to the independent aftermarket.
The Company generates revenue primarily from original equipment sales. In 2016, original
equipment accounted for 87% of total sales and aftermarket accounted for 10%.
Sales by geographic area
Valeo has a global footprint in 150 countries. In 2016, Europe accounted for 50% of total sales,
split into 8% in France and 42% in others European countries (small part in Africa). Asia
represented 27% of total sales, and North America accounted for 21%.
Clients
In 2016, Valeo clients included German automakers (30% of original equipment sales), Asian
automakers (27%), US automakers (22%), and French automakers (15%).
Valeo main clients are (in alphabetic order) BMW, BYD Auto, Chang’an Automobile, Chery,
DAF, Daimler, Dongfeng Motor Corporation, Fiat Chrysler Automobiles, FAW, Ford Motor
Company, Geely Group, General Motors Group, Great Wall, Honda, Hyundai Group, JAC,
Mahindra & Mahindra, Maruti Suzuki, Mazda, Mitsubishi, PSA Peugeot Citroën, Renault-Nissan,
SAI C, Subaru, Suzuki, Tata Group, Toyota, Volkswagen Group and Volvo Group.
Share ownership
As of March 21, 2017, Valeo has 239 143 131 shares outstanding. Lazard Asset Management
LLC holds 5.04% of the share capital and 4.92% of the voting rights, and BlackRock Inc. holds
5.22% of the share capital and 5.10% of the voting rights.
Executives and Board members
Jacques Aschenbroich is the Chairman of the Board of Directors (appointed on February 16,
2016) and Chief Executive Officer (since March 20, 2009). Under his direction the Company
reorganized during 2009-2010 to arrive at the current operating structure and market position.
Report by Johan NDONG
STRATEGIC ANALYSIS
Valeo operates in the automotive equipment sector, which is part of the automobile industry.
As a tier-one supplier, Valeo is at the high-end of the supply chain and sells its products directly
to automakers.
Industry overview and analysis
Porter’s analysis (extended)
Competitors – Competition in the industry is fierce with the globalisation of vehicle production,
which requires suppliers to expand internationally to follow automakers and, hence, to
compete with local suppliers. Moreover, innovation is a key factor of differentiation, which
puts pressure on companies to invest in areas which may take time to bring success.
New entrants – Barriers to entry are relatively high for traditional parts. Nonetheless, increased
electronics and software in automobile-specific technologies have opened doors for Tech
companies specialized in IT and artificial intelligence.
Customers – Automotive suppliers are heavily dependent on automakers’ production levels
and strategies. Yet, they have become more valuable partners with an increased value added
on worldwide automobile manufacture (82% of value added in 2015 compared to 56% in 1985).
Suppliers – Tier-one automotive suppliers have higher margins and more bargaining power
over lower level suppliers. However, since raw materials account for a very substantial part of
their cost structure, they are particularly sensitive to increase in prices.
Substitutes – There is no real threat from substitutes but automotive suppliers must constantly
adapt their products to meet automobile consumer demand and automaker needs, or face the
risk of getting themselves into difficulty.
Government – The automobile industry is subject to governmental regulations seeking to
reduce vehicle emissions and improve vehicle safety. Furthermore, the industry has, in recent
years, been the subject of enforced antitrust and competition laws in the United States and in
Europe.
Industry trends
Global vehicle production shifting to Asia – Main driver of the automotive supplier sector, the
global vehicle production is forecast to reach 114 million of units by 2021 from 93 million of
vehicles produced in 2016 (according to a study by IHS Markit). Global production is currently
shifting to Asia with over 50% of vehicles produced in the region since 2012, China representing
29% of the total production in 2016. This trend will accentuate in the future. Asia is forecast to
account for 65% of the global production growth over the period 2017-2021, with China
accounting for almost half of the total growth, while Europe and North America are forecast to
experience low growths.
Reduction of vehicle emissions – Across the world, growing concern over vehicle pollution and
stringent government regulations on emissions drive the demand for more environment-
friendly cars. As the demand grows, it is transforming the field of engine systems design toward
technologies for fuel efficiency and electric vehicle. In mid-term projections, the share of
traditional ICE systems (Internal Combustion Engine) is forecast to decrease rapidly, with fuel
efficient ICE Stop-Start systems expected to emerge as the first alternative, while the share of
electric vehicles is expected to increase smoothly without exceeding 10% until after 2021.
More autonomous and connected cars – The third major transformation in the automobile
industry is the revolution happening in the development of connected cars and autonomous
driving. Current digitalization of the society increases the demand for advanced vehicle
connectivity, and the need for safer cars and for improved driving experience fosters the
Report by Johan NDONG
demand for driving assistance systems. As the technologies progress, connected and partially
autonomous cars are expected to gain prominence until fully autonomous cars become
generalized in the long-term.
Market size
Sustained by the growth of the global vehicle production, the automotive lighting system
market is forecast to reach €27 billion in 2022, growing at a CAGR of 6.8% between 2017 and
2022 (according to a report by Markets and Markets), the wiper system market is forecast to
reach €10 billion by 2025 from an estimated value of €6.7 billion in 2016 (according to a study
by Grand View Research), and the thermal system market is expected to reach €54 billion by
2022 from an estimated value of €29 billion in 2013 (according to a report by Transparency
Market Research). Increasing demand for fuel efficiency and vehicle electrification are
expected to grow the powertrain system market to €474 billion by 2020, knowing the market
was estimated at €331 billion in 2013 (according to a report by Transparency Market Research).
Following the trend in vehicle connectivity and autonomous driving, the global connected car
market is forecast to reach €123 billion by 2022 from an estimated value of €41 billion in 2016
(data available on Statista), and the global advanced driver assistance system market is
forecast to reach €38 billion by 2021, growing at a CAGR of 10.4% over 2017-2021 (according
to a report by Research and Markets).
Valeo strategy
Strategy focus
Valeo has axed its strategy on innovation for CO2 emission reduction and intuitive driving, and
expansion in Asia and emerging markets. Valeo key differentiation is its positioning on strong
value-added aesthetic, smart, and fuel-efficient systems matching perfectly the trends in
automobile consumer demand and automaker needs, and from which the Company earns
substantial revenue and makes comfortable margins.
SWOT analysis
Strengths – Valeo is among the world leaders in powertrain systems, parking and driving
assistance, connectivity solutions, thermal systems, lighting solutions and visibility systems.
The Company has advanced capabilities in Research & Development (1840 patents filed and
2700 development projects in 2016) and makes strategic acquisitions and partnerships thanks
to which it delivers constant innovations in CO2 emission reduction and intuitive driving (50%
of order intake in innovative products in 2016). Valeo has also a global footprint with a strong
presence in Asia, especially in China. The Company has 59 plants (out of a total of 155), 12
development centers (out of total of 38) in Asia & Middle East/Oceania, and made 27% of its
total sales in China in 2016.
Weaknesses – The Company has limited sales compared to its main competitors (Bosch, Denso,
Continental). In 2016, Valeo had €16.5 billion of sales compared to €43.9 billion for Bosch,
€36.4 billion for Denso and €24.5 billion for Continental.
Opportunities – Valeo focuses on solutions for powertrain electrification, hybridization and
smart engines. Thanks to innovations in the three main technologies that will dominate
tomorrow’s engine systems, the Company is on track to benefit from opportunities brought by
the growing demand for greener cars. Moreover, thanks to innovations in connectivity and
driving assistance, the Company has increased its content per car. Owning one of the broadest
portfolio of sensor technologies of the industry constituting the foundation for automated
driving (ultrasonic, radar, camera, and laser scanner), Valeo is in a comfortable position to
benefit from opportunities related to autonomous cars. Finally, innovations in in-vehicle
comfort (air conditioning systems, HMIs, visibility systems), and a strong presence in Asia
ensure Valeo will benefit from the growth of the global vehicle production in all geographic
areas, especially in Asia.
Report by Johan NDONG
Threats – Fierce competition between automotive suppliers and a slowing growth in China (the
Company primary growth market) constitute the main obstacles to Valeo strategy.
Latest significant events
Valeo will further enforce its position as a leader in automatic cars with the launch of the joint
venture Valeo-KAPEC with Pyeong Hwa (specialized in transmission coupling) and the
acquisition of FTE Automotive (specialized in transmission actuators), two operations forecast
to bring additional sales of €2 billion in 2021.
In January 2017, Valeo announced the takeover of Ichikoh (specialized in lighting solutions), an
operation that will strengthen the position of the Company as a world leader in lighting
systems.
In 2016, Valeo launched a joint venture with Siemens eAutomotive to develop products for
vehicle electrification. This joint venture announces positive perspectives with already €1.6
billion order intake since its creation.
Report by Johan NDONG
FINANCIAL ANALYSIS
The financial analysis of the Company was done over the period 2012-2016, in comparison with
the performance of industry peers. Data analysed are based on extract from Capital-IQ. A table
summarizing this analysis is presented in Appendix-2.
Peer comparable
Valeo peers are European, American and Asian automotive suppliers that develop products for
powertrain systems, smart vehicle, interior controls & electronic systems, thermal systems,
wipers systems, or lighting systems. The selected companies have a significant part of their
business in automotive equipment (more than 45% of total sales), operate in the three major
markets (Europe, America and Asia), and make at least €5.0 billion of sales. Appendix-1
provides a classification of Valeo and its peers with regard to the sales achieved in 2016.
Sales analysis
In 2016, Valeo sales reached €16.5 billion, which represented a €4.8 billion increase from 2012
and a CAGR (Compound Annual Growth Rate) of 8.73% over the period 2012-2016. Regarding
the performance of the Business Groups, sales of Visibility Systems grew at a CAGR of 12.60%,
sales of Comfort & Driving Assistance Systems grew at a CAGR of 9.50%, sales of Thermal
Systems grew at a CAGR of 8.25%, and sales of Powertrain Systems grew a CAGR of 5.10%. In
terms of geography, sales in North America grew at a CAGR of 18.00%, sales in Asia grew at a
CAGR of 14.38%, and sales in Europe grew at a CAGR of 5.45%. Over 2012-2016, Valeo sales
growth outperformed the peers which achieved an average CAGR of 5.71%.
Costs analysis
In 2016, Valeo had an EBITDA of €1.8 billion and an EBIT of €1.2 billion.
Gross margin – Between 2012 and 2016, Valeo gross margin increased from 16.57% to 18.28%.
Major source of expense, cost of raw materials averaged 58.54% of total sales. Also at a stable
level, depreciation and amortization represented on average 2.92% of total sales.
Improvement of the gross margin came from a decrease of labor costs (from 13.22% of total
sales in 2012 to 11.96% in 2016) and a decrease of direct production costs and production
overheads (from 8.58% of total sales in 2014 to 8.22% in 2016). Compared to the peers, Valeo
had a higher gross margin all the years between 2012 and 2016 except in 2014. Over 2012-
2016, Valeo average gross margin was 17.42% compared to 17.25% for the peers.
EBITDA and EBIT margins – Between 2012 and 2016, Valeo EBITDA margin increased from
9.39% to 11.08%, and EBIT margin increased from 5.98% to 7.66%. Regarding EBIT margin,
selling expense decreased from 1.67% of total sales in 2012 to 1.56% in 2016, administrative
expense decreased from 3.65% of total sales in 2012 to 3.23% in 2016, and net expense in
research and development increased from 4.99% of total sales in 2012 to 5.70% in 2016
(reflecting Valeo strategy of innovation). Contrary to gross margin, over 2012-2016, Valeo had
lower EBITDA margin than its peers. The Company average EBITDA margin was 10.20%
compared to 10.39% for the peers.
Profitability
Return on equity – Return on equity increased from 18.62% in 2012 to 24.44% in 2016. The
Company recorded an average return on equity of 21.56% over 2012-2016, a performance
above the peer average return on equity of 18.51%. During the last four years, Valeo ranked in
the upper quartile among the peers.
Return on capital – Between 2012 and 2016, Valeo return on capital increased from 10.64% to
12.42%. Over the period, the Company average return on capital stood at 11.63%, a result
above the average of the peer return on capital which stood at 9.96%.
Report by Johan NDONG
Return on assets – Valeo return on assets increased from 5.03% in 2012 to 6.13% in 2016.
During the last two years, with returns on assets of respectively 6.08% in 2015 and 6.13% in
2016, Valeo outperformed the peers which achieved returns of respectively 5.86% and 5.98%.
Operating efficiency
Over 2012-2016, Valeo had an average asset turnover of 1.33, below the average of 1.43 of the
peers (but above the median of 1.31), outlining a possible area of improvement. However, the
Company was more efficient than the peers regarding fixed asset turnover (average ratio of
5.65 compared to 5.52 for the peers) and inventory turnover (average ratio of 11.74 compared
to 10.87 for the peers). Finally, Valeo had an average operating cash flow to assets ratio of 0.13,
above the average ratio of 0.10 of the peers, which shows the better cash generation assets of
the Company.
Liquidity
Valeo current ratio decreased from 1.10 in 2012 to 0.99 in 2015 before it was re-established at
1.05 in 2016. Over 2012-2016, the level of the Company current ratio indicated current assets
were sufficient to cover current liabilities but Valeo average ratio of 1.05 was below the
average ratio of 1.54 of the peers. Not surprisingly, Valeo had a 0.74 average quick ratio, below
the average ratio of 1.05 of the peers. However, the Company had an average operating cash
flow to current liabilities ratio of 2.16, above the 1.61 average ratio of the peers, thanks to
strong cash generation operations.
Solvency
Valeo has a net debt to market capitalization ratio below 5% since 2014. The total debt of the
Company was €2.9 billion at December 31, 2016, compensated by a cash balance of €2.4 billion.
Over the period 2012-2016, Valeo had an average total debt to assets ratio of 0.20, a figure in
line with industry practice, the peers having an average ratio of 0.20 as well. The Company had
an average total debt to EBITDA ratio of 1.54, which is just below the average ratio of 1.62 for
the peers but above the median ratio of 1.31. Valeo stands out from its peers with its high
operating cash flow to interests and capex ratio of 2.57, compared to 2.09 for the peers, which
highlights the strength and capacity of the Company to pay its interests expense and finance
investments aimed at improving its assets by using only the cash generated from its operations.
Dupont analysis
The Dupont analysis of Valeo shows that the increase of the return on common equity over the
period 2012-2016 was primarily attributable to improvement of the Company profit margins
which increased by 240 basis points in five years.
Valeo 2012 2013 2014 2015 2016
Return On Common Equity 18.4% 18.4% 21.7% 22.4% 25.0%
Profit margin = Net Profit / Sales 3.2% 3.8% 4.4% 5.0% 5.6%
Asset Turnover = Sales / Total Assets 1.3x 1.3x 1.3x 1.4x 1.3x
Financial Leverage = Total Assets / Common Equity 4.3 3.7 3.6 3.3 3.5
Report by Johan NDONG
VALUATION
The valuation of Valeo is done using the DCF model (cash flow analysis) and peer comparable
(valuation based on market capitalization). From these two techniques, the value of the share
is estimated at €64.10.
DCF
The Discounted Free Cash Flow model applied over the forecast period 2017-2021 estimates
the stock value at €66.60, which corresponds to a 12.90% upside compared to the stock price
of €58.99 observed on June 30, 2017. Details of the calculations are provided in Appendix-3.
The DCF model is built on the following assumptions:
Sales – In the projected business plan, Valeo forecasts sales of the Comfort & Driving Assistance
Systems Business Group to grow at a compound annual rate of 10% during 2017-2021, which
is in line with the historical CAGR of 9.50% over 2012-2016. The Company plans to achieve sales
growth at a compound annual rate of 14% for the Powertrain Systems Business Group, which
is almost three times the CAGR of 5.10% between 2012 and 2016, thanks to additional sales
brought by the joint-venture Valeo- KAPEC and the acquisition of FTE Automotive (operations
currently pending approvals). For the Thermal Systems Business Group, Valeo projects sales to
grow at a compound annual rate of 7% during 2017-2021 while the historical CAGR was 8.25%
over 2012-2016. Finally, the Company forecasts sales of the Visibility Systems Business Group
to grow at a compound annual rate of 10% during 2017-2021, compared to the historical CAGR
of 12.60% between 2012 and 2016.
Costs and margins – Gross margin is assumed to improve slightly, as this was the case over
2012-2016, increasing from 18.44% of total sales in 2017 to 18.81% in 2021, mainly thanks to
decreasing labor costs and stabilized expense in raw materials and direct production costs. The
Company projects to spend approximately 6% of total sales in research and development and
intends to lower administrative expense to 2.80% of total sales by 2021. Assuming selling
expense decreases to 1.43% of total sales in 2021, EBIT margin is expected to increase to 8.58%
in 2021.
Capital expenditures – The company projects to spend 6% of total sales in capital expenditures
during the forecast period.
Terminal value – The perpetuity growth rate is assumed to be 1.5%. This is the rate the
Company uses in its impairment tests and it is in line with the average long-term growth rate
of the business sector.
WACC – The WACC of the Company is estimated at 8.92%. The calculation of the cost of equity
is based on a risk-free rate of 2.48% (10-year average of the 10-year French Government Bond),
a market risk premium of 6% in France (based on industry practice) and an unlevered industry
beta of 1.09 (from Valeo estimates). The after-tax cost of debt is derived from a pre-tax cost of
debt of 1.625% (corresponding to the coupon of the last 10-year bond issued by the Company)
and a tax rate of 25.0% (corresponding to the average rate of taxes paid by the Company over
the last 5 years).
Sensitivity analysis – The growth of the sales of the Powertrain Systems Business Group (from
a CAGR of 5% historically to a CAGR of 14% in the forecast), the WACC, and the perpetuity
growth rate are the main critical assumptions of the model (ordered from the most to the least
critical). A sensitivity analysis was performed to assess the impact of change of initial
assumptions on the valuation. The result of this analysis gives an estimated stock value
between €57.45 and €73.54 for a sales growth between 11.0% and 14.5% of the Powertrain
Systems Business Group, a WACC between 8.50% and 9.25%, and a perpetuity growth rate
between 1.25% and 1.75%.
Unlevered Beta (industry peers) 1.09
Risk-Free Rate 2.48%
Risk Premium 6.00%
Cost of Equity 9.19%
Cost of Debt 1.63%
Net Debt/Equity 3.45%
WACC 8.92%
Report by Johan NDONG
Peer Comparable
The valuation of the Company using peer comparable gives an estimated stock value of €60.34,
which corresponds to a 2.3% upside compared to the stock price of €58.99 observed on June
30, 2017. Peer comparable selection criteria are detailed at the beginning of the financial
analysis. Only peers for which consensus estimates of sales, EBITDA and EBIT for the years
2017, 2018 and 2019 were used in the valuation. Details of the valuation are provided in
Appendix-4.
EV / EBITDA multiple – Considering peer Entreprise Value as of June 30, 2017 with EBITDA of
the year 2016, average EV / EBITDA multiple is 7.2, the median is 6.3, the minimum is 3.9, and
the maximum is 16.1 (with a standard deviation of 38%). The valuation is done using peer
Entreprise Value at June 30, 2016 with consensus estimates of their EBITDAs over the years
2017, 2018 and 2019. To avoid noise in the calculation, the peers with the higher and the lower
EV / EBITDA multiples were removed from the valuation. Peer average EV / EBITDA multiple
with expected 2017 EBITDA is 6.3, the multiple with expected 2018 EBITDA is 5.9, and the
multiple with expected 2019 EBITDA is 5.5 (with standard deviations around 25%). Application
of the calculated EV / EBITDA multiples to the consensus estimates of the Company EBITDA
over 207-2019 results in an estimated stock value of €60.34 (average), a minimum of €48.23
(lower quartile) and a maximum of €70.02 (upper quartile).
Other valuation multiples – EV / Sales and EV / EBIT ratios are not accurate enough to value
the Company stock in the present case. Indeed, EV / Sales ratio does take into account the
difference in operating efficiency and margins between the peers, and EV / EBIT ratio is biased
by companies’ accounting of depreciation and amortization.
Final stock valuation
The DCF model gives an estimate of the fair value of the stock considering the future cash flows
of the Company, and peer comparable gives an estimate of the value of the stock considering
current market conditions. The result of the DCF model is weighted at 60% in the final valuation
since it captures better the intrinsic value of the Company and, in the present case, the future
cash flows can be properly estimated. The result of the valuation using peer comparable is
weighted less than 50% since the economy is currently under normal conditions (no recession
and no underlying bubble in the industry). The combination of the two valuation techniques
gives an estimated stock value of €64.10.
66.60 5.00% 8.00% 11.00% 14.00% 14.50% 15.00% 15.50%
8.25% 55.27 60.92 67.20 74.15 75.38 76.63 77.90
8.50% 53.04 58.47 64.50 71.18 72.36 73.56 74.78
8.75% 50.96 56.18 61.98 68.41 69.54 70.69 71.87
8.92% 49.61 54.70 60.35 66.60 67.71 68.83 69.98
9.00% 49.02 54.05 59.64 65.82 66.91 68.03 69.15
9.25% 47.21 52.06 57.45 63.41 64.46 65.53 66.62
9.50% 45.51 50.19 55.39 61.14 62.16 63.19 64.24
Sensitivity to growth of sales of Powertrain Systems (CAGR)WACC
66.60 0.75% 1.00% 1.25% 1.50% 1.75% 2.00% 2.25%
8.25% 67.47 69.54 71.77 74.15 76.72 79.50 82.51
8.50% 64.99 66.91 68.97 71.18 73.54 76.09 78.85
8.75% 62.67 64.46 66.37 68.41 70.59 72.94 75.47
8.92% 61.15 62.85 64.67 66.60 68.68 70.90 73.29
9.00% 60.49 62.15 63.93 65.82 67.85 70.02 72.35
9.25% 58.43 59.99 61.65 63.41 65.29 67.29 69.45
9.50% 56.50 57.96 59.50 61.14 62.89 64.75 66.74
WACC
Perpetuity growth rate
50% 55% 60% 65% 70%
30% 64.72
35% 64.41
40% 64.10
45% 63.78
50% 63.47
DCF
Peer
Comparable
(in millions except stock price) Average
Total Entreprise Value 16 201
Market Capitalization 14 429
Shares Outstanding 239
Stock Value 60.34
Report by Johan NDONG
IDENTIFIED RISKS
Economic risks
The car-making industry is cyclical in nature and depends on economic prosperity, fuel prices,
consumer confidence and employment. The automobile industry has recovered from the 2008
crisis but low economic growth in Europe and a slowdown in the growth in China is a risk to
Valeo perspectives.
Industry risks
Valeo operates in a very competitive industry that requires market players to differentiate
through innovation, which puts pressure on the Company to invest heavily in research and
development in areas which may or may not bring future success.
Regulatory & Legal risks
Valeo was recently under investigation by the United States and European antitrust authorities
regarding components and systems supplied to the automotive industry. Though the first case
was settled with the US Department of Justice in 2013 and the Company had made sufficient
provision before receiving the fine from the European Commission in March 2017 for the
second case, new lawsuits resulting from facts or circumstances that are unknown at present
cannot be ruled out.
Financial risks
Since Valeo operates at an international level, the Company is exposed to fluctuations in
foreign currencies and commodity prices.
Report by Johan NDONG
APPENDIX 1 – PEER GROUP
Data from the companies’ annual reports (2016)
EMEA NAFTA APAC
Engine &
Powertrain systems
Interior controls &
Electronic systems
Thermal systems Visibility systems
1 Robert Bosch Germany 43.9 60% 53.0% 19.0% 28.0% X X X X
2 Denso Japan 37.7 100% 13.1% 24.6% 84.1% X X X X
4 Magna Canada 32.9 100% 25.1% 53.2% 6.0% X X X
3 ZF Friedrichshafen Germany 32.6 92% 49.0% 29.0% 22.0% X X
5 Hyundai Mobis South Korea 29.8 100% 12.8% 22.8% 59.4% X X
6 Aisin Seiki Japan 29.7 97% 8.7% 17.4% 73.9% X X
7 Continental Germany 24.5 61% 50.0% 26.0% 21.0% X X
8 Faurecia France 18.7 100% 51.5% 27.9% 16.4% X
9 Lear USA 16.8 100% 38.0% 40.5% 18.6% X
10 Valeo France 16.5 100% 50.0% 20.9% 26.7% X X X X
11 Johnson Controls USA 15.2 45% 27.0% 47.4% 6.0% X
12 Delphi USA 15.1 100% 35.0% 39.0% 26.0% X X X
13 Cummins USA 12.6 80% xxx 54.1% xxx X
14 Mahle Germany 12.3 100% 50.0% 26.0% 19.0% X X
15 Toyota Boshoku Japan 11.3 59% 6.5% 21.5% 72.0% X X
16 Schaeffler Germany 10.3 78% 53.1% 21.0% 25.9% X
17 Autoliv USA 9.1 100% 30.6% 33.6% 35.9% X
18 Calsonic Kansei Japan 8.8 100% 11.9% 40.4% 47.7% X X X
19 BorgWarner USA 8.2 100% 40.0% 33.0% 27.0% X
20 Tenneco USA 7.8 100% 35.0% 49.0% 16.0% X
21 Koito Japan 7.0 100% 4.2% 23.3% 73.3% X
23 Jtekt Japan 6.9 100% 16.0% 24.9% 59.1% X
22 Federal Mogul USA 6.7 100% 41.0% 45.0% 10.0% X X
24 Hella Germany 6.4 100% 55.0% 19.0% 27.0% X X
25 Benteler Germany 5.9 78% 63.3% 19.1% 12.0% X
26 Dana USA 5.3 100% 28.0% 53.0% 13.0% X
*Currency translations are based on the averages of the exchange rates that prevailed in 2016
CompanyRank
% Sales by geaographic area ProductsAutomotive
equipment sales
(€ billion*)
Automotive
equipment sales
as % of total salesCountry
Report by Johan NDONG
APPENDIX 2 – FINANCIAL ANALYSIS
Key financials (based on extract from Capital-IQ)
2012 2013 2014 2015 2016 Average*
Financial results (in millions of euros)
Sales 11 759 11 662 12 725 14 544 16 519
EBITDA 1 104 1 137 1 286 1 549 1 831
EBIT 703 750 851 1 043 1 266
Sales growth 8.20% -0.83% 9.12% 14.29% 13.58% 8.73%
Peer average 4.04% 6.05% 8.89% 6.60% 4.25% 5.71%
Margins
Gross margin 16.57% 17.23% 17.31% 17.69% 18.28% 17.42%
Peer average 16.15% 17.03% 17.35% 17.60% 18.13% 17.25%
EBITDA margin 9.39% 9.75% 10.11% 10.65% 11.08% 10.20%
Peer average 9.58% 10.20% 10.40% 10.68% 11.10% 10.39%
EBIT margin 5.98% 6.43% 6.69% 7.17% 7.66% 6.79%
Peer average 6.00% 6.55% 6.81% 6.98% 7.25% 6.72%
Profitability
Return on Equity 18.62% 19.82% 21.63% 23.29% 24.44% 21.56%
Peer average 22.30% 15.26% 16.48% 18.16% 20.33% 18.51%
Return on Capital 10.64% 10.81% 11.58% 12.69% 12.42% 11.63%
Peer average 9.46% 9.32% 10.28% 10.27% 10.45% 9.96%
Return on Assets 5.03% 5.27% 5.63% 6.08% 6.13% 5.63%
Peer average 5.29% 5.32% 5.80% 5.86% 5.98% 5.65%
Operating efficiency
Asset turnover 1.35x 1.31x 1.35x 1.36x 1.28x 1.33x
Peer average 1.48x 1.46x 1.44x 1.40x 1.37x 1.43x
Inventory turnover 12.63x 12.07x 12.04x 11.41x 10.57x 11.74x
Peer average 11.38x 11.04x 10.75x 10.65x 10.51x 10.87x
Fixed Asset turnover 5.83x 5.61x 5.56x 5.55x 5.69x 5.65x
Peer average 5.90x 5.67x 5.53x 5.36x 5.16x 5.52x
Days Sales Outstanding 50 47 45 46 49 47
Peer average 56 54 54 55 57 55
Days Inventory 29 30 30 32 35 31
Peer average 40 39 40 40 42 40
Payable Period 85 86 86 89 95 88
Peer average 56 55 56 57 61 57
Cash Conversion Cycle -6 -9 -11 -11 -11 -10
Peer average 39 38 38 38 38 39
Operating Cash Flow to Assets 0.11x 0.15x 0.13x 0.15x 0.13x 0.13x
Peer average 0.10x 0.10x 0.10x 0.10x 0.11x 0.10x
Liquidity
Current Ratio 1.10x 1.09x 1.04x 0.99x 1.05x 1.05x
Peer average 1.55x 1.55x 1.58x 1.52x 1.50x 1.54x
Quick Ratio 0.73x 0.78x 0.74x 0.69x 0.76x 0.74x
Peer average 1.06x 1.07x 1.06x 1.03x 1.03x 1.05x
Op. Cash Flow to Current Liabilities 0.23x 0.34x 0.30x 0.32x 0.30x 0.30x
Peer average 0.31x 0.32x 0.31x 0.33x 0.35x 0.32x
Solvency
Total Debt to Assets 0.23x 0.21x 0.18x 0.16x 0.20x 0.20x
Peer average 0.18x 0.20x 0.20x 0.22x 0.20x 0.20x
Total Debt to EBITDA 1.89x 1.64x 1.43x 1.15x 1.59x 1.54x
Peer average 1.62x 1.59x 1.58x 1.69x 1.60x 1.62x
EBITDA to Interest expense 9.44x 10.63x 12.61x 16.66x 20.12x 13.89x
Peer average 33.25x 32.49x 34.10x 34.20x 36.02x 34.01x
Op. Cash Flow to Interest expense + Capex 1.93x 2.90x 2.52x 2.89x 2.60x 2.57x
Peer average 1.83x 2.42x 1.95x 1.99x 2.27x 2.09x
*Average Sales growth = Compound Annual Growth Rate
Report by Johan NDONG
Sales analysis
Costs analysis (removing impairments)
(in millions of euros) 2012 2013 2014 2015 2016 CAGR 2012-2016
Sales by Business Group
Comfort & Driving Assistance Systems 2487 2217 2291 2702 3343 9.50%
% Growth 17.09% -10.86% 3.34% 17.94% 23.72%
Powertrain Systems 3237 3119 3292 3706 3975 5.10%
% Growth 4.45% -3.65% 5.55% 12.58% 7.26%
Thermal Systems 3313 3340 3598 4032 4622 8.25%
% Growth 6.53% 0.81% 7.72% 12.06% 14.63%
Visibility Systems 2698 2958 3515 4073 4545 12.60%
% Growth 7.45% 9.64% 18.83% 15.87% 11.59%
Other 24 28 29 31 34 7.21%
% Growth 0.00% 16.67% 3.57% 6.90% 9.68%
Total sales 11759 11662 12725 14544 16519 8.73%
Restated
(in millions of euros) 2012 2013 2014 2015 2016 CAGR 2012-2016
Sales by geographic area
Europe (including Africa) 6233 6313 6637 7283 8262 5.45%
% Growth -1.66% 1.28% 5.13% 9.73% 13.44%
North America 1921 1977 2454 3085 3452 18.00%
% Growth 27.30% 2.92% 24.13% 25.71% 11.90%
South America 686 602 455 351 393 -12.52%
% Growth -10.56% -12.24% -24.42% -22.86% 11.97%
Asia 2919 2770 3179 3825 4412 14.38%
% Growth 29.50% -5.10% 14.77% 20.32% 15.35%
Total sales 11759 11662 12725 14544 16519 8.73%
Restated
(in millions of euros) 2012 2013 2014 2015 2016
Total sales 11759 11662 12725 14544 16519
Cost of sales
Raw materials consumed -6895 -6837 -7423 -8510 -9681
% ofTotal Sales 58.64% 58.63% 58.33% 58.51% 58.61%
Labor -1555 -1509 -1642 -1806 -1975
% ofTotal Sales 13.22% 12.94% 12.90% 12.42% 11.96%
Direct production costs and production overheads -1019 -979 -1092 -1209 -1358
% ofTotal Sales 8.67% 8.39% 8.58% 8.31% 8.22%
Depreciation and amortization -342 -328 -365 -446 -485
% ofTotal Sales 2.91% 2.81% 2.87% 3.07% 2.94%
Total cost of sales -9811 -9653 -10522 -11971 -13499
Gross margin 1948 2009 2203 2573 3020
Gross margin as % oftotal sales 16.57% 17.23% 17.31% 17.69% 18.28%
Research and Development expenditure, net -587 -604 -683 -783 -941
% ofTotal Sales 4.99% 5.18% 5.37% 5.38% 5.70%
Selling expenses -196 -193 -207 -230 -258
% ofTotal Sales 1.67% 1.65% 1.63% 1.58% 1.56%
Administrative expenses -429 -436 -449 -486 -533
% ofTotal Sales 3.65% 3.74% 3.53% 3.34% 3.23%
EBIT 736 776 864 1074 1289
Restated
Report by Johan NDONG
APPENDIX 3 – DCF VALUATION
WACC Calculation
1Average effective tax rate during the last 5 years - 2Extract from the 2016 annual report - 3Average net debt / equity ratio during the last 5 years
4Extract from the 2016 annual report
Sales forecast
Costs projection
Corporate Tax Rate1
25.0%
Unlevered Beta (industry peers)2
1.09
Re-levered Beta 1.12
Risk-Free Rate 2.48%
Risk Premium 6.00%
Cost of Equity 9.19%
Cost of Debt 1.63%
Net Debt/Equity3
3.45%
WACC 8.92%
Perpetuity Growth4
1.50%
(in millions of euros) 2017 2018 2019 2020 2021
Sales
Comfort & Driving Assistance Systems 3677 4045 4450 4894 5384 5465
% Growth 10.0% 10.0% 10.0% 10.0% 10.0%
Powertrain Systems 4532 5166 5889 6714 7654 7768
% Growth 14.0% 14.0% 14.0% 14.0% 14.0%
Thermal Systems 4946 5292 5662 6058 6483 6580
% Growth 7.0% 7.0% 7.0% 7.0% 7.0%
Visibility Systems 5000 5499 6049 6654 7320 7430
% Growth 10.0% 10.0% 10.0% 10.0% 10.0%
Other 36 39 42 45 48 49
% Growth 7.2% 7.2% 7.2% 7.2% 7.2%
Total sales 18190 20041 22092 24366 26888 27291
Terminal Value
Forecast
(in millions of euros) 2017 2018 2019 2020 2021
Total sales 18190 20041 22092 24366 26888 27291
Cost of sales
Raw materials consumed -10649 -11733 -12933 -14264 -15741 -15977
% ofTotal Sales 58.54% 58.54% 58.54% 58.54% 58.54%
Labor -2160 -2363 -2585 -2828 -3093 -3139
% ofTotal Sales 11.88% 11.79% 11.70% 11.60% 11.50%
Direct production costs and production overheads -1495 -1648 -1816 -2003 -2210 -2244
% ofTotal Sales 8.22% 8.22% 8.22% 8.22% 8.22%
Depreciation and amortization -531 -585 -645 -711 -785 -796
% ofTotal Sales 2.92% 2.92% 2.92% 2.92% 2.92%
Total cost of sales -14836 -16328 -17979 -19806 -21829 -22157
Gross margin 3355 3713 4113 4560 5059 5135
Gross margin as % oftotal sales 18.44% 18.53% 18.62% 18.71% 18.81%
Research and Development expenditure, net -1091 -1202 -1326 -1462 -1613 -1637
% ofTotal Sales 6.00% 6.00% 6.00% 6.00% 6.00%
Selling expenses -279 -302 -328 -355 -385 -390
% ofTotal Sales 1.54% 1.51% 1.48% 1.46% 1.43%
Administrative expenses -571 -612 -656 -703 -753 -764
% ofTotal Sales 3.14% 3.06% 2.97% 2.89% 2.80%
EBIT 1412 1596 1803 2040 2308 2343
EBITmargin as % oftotal sales 7.76% 7.96% 8.16% 8.37% 8.58%
Terminal Value
Forecast
Report by Johan NDONG
Stock valuation
(in millions of euros) 2017 2018 2019 2020 2021
Total sales 18190 20041 22092 24366 26888 27291
Gross margin 3355 3713 4113 4560 5059 5135
EBIT 1412 1596 1803 2040 2308 2343
Taxes -353 -399 -451 -510 -577 -586
EBIT after taxes 1059 1196 1352 1529 1731 1757
Depreciation & Amortization 805 887 978 1079 1190 1208
Change in Working capital 79 87 96 106 116 118
Capex -1091 -1202 -1326 -1462 -1613 -1637
% ofTotal Sales 6.00% 6.00% 6.00% 6.00% 6.00%
Cash Flow to Equity 852 968 1100 1252 1424 19475
Discount Factor 0.9578 0.8794 0.8073 0.7412 0.6805 0.6805
Present Value 816 851 888 928 969 13253
Terminal Value
Forecast
Total Entreprise Value 17705
Cash & Short Term Investments 2359
Total Financial Debt -2916
Total Minority Interest -236
Debt Equiv. of Unfunded Proj. Benefit Obligation -984
Market Capitalization 15928
Shares Outstanding 239
Stock Value 66.60
Report by Johan NDONG
APPENDIX 4 – TRADING MULTIPLE VALUATION
Data from Capital-IQ
EV / EBITDA ratios automotive suppliers
(in millions of euros) Country Currency 2017 2018 2019 2017 2018 2019
<<European automotive suppliers>>
Valeo France EUR 15 806 1 831 8.6x 2 490 2 812 3 104 6.3x 5.6x 5.1x
Continental Germany EUR 44 517 6 101 7.3x 6 961 7 490 7 953 6.4x 5.9x 5.6x
Faurecia France EUR 6 992 1 360 5.1x 1 756 1 873 1 967 4.0x 3.7x 3.6x
Schaeffler Germany EUR 13 355 2 363 5.7x 2 485 2 646 2 800 5.4x 5.0x 4.8x
Hella Germany EUR 5 332 797 6.7x 887 983 1 070 6.0x 5.4x 5.0x
<<Asian automotive suppliers>>
Denso Japan JPY 3 593 861 573 816 6.3x 607 070 646 319 688 582 5.9x 5.6x 5.2x
Hyundai Mobis South Korea KRW 18 515 323 3 550 090 5.2x 3 589 880 4 014 407 4 282 891 5.2x 4.6x 4.3x
Aisin Seiki Japan JPY 2 289 721 418 782 5.5x 463 076 493 745 527 730 4.9x 4.6x 4.3x
Toyota Boshoku Japan JPY 423 419 109 256 3.9x 10⁶ 457 112 275 116 217 4.0x 3.8x 3.6x
Jtekt Japan JPY 787 451 133 553 5.9x 138 771 147 943 161 900 5.7x 5.3x 4.9x
Koito Japan JPY 829 250 124 245 6.7x 133 129 142 728 152 901 6.2x 5.8x 5.4x
<<American automotive suppliers>>
Magna International Canada CAD 27 032 5 011 5.4x 5 253 5 575 5 975 5.1x 4.8x 4.5x
Johnson Controls USA USD 56 583 3 510 16.1x 4 839 5 206 5 614 11.7x 10.9x 10.1x
Cummins USA USD 27 549 2 310 11.9x 2 800 2 978 3 214 9.8x 9.3x 8.6x
Lear USA USD 10 824 1 841 5.9x 2 026 2 091 2 199 5.3x 5.2x 4.9x
Delphi USA USD 28 268 2 979 9.5x 2 974 3 155 3 364 9.5x 9.0x 8.4x
Autoliv USA USD 10 503 1 257 8.4x 1 295 1 417 1 581 8.1x 7.4x 6.6x
Tenneco USA USD 4 564 763 6.0x 882 949 1 000 5.2x 4.8x 4.6x
BorgWarner USA USD 11 190 1 511 7.4x 1 548 1 638 1 694 7.2x 6.8x 6.6x
Dana USA USD 5 245 612 8.6x 737 791 862 7.1x 6.6x 6.1x
Min 3.9x 4.0x 3.7x 3.6x
Max 16.1x 11.7x 10.9x 10.1x
Peer average 7.2x 6.3x 5.9x 5.5x
Std. Dev. 2.8x 1.6x 1.5x 1.3x
Peer median 6.3x 5.9x 5.4x 5.0x
Peer lower quartile 5.6x 5.2x 4.8x 4.5x
Peer upper quartile 7.9x 7.2x 6.7x 6.3x
Std. Dev. % 38% 25% 25% 24%
EV / EBITDAEBITDA
EV EBITDA 2016
EV / EBITDA
(2016)
Report by Johan NDONG
EV / EBITDA analysis
Stock valuation
2017 2018 2019
Average EV 15 690 16 541 17 054
Median EV 14 738 15 247 15 461
Lower quartile EV 12 861 13 575 14 103
Upper quartile EV 17 851 18 921 19 699
Weight 0.50 0.33 0.17
(in millions except stock price) Average Low High
Total Entreprise Value 16 201 13 306 18 516
Cash & Short Term Investments 2 364 2 364 2 364
Total Debt -2 916 -2 916 -2 916
Total Minority Interest -236 -236 -236
Debt Equiv. of Unfunded Proj. Benefit Obligation -984 -984 -984
Market Capitalization 14 429 11 534 16 744
Shares Outstanding 239 239 239
Stock Value 60.34 48.23 70.02
Valeo
Year
Report by Johan NDONG
APPENDIX 5 – CONSOLIDATED STATEMENT OF INCOME
(Extract from Valeo annual report)
Report by Johan NDONG
APPENDIX 6 – CONSOLIDATED STATEMENT OF FINANCIAL POSITION
(Extract from Valeo annual report)
Report by Johan NDONG
APPENDIX 7 – CONSOLIDATED STATEMENT OF CASH FLOWS
(Extract from Valeo annual report)

More Related Content

What's hot

Barco case study team a final
Barco case study team a finalBarco case study team a final
Barco case study team a finalSanmeet Dhokay
 
Mountain Man Brewing Company: Case Analysis
Mountain Man Brewing Company: Case AnalysisMountain Man Brewing Company: Case Analysis
Mountain Man Brewing Company: Case AnalysisShashank Srivastava
 
D.Light Design Case Study Ananlysis
D.Light Design Case Study AnanlysisD.Light Design Case Study Ananlysis
D.Light Design Case Study AnanlysisCherry Malhotra
 
Final Presentation on Procter and Gamble
Final Presentation on Procter and GambleFinal Presentation on Procter and Gamble
Final Presentation on Procter and GambleRishiraj Das
 
Brannigan Foods Case Study Exercise
Brannigan Foods Case Study ExerciseBrannigan Foods Case Study Exercise
Brannigan Foods Case Study ExerciseJuan Manuel Restrepo
 
Nestle Refrigerated Foods: Contadina Pasta & Pizza (A) - Case Analysis
Nestle Refrigerated Foods: Contadina Pasta & Pizza (A) - Case AnalysisNestle Refrigerated Foods: Contadina Pasta & Pizza (A) - Case Analysis
Nestle Refrigerated Foods: Contadina Pasta & Pizza (A) - Case AnalysisNikhil Saraf
 
Marketing Management of P&G India by AKSHAY GAUTAM
Marketing Management of P&G India by AKSHAY GAUTAMMarketing Management of P&G India by AKSHAY GAUTAM
Marketing Management of P&G India by AKSHAY GAUTAMAkshay Gautam
 
p&g marketing strategies
p&g marketing strategiesp&g marketing strategies
p&g marketing strategiesritulakhotia
 
Mark strat simulation( firm presentation)
Mark strat simulation( firm presentation)Mark strat simulation( firm presentation)
Mark strat simulation( firm presentation)Evelyne Otto
 
Pillsbury cookie challenge wac
Pillsbury cookie challenge   wacPillsbury cookie challenge   wac
Pillsbury cookie challenge wacSyeda Zauwia Riaz
 
Strategic Review and Analysis of Egon Zehnder
Strategic Review and Analysis of Egon ZehnderStrategic Review and Analysis of Egon Zehnder
Strategic Review and Analysis of Egon ZehnderMathan Anto Marshine
 
Chateau margaux - Marketing Analysis
Chateau margaux - Marketing AnalysisChateau margaux - Marketing Analysis
Chateau margaux - Marketing Analysistommaso alchidi
 
Aqualisa Quartz - Simply A Better Shower (HBR Case Study)
Aqualisa Quartz - Simply A Better Shower (HBR Case Study)Aqualisa Quartz - Simply A Better Shower (HBR Case Study)
Aqualisa Quartz - Simply A Better Shower (HBR Case Study)Arjun Parekh
 
Harrah's Entertainment, Inc. Case Analysis
Harrah's Entertainment, Inc. Case AnalysisHarrah's Entertainment, Inc. Case Analysis
Harrah's Entertainment, Inc. Case Analysismbartugs
 

What's hot (20)

Barco case study team a final
Barco case study team a finalBarco case study team a final
Barco case study team a final
 
Mountain Man Brewing Company: Case Analysis
Mountain Man Brewing Company: Case AnalysisMountain Man Brewing Company: Case Analysis
Mountain Man Brewing Company: Case Analysis
 
D.Light Design Case Study Ananlysis
D.Light Design Case Study AnanlysisD.Light Design Case Study Ananlysis
D.Light Design Case Study Ananlysis
 
Markstrat ppt
Markstrat ppt Markstrat ppt
Markstrat ppt
 
Final Presentation on Procter and Gamble
Final Presentation on Procter and GambleFinal Presentation on Procter and Gamble
Final Presentation on Procter and Gamble
 
Tru earth case study
Tru earth case studyTru earth case study
Tru earth case study
 
Brannigan Foods Case Study Exercise
Brannigan Foods Case Study ExerciseBrannigan Foods Case Study Exercise
Brannigan Foods Case Study Exercise
 
P&G
P&GP&G
P&G
 
Chase Sapphire Case Study
Chase Sapphire Case StudyChase Sapphire Case Study
Chase Sapphire Case Study
 
Nestle Refrigerated Foods: Contadina Pasta & Pizza (A) - Case Analysis
Nestle Refrigerated Foods: Contadina Pasta & Pizza (A) - Case AnalysisNestle Refrigerated Foods: Contadina Pasta & Pizza (A) - Case Analysis
Nestle Refrigerated Foods: Contadina Pasta & Pizza (A) - Case Analysis
 
Marketing Management of P&G India by AKSHAY GAUTAM
Marketing Management of P&G India by AKSHAY GAUTAMMarketing Management of P&G India by AKSHAY GAUTAM
Marketing Management of P&G India by AKSHAY GAUTAM
 
p&g marketing strategies
p&g marketing strategiesp&g marketing strategies
p&g marketing strategies
 
The Fashion Channel
The Fashion ChannelThe Fashion Channel
The Fashion Channel
 
Mark strat simulation( firm presentation)
Mark strat simulation( firm presentation)Mark strat simulation( firm presentation)
Mark strat simulation( firm presentation)
 
Managing up
Managing upManaging up
Managing up
 
Pillsbury cookie challenge wac
Pillsbury cookie challenge   wacPillsbury cookie challenge   wac
Pillsbury cookie challenge wac
 
Strategic Review and Analysis of Egon Zehnder
Strategic Review and Analysis of Egon ZehnderStrategic Review and Analysis of Egon Zehnder
Strategic Review and Analysis of Egon Zehnder
 
Chateau margaux - Marketing Analysis
Chateau margaux - Marketing AnalysisChateau margaux - Marketing Analysis
Chateau margaux - Marketing Analysis
 
Aqualisa Quartz - Simply A Better Shower (HBR Case Study)
Aqualisa Quartz - Simply A Better Shower (HBR Case Study)Aqualisa Quartz - Simply A Better Shower (HBR Case Study)
Aqualisa Quartz - Simply A Better Shower (HBR Case Study)
 
Harrah's Entertainment, Inc. Case Analysis
Harrah's Entertainment, Inc. Case AnalysisHarrah's Entertainment, Inc. Case Analysis
Harrah's Entertainment, Inc. Case Analysis
 

Similar to Analysis and Valuation of Valeo SA - July 2017

“Comparative analysis of consumer preference between Hyundai’s i-10 and Marut...
“Comparative analysis of consumer preference between Hyundai’s i-10 and Marut...“Comparative analysis of consumer preference between Hyundai’s i-10 and Marut...
“Comparative analysis of consumer preference between Hyundai’s i-10 and Marut...BHOMA RAM
 
Renault-Nissan Strategic Alliance, Case Analysis
Renault-Nissan Strategic Alliance, Case AnalysisRenault-Nissan Strategic Alliance, Case Analysis
Renault-Nissan Strategic Alliance, Case AnalysisRamin Navvabpour
 
Strategic Analysis of TATA Motors with emphasison JLR acquisition
Strategic Analysis of TATA Motors with emphasison JLR acquisitionStrategic Analysis of TATA Motors with emphasison JLR acquisition
Strategic Analysis of TATA Motors with emphasison JLR acquisitionSIBASIS MOHAPATRA
 
Nomura Case Study Competition
Nomura Case Study CompetitionNomura Case Study Competition
Nomura Case Study CompetitionRajib Layek
 
Gabriel strategy report sp jain school of global management
Gabriel strategy report sp jain school of global managementGabriel strategy report sp jain school of global management
Gabriel strategy report sp jain school of global managementedwin john
 
MAWW Automotive Report - Nov 2016
MAWW Automotive Report - Nov 2016MAWW Automotive Report - Nov 2016
MAWW Automotive Report - Nov 2016Sang Kang
 
Smes in auto components
Smes in auto componentsSmes in auto components
Smes in auto componentsIJLT EMAS
 
Opportunities And Challenges in China’s Automotive Industry
Opportunities And Challenges in China’s Automotive IndustryOpportunities And Challenges in China’s Automotive Industry
Opportunities And Challenges in China’s Automotive IndustryIpsos Business Consulting
 
ARTIFICIAL INTELLIGENCE (AI) ENABLED TRANSPORTATION - DISRUPTING AND OPTIMIZI...
ARTIFICIAL INTELLIGENCE (AI) ENABLED TRANSPORTATION - DISRUPTING AND OPTIMIZI...ARTIFICIAL INTELLIGENCE (AI) ENABLED TRANSPORTATION - DISRUPTING AND OPTIMIZI...
ARTIFICIAL INTELLIGENCE (AI) ENABLED TRANSPORTATION - DISRUPTING AND OPTIMIZI...ANNATHOMAS89
 
AUTOMOTIVE TYRE INDUSTRY: RESTRATEGIZING DURING PANDEMIC
AUTOMOTIVE TYRE INDUSTRY: RESTRATEGIZING DURING PANDEMICAUTOMOTIVE TYRE INDUSTRY: RESTRATEGIZING DURING PANDEMIC
AUTOMOTIVE TYRE INDUSTRY: RESTRATEGIZING DURING PANDEMICShellyBhede
 
Automobile industry analysis
Automobile industry analysisAutomobile industry analysis
Automobile industry analysisUdayan Sikdar
 
BWA Report_April 2015_L.Tamakloe
BWA Report_April 2015_L.TamakloeBWA Report_April 2015_L.Tamakloe
BWA Report_April 2015_L.TamakloeLiana Tamakloe
 
Volkswagen Case _ Lâm Tiên Khải _ HSBC
Volkswagen Case _ Lâm Tiên Khải _ HSBCVolkswagen Case _ Lâm Tiên Khải _ HSBC
Volkswagen Case _ Lâm Tiên Khải _ HSBCKhải Tiên
 
Indian Auto Industry Analysis
Indian Auto Industry AnalysisIndian Auto Industry Analysis
Indian Auto Industry AnalysisNitesh Luthra
 
Country Analysis India With Special Reference To The Automobile Sector
Country Analysis  India With Special Reference To The Automobile SectorCountry Analysis  India With Special Reference To The Automobile Sector
Country Analysis India With Special Reference To The Automobile Sectoragarwalkhagesh
 
KPIT Technologies: Autonomous roadmap for growth; Retain buy - Prabhudas Lill...
KPIT Technologies: Autonomous roadmap for growth; Retain buy - Prabhudas Lill...KPIT Technologies: Autonomous roadmap for growth; Retain buy - Prabhudas Lill...
KPIT Technologies: Autonomous roadmap for growth; Retain buy - Prabhudas Lill...IndiaNotes.com
 

Similar to Analysis and Valuation of Valeo SA - July 2017 (20)

“Comparative analysis of consumer preference between Hyundai’s i-10 and Marut...
“Comparative analysis of consumer preference between Hyundai’s i-10 and Marut...“Comparative analysis of consumer preference between Hyundai’s i-10 and Marut...
“Comparative analysis of consumer preference between Hyundai’s i-10 and Marut...
 
Renault-Nissan Strategic Alliance, Case Analysis
Renault-Nissan Strategic Alliance, Case AnalysisRenault-Nissan Strategic Alliance, Case Analysis
Renault-Nissan Strategic Alliance, Case Analysis
 
Strategic Analysis of TATA Motors with emphasison JLR acquisition
Strategic Analysis of TATA Motors with emphasison JLR acquisitionStrategic Analysis of TATA Motors with emphasison JLR acquisition
Strategic Analysis of TATA Motors with emphasison JLR acquisition
 
Nomura Case Study Competition
Nomura Case Study CompetitionNomura Case Study Competition
Nomura Case Study Competition
 
Gabriel strategy report sp jain school of global management
Gabriel strategy report sp jain school of global managementGabriel strategy report sp jain school of global management
Gabriel strategy report sp jain school of global management
 
MAWW Automotive Report - Nov 2016
MAWW Automotive Report - Nov 2016MAWW Automotive Report - Nov 2016
MAWW Automotive Report - Nov 2016
 
Smes in auto components
Smes in auto componentsSmes in auto components
Smes in auto components
 
Opportunities And Challenges in China’s Automotive Industry
Opportunities And Challenges in China’s Automotive IndustryOpportunities And Challenges in China’s Automotive Industry
Opportunities And Challenges in China’s Automotive Industry
 
ARTIFICIAL INTELLIGENCE (AI) ENABLED TRANSPORTATION - DISRUPTING AND OPTIMIZI...
ARTIFICIAL INTELLIGENCE (AI) ENABLED TRANSPORTATION - DISRUPTING AND OPTIMIZI...ARTIFICIAL INTELLIGENCE (AI) ENABLED TRANSPORTATION - DISRUPTING AND OPTIMIZI...
ARTIFICIAL INTELLIGENCE (AI) ENABLED TRANSPORTATION - DISRUPTING AND OPTIMIZI...
 
AUTOMOTIVE TYRE INDUSTRY: RESTRATEGIZING DURING PANDEMIC
AUTOMOTIVE TYRE INDUSTRY: RESTRATEGIZING DURING PANDEMICAUTOMOTIVE TYRE INDUSTRY: RESTRATEGIZING DURING PANDEMIC
AUTOMOTIVE TYRE INDUSTRY: RESTRATEGIZING DURING PANDEMIC
 
Automobile industry analysis
Automobile industry analysisAutomobile industry analysis
Automobile industry analysis
 
BWA Report_April 2015_L.Tamakloe
BWA Report_April 2015_L.TamakloeBWA Report_April 2015_L.Tamakloe
BWA Report_April 2015_L.Tamakloe
 
Honda
HondaHonda
Honda
 
Volkswagen Case _ Lâm Tiên Khải _ HSBC
Volkswagen Case _ Lâm Tiên Khải _ HSBCVolkswagen Case _ Lâm Tiên Khải _ HSBC
Volkswagen Case _ Lâm Tiên Khải _ HSBC
 
Indian Auto Industry Analysis
Indian Auto Industry AnalysisIndian Auto Industry Analysis
Indian Auto Industry Analysis
 
Country Analysis India With Special Reference To The Automobile Sector
Country Analysis  India With Special Reference To The Automobile SectorCountry Analysis  India With Special Reference To The Automobile Sector
Country Analysis India With Special Reference To The Automobile Sector
 
Final tyre
Final tyreFinal tyre
Final tyre
 
2016-Auto-Trends
2016-Auto-Trends2016-Auto-Trends
2016-Auto-Trends
 
Research report
Research reportResearch report
Research report
 
KPIT Technologies: Autonomous roadmap for growth; Retain buy - Prabhudas Lill...
KPIT Technologies: Autonomous roadmap for growth; Retain buy - Prabhudas Lill...KPIT Technologies: Autonomous roadmap for growth; Retain buy - Prabhudas Lill...
KPIT Technologies: Autonomous roadmap for growth; Retain buy - Prabhudas Lill...
 

Recently uploaded

Quarter 4- Module 3 Principles of Marketing
Quarter 4- Module 3 Principles of MarketingQuarter 4- Module 3 Principles of Marketing
Quarter 4- Module 3 Principles of MarketingMaristelaRamos12
 
Bladex Earnings Call Presentation 1Q2024
Bladex Earnings Call Presentation 1Q2024Bladex Earnings Call Presentation 1Q2024
Bladex Earnings Call Presentation 1Q2024Bladex
 
How Automation is Driving Efficiency Through the Last Mile of Reporting
How Automation is Driving Efficiency Through the Last Mile of ReportingHow Automation is Driving Efficiency Through the Last Mile of Reporting
How Automation is Driving Efficiency Through the Last Mile of ReportingAggregage
 
Log your LOA pain with Pension Lab's brilliant campaign
Log your LOA pain with Pension Lab's brilliant campaignLog your LOA pain with Pension Lab's brilliant campaign
Log your LOA pain with Pension Lab's brilliant campaignHenry Tapper
 
OAT_RI_Ep19 WeighingTheRisks_Apr24_TheYellowMetal.pptx
OAT_RI_Ep19 WeighingTheRisks_Apr24_TheYellowMetal.pptxOAT_RI_Ep19 WeighingTheRisks_Apr24_TheYellowMetal.pptx
OAT_RI_Ep19 WeighingTheRisks_Apr24_TheYellowMetal.pptxhiddenlevers
 
letter-from-the-chair-to-the-fca-relating-to-british-steel-pensions-scheme-15...
letter-from-the-chair-to-the-fca-relating-to-british-steel-pensions-scheme-15...letter-from-the-chair-to-the-fca-relating-to-british-steel-pensions-scheme-15...
letter-from-the-chair-to-the-fca-relating-to-british-steel-pensions-scheme-15...Henry Tapper
 
VIP Call Girls in Saharanpur Aarohi 8250192130 Independent Escort Service Sah...
VIP Call Girls in Saharanpur Aarohi 8250192130 Independent Escort Service Sah...VIP Call Girls in Saharanpur Aarohi 8250192130 Independent Escort Service Sah...
VIP Call Girls in Saharanpur Aarohi 8250192130 Independent Escort Service Sah...Suhani Kapoor
 
Call Girls In Yusuf Sarai Women Seeking Men 9654467111
Call Girls In Yusuf Sarai Women Seeking Men 9654467111Call Girls In Yusuf Sarai Women Seeking Men 9654467111
Call Girls In Yusuf Sarai Women Seeking Men 9654467111Sapana Sha
 
Instant Issue Debit Cards - School Designs
Instant Issue Debit Cards - School DesignsInstant Issue Debit Cards - School Designs
Instant Issue Debit Cards - School Designsegoetzinger
 
Chapter 2.ppt of macroeconomics by mankiw 9th edition
Chapter 2.ppt of macroeconomics by mankiw 9th editionChapter 2.ppt of macroeconomics by mankiw 9th edition
Chapter 2.ppt of macroeconomics by mankiw 9th editionMuhammadHusnain82237
 
(DIYA) Bhumkar Chowk Call Girls Just Call 7001035870 [ Cash on Delivery ] Pun...
(DIYA) Bhumkar Chowk Call Girls Just Call 7001035870 [ Cash on Delivery ] Pun...(DIYA) Bhumkar Chowk Call Girls Just Call 7001035870 [ Cash on Delivery ] Pun...
(DIYA) Bhumkar Chowk Call Girls Just Call 7001035870 [ Cash on Delivery ] Pun...ranjana rawat
 
Best VIP Call Girls Noida Sector 18 Call Me: 8448380779
Best VIP Call Girls Noida Sector 18 Call Me: 8448380779Best VIP Call Girls Noida Sector 18 Call Me: 8448380779
Best VIP Call Girls Noida Sector 18 Call Me: 8448380779Delhi Call girls
 
(ANIKA) Budhwar Peth Call Girls Just Call 7001035870 [ Cash on Delivery ] Pun...
(ANIKA) Budhwar Peth Call Girls Just Call 7001035870 [ Cash on Delivery ] Pun...(ANIKA) Budhwar Peth Call Girls Just Call 7001035870 [ Cash on Delivery ] Pun...
(ANIKA) Budhwar Peth Call Girls Just Call 7001035870 [ Cash on Delivery ] Pun...ranjana rawat
 
VIP Call Girls LB Nagar ( Hyderabad ) Phone 8250192130 | ₹5k To 25k With Room...
VIP Call Girls LB Nagar ( Hyderabad ) Phone 8250192130 | ₹5k To 25k With Room...VIP Call Girls LB Nagar ( Hyderabad ) Phone 8250192130 | ₹5k To 25k With Room...
VIP Call Girls LB Nagar ( Hyderabad ) Phone 8250192130 | ₹5k To 25k With Room...Suhani Kapoor
 
Q3 2024 Earnings Conference Call and Webcast Slides
Q3 2024 Earnings Conference Call and Webcast SlidesQ3 2024 Earnings Conference Call and Webcast Slides
Q3 2024 Earnings Conference Call and Webcast SlidesMarketing847413
 
(TANVI) Call Girls Nanded City ( 7001035870 ) HI-Fi Pune Escorts Service
(TANVI) Call Girls Nanded City ( 7001035870 ) HI-Fi Pune Escorts Service(TANVI) Call Girls Nanded City ( 7001035870 ) HI-Fi Pune Escorts Service
(TANVI) Call Girls Nanded City ( 7001035870 ) HI-Fi Pune Escorts Serviceranjana rawat
 
Russian Call Girls In Gtb Nagar (Delhi) 9711199012 💋✔💕😘 Naughty Call Girls Se...
Russian Call Girls In Gtb Nagar (Delhi) 9711199012 💋✔💕😘 Naughty Call Girls Se...Russian Call Girls In Gtb Nagar (Delhi) 9711199012 💋✔💕😘 Naughty Call Girls Se...
Russian Call Girls In Gtb Nagar (Delhi) 9711199012 💋✔💕😘 Naughty Call Girls Se...shivangimorya083
 
Independent Lucknow Call Girls 8923113531WhatsApp Lucknow Call Girls make you...
Independent Lucknow Call Girls 8923113531WhatsApp Lucknow Call Girls make you...Independent Lucknow Call Girls 8923113531WhatsApp Lucknow Call Girls make you...
Independent Lucknow Call Girls 8923113531WhatsApp Lucknow Call Girls make you...makika9823
 

Recently uploaded (20)

Quarter 4- Module 3 Principles of Marketing
Quarter 4- Module 3 Principles of MarketingQuarter 4- Module 3 Principles of Marketing
Quarter 4- Module 3 Principles of Marketing
 
Bladex Earnings Call Presentation 1Q2024
Bladex Earnings Call Presentation 1Q2024Bladex Earnings Call Presentation 1Q2024
Bladex Earnings Call Presentation 1Q2024
 
How Automation is Driving Efficiency Through the Last Mile of Reporting
How Automation is Driving Efficiency Through the Last Mile of ReportingHow Automation is Driving Efficiency Through the Last Mile of Reporting
How Automation is Driving Efficiency Through the Last Mile of Reporting
 
Log your LOA pain with Pension Lab's brilliant campaign
Log your LOA pain with Pension Lab's brilliant campaignLog your LOA pain with Pension Lab's brilliant campaign
Log your LOA pain with Pension Lab's brilliant campaign
 
OAT_RI_Ep19 WeighingTheRisks_Apr24_TheYellowMetal.pptx
OAT_RI_Ep19 WeighingTheRisks_Apr24_TheYellowMetal.pptxOAT_RI_Ep19 WeighingTheRisks_Apr24_TheYellowMetal.pptx
OAT_RI_Ep19 WeighingTheRisks_Apr24_TheYellowMetal.pptx
 
letter-from-the-chair-to-the-fca-relating-to-british-steel-pensions-scheme-15...
letter-from-the-chair-to-the-fca-relating-to-british-steel-pensions-scheme-15...letter-from-the-chair-to-the-fca-relating-to-british-steel-pensions-scheme-15...
letter-from-the-chair-to-the-fca-relating-to-british-steel-pensions-scheme-15...
 
VIP Call Girls in Saharanpur Aarohi 8250192130 Independent Escort Service Sah...
VIP Call Girls in Saharanpur Aarohi 8250192130 Independent Escort Service Sah...VIP Call Girls in Saharanpur Aarohi 8250192130 Independent Escort Service Sah...
VIP Call Girls in Saharanpur Aarohi 8250192130 Independent Escort Service Sah...
 
Call Girls In Yusuf Sarai Women Seeking Men 9654467111
Call Girls In Yusuf Sarai Women Seeking Men 9654467111Call Girls In Yusuf Sarai Women Seeking Men 9654467111
Call Girls In Yusuf Sarai Women Seeking Men 9654467111
 
Instant Issue Debit Cards - School Designs
Instant Issue Debit Cards - School DesignsInstant Issue Debit Cards - School Designs
Instant Issue Debit Cards - School Designs
 
Monthly Economic Monitoring of Ukraine No 231, April 2024
Monthly Economic Monitoring of Ukraine No 231, April 2024Monthly Economic Monitoring of Ukraine No 231, April 2024
Monthly Economic Monitoring of Ukraine No 231, April 2024
 
Chapter 2.ppt of macroeconomics by mankiw 9th edition
Chapter 2.ppt of macroeconomics by mankiw 9th editionChapter 2.ppt of macroeconomics by mankiw 9th edition
Chapter 2.ppt of macroeconomics by mankiw 9th edition
 
(DIYA) Bhumkar Chowk Call Girls Just Call 7001035870 [ Cash on Delivery ] Pun...
(DIYA) Bhumkar Chowk Call Girls Just Call 7001035870 [ Cash on Delivery ] Pun...(DIYA) Bhumkar Chowk Call Girls Just Call 7001035870 [ Cash on Delivery ] Pun...
(DIYA) Bhumkar Chowk Call Girls Just Call 7001035870 [ Cash on Delivery ] Pun...
 
Best VIP Call Girls Noida Sector 18 Call Me: 8448380779
Best VIP Call Girls Noida Sector 18 Call Me: 8448380779Best VIP Call Girls Noida Sector 18 Call Me: 8448380779
Best VIP Call Girls Noida Sector 18 Call Me: 8448380779
 
(ANIKA) Budhwar Peth Call Girls Just Call 7001035870 [ Cash on Delivery ] Pun...
(ANIKA) Budhwar Peth Call Girls Just Call 7001035870 [ Cash on Delivery ] Pun...(ANIKA) Budhwar Peth Call Girls Just Call 7001035870 [ Cash on Delivery ] Pun...
(ANIKA) Budhwar Peth Call Girls Just Call 7001035870 [ Cash on Delivery ] Pun...
 
VIP Call Girls LB Nagar ( Hyderabad ) Phone 8250192130 | ₹5k To 25k With Room...
VIP Call Girls LB Nagar ( Hyderabad ) Phone 8250192130 | ₹5k To 25k With Room...VIP Call Girls LB Nagar ( Hyderabad ) Phone 8250192130 | ₹5k To 25k With Room...
VIP Call Girls LB Nagar ( Hyderabad ) Phone 8250192130 | ₹5k To 25k With Room...
 
Q3 2024 Earnings Conference Call and Webcast Slides
Q3 2024 Earnings Conference Call and Webcast SlidesQ3 2024 Earnings Conference Call and Webcast Slides
Q3 2024 Earnings Conference Call and Webcast Slides
 
(TANVI) Call Girls Nanded City ( 7001035870 ) HI-Fi Pune Escorts Service
(TANVI) Call Girls Nanded City ( 7001035870 ) HI-Fi Pune Escorts Service(TANVI) Call Girls Nanded City ( 7001035870 ) HI-Fi Pune Escorts Service
(TANVI) Call Girls Nanded City ( 7001035870 ) HI-Fi Pune Escorts Service
 
Commercial Bank Economic Capsule - April 2024
Commercial Bank Economic Capsule - April 2024Commercial Bank Economic Capsule - April 2024
Commercial Bank Economic Capsule - April 2024
 
Russian Call Girls In Gtb Nagar (Delhi) 9711199012 💋✔💕😘 Naughty Call Girls Se...
Russian Call Girls In Gtb Nagar (Delhi) 9711199012 💋✔💕😘 Naughty Call Girls Se...Russian Call Girls In Gtb Nagar (Delhi) 9711199012 💋✔💕😘 Naughty Call Girls Se...
Russian Call Girls In Gtb Nagar (Delhi) 9711199012 💋✔💕😘 Naughty Call Girls Se...
 
Independent Lucknow Call Girls 8923113531WhatsApp Lucknow Call Girls make you...
Independent Lucknow Call Girls 8923113531WhatsApp Lucknow Call Girls make you...Independent Lucknow Call Girls 8923113531WhatsApp Lucknow Call Girls make you...
Independent Lucknow Call Girls 8923113531WhatsApp Lucknow Call Girls make you...
 

Analysis and Valuation of Valeo SA - July 2017

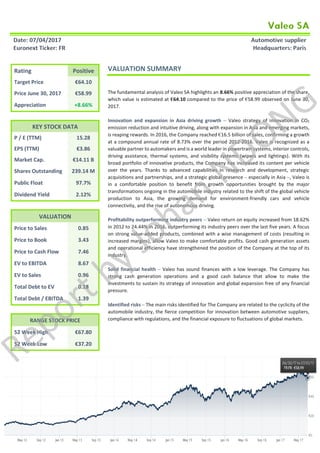
  • 1. Report by Johan NDONG Rating Positive Target Price €64.10 Price June 30, 2017 €58.99 Appreciation +8.66% KEY STOCK DATA P / E (TTM) 15.28 EPS (TTM) €3.86 Market Cap. €14.11 B Shares Outstanding 239.14 M Public Float 97.7% Dividend Yield 2.12% VALUATION Price to Sales 0.85 Price to Book 3.43 Price to Cash Flow 7.46 EV to EBITDA 8.67 EV to Sales 0.96 Total Debt to EV 0.18 Total Debt / EBITDA 1.39 RANGE STOCK PRICE 52 Week High €67.80 52 Week Low €37.20 VALUATION SUMMARY The fundamental analysis of Valeo SA highlights an 8.66% positive appreciation of the share, which value is estimated at €64.10 compared to the price of €58.99 observed on June 30, 2017. Innovation and expansion in Asia driving growth – Valeo strategy of innovation in CO2 emission reduction and intuitive driving, along with expansion in Asia and emerging markets, is reaping rewards. In 2016, the Company reached €16.5 billion of sales, confirming a growth at a compound annual rate of 8.73% over the period 2012-2016. Valeo is recognized as a valuable partner to automakers and is among the world leaders in powertrain systems, interior controls, driving assistance, thermal systems, and visibility systems (wipers and lightings). With its broad portfolio of innovative products, the Company has increased its content per vehicle over the years. Thanks to advanced capabilities in research and development, strategic acquisitions and partnerships, and a strategic global presence – especially in Asia –, Valeo is in a comfortable position to benefit from growth opportunities brought by the major transformations ongoing in the automobile industry related to the shift of the global vehicle production to Asia, the growing demand for environment-friendly cars and vehicle connectivity, and the rise of autonomous driving. Profitability outperforming industry peers – Valeo return on equity increased from 18.62% in 2012 to 24.44% in 2016, outperforming its industry peers over the last five years. A focus on strong value-added products, combined with a wise management of costs (resulting in increased margins), allow Valeo to make comfortable profits. Good cash generation assets and operational efficiency have strengthened the position of the Company at the top of its industry. Solid financial health – Valeo has sound finances with a low leverage. The Company has strong cash generation operations and a good cash balance that allow to make the investments to sustain its strategy of innovation and global expansion free of any financial pressure. Identified risks – The main risks identified for The Company are related to the cyclicity of the automobile industry, the fierce competition for innovation between automotive suppliers, compliance with regulations, and the financial exposure to fluctuations of global markets.
  • 2. Report by Johan NDONG DISCLAIMER This report is a personal research work based on the author’s analysis and appreciation of public information available at June 30, 2017. The report is not intended to be used as a professional recommendation or advice to invest in the presented stock, and the author declines responsibility for actions engaged on the basis of this document.
  • 3. Report by Johan NDONG COMPANY OVERVIEW Valeo is an automotive supplier that partners all automakers worldwide. The Company develops innovative products and systems that contribute to the reduction of CO2 emissions and to the development of intuitive driving. Activity Valeo operates through four Business Groups: Comfort & Driving Assistance, Powertrain Systems, Thermal Systems and Visibility Systems. Comfort & Driving Assistance Systems (20% of total sales in 2016). This Business Group develops sensor-based technologies for driving and parking assistance, short- and long-range connectivity systems, and HMI (Human-Machine Interfaces). Powertrain Systems (24% of total sales in 2016). This Business Group develops solutions for vehicle electrification, transmission automation, and engine cleaning. Thermal Systems (28% of total sales in 2016). This Business Group develops and manufactures HVAC units, air quality systems, and heating and air conditioning systems, as well as powertrain thermal energy management systems. Visibility Systems (28% of total sales in 2016). This Business Group designs internal and external lighting solutions, and wiper systems. Valeo provides aftermarket services through the Valeo Service Entity, which supplies original equipment spares to automakers and replacement parts to the independent aftermarket. The Company generates revenue primarily from original equipment sales. In 2016, original equipment accounted for 87% of total sales and aftermarket accounted for 10%. Sales by geographic area Valeo has a global footprint in 150 countries. In 2016, Europe accounted for 50% of total sales, split into 8% in France and 42% in others European countries (small part in Africa). Asia represented 27% of total sales, and North America accounted for 21%. Clients In 2016, Valeo clients included German automakers (30% of original equipment sales), Asian automakers (27%), US automakers (22%), and French automakers (15%). Valeo main clients are (in alphabetic order) BMW, BYD Auto, Chang’an Automobile, Chery, DAF, Daimler, Dongfeng Motor Corporation, Fiat Chrysler Automobiles, FAW, Ford Motor Company, Geely Group, General Motors Group, Great Wall, Honda, Hyundai Group, JAC, Mahindra & Mahindra, Maruti Suzuki, Mazda, Mitsubishi, PSA Peugeot Citroën, Renault-Nissan, SAI C, Subaru, Suzuki, Tata Group, Toyota, Volkswagen Group and Volvo Group. Share ownership As of March 21, 2017, Valeo has 239 143 131 shares outstanding. Lazard Asset Management LLC holds 5.04% of the share capital and 4.92% of the voting rights, and BlackRock Inc. holds 5.22% of the share capital and 5.10% of the voting rights. Executives and Board members Jacques Aschenbroich is the Chairman of the Board of Directors (appointed on February 16, 2016) and Chief Executive Officer (since March 20, 2009). Under his direction the Company reorganized during 2009-2010 to arrive at the current operating structure and market position.
  • 4. Report by Johan NDONG STRATEGIC ANALYSIS Valeo operates in the automotive equipment sector, which is part of the automobile industry. As a tier-one supplier, Valeo is at the high-end of the supply chain and sells its products directly to automakers. Industry overview and analysis Porter’s analysis (extended) Competitors – Competition in the industry is fierce with the globalisation of vehicle production, which requires suppliers to expand internationally to follow automakers and, hence, to compete with local suppliers. Moreover, innovation is a key factor of differentiation, which puts pressure on companies to invest in areas which may take time to bring success. New entrants – Barriers to entry are relatively high for traditional parts. Nonetheless, increased electronics and software in automobile-specific technologies have opened doors for Tech companies specialized in IT and artificial intelligence. Customers – Automotive suppliers are heavily dependent on automakers’ production levels and strategies. Yet, they have become more valuable partners with an increased value added on worldwide automobile manufacture (82% of value added in 2015 compared to 56% in 1985). Suppliers – Tier-one automotive suppliers have higher margins and more bargaining power over lower level suppliers. However, since raw materials account for a very substantial part of their cost structure, they are particularly sensitive to increase in prices. Substitutes – There is no real threat from substitutes but automotive suppliers must constantly adapt their products to meet automobile consumer demand and automaker needs, or face the risk of getting themselves into difficulty. Government – The automobile industry is subject to governmental regulations seeking to reduce vehicle emissions and improve vehicle safety. Furthermore, the industry has, in recent years, been the subject of enforced antitrust and competition laws in the United States and in Europe. Industry trends Global vehicle production shifting to Asia – Main driver of the automotive supplier sector, the global vehicle production is forecast to reach 114 million of units by 2021 from 93 million of vehicles produced in 2016 (according to a study by IHS Markit). Global production is currently shifting to Asia with over 50% of vehicles produced in the region since 2012, China representing 29% of the total production in 2016. This trend will accentuate in the future. Asia is forecast to account for 65% of the global production growth over the period 2017-2021, with China accounting for almost half of the total growth, while Europe and North America are forecast to experience low growths. Reduction of vehicle emissions – Across the world, growing concern over vehicle pollution and stringent government regulations on emissions drive the demand for more environment- friendly cars. As the demand grows, it is transforming the field of engine systems design toward technologies for fuel efficiency and electric vehicle. In mid-term projections, the share of traditional ICE systems (Internal Combustion Engine) is forecast to decrease rapidly, with fuel efficient ICE Stop-Start systems expected to emerge as the first alternative, while the share of electric vehicles is expected to increase smoothly without exceeding 10% until after 2021. More autonomous and connected cars – The third major transformation in the automobile industry is the revolution happening in the development of connected cars and autonomous driving. Current digitalization of the society increases the demand for advanced vehicle connectivity, and the need for safer cars and for improved driving experience fosters the
  • 5. Report by Johan NDONG demand for driving assistance systems. As the technologies progress, connected and partially autonomous cars are expected to gain prominence until fully autonomous cars become generalized in the long-term. Market size Sustained by the growth of the global vehicle production, the automotive lighting system market is forecast to reach €27 billion in 2022, growing at a CAGR of 6.8% between 2017 and 2022 (according to a report by Markets and Markets), the wiper system market is forecast to reach €10 billion by 2025 from an estimated value of €6.7 billion in 2016 (according to a study by Grand View Research), and the thermal system market is expected to reach €54 billion by 2022 from an estimated value of €29 billion in 2013 (according to a report by Transparency Market Research). Increasing demand for fuel efficiency and vehicle electrification are expected to grow the powertrain system market to €474 billion by 2020, knowing the market was estimated at €331 billion in 2013 (according to a report by Transparency Market Research). Following the trend in vehicle connectivity and autonomous driving, the global connected car market is forecast to reach €123 billion by 2022 from an estimated value of €41 billion in 2016 (data available on Statista), and the global advanced driver assistance system market is forecast to reach €38 billion by 2021, growing at a CAGR of 10.4% over 2017-2021 (according to a report by Research and Markets). Valeo strategy Strategy focus Valeo has axed its strategy on innovation for CO2 emission reduction and intuitive driving, and expansion in Asia and emerging markets. Valeo key differentiation is its positioning on strong value-added aesthetic, smart, and fuel-efficient systems matching perfectly the trends in automobile consumer demand and automaker needs, and from which the Company earns substantial revenue and makes comfortable margins. SWOT analysis Strengths – Valeo is among the world leaders in powertrain systems, parking and driving assistance, connectivity solutions, thermal systems, lighting solutions and visibility systems. The Company has advanced capabilities in Research & Development (1840 patents filed and 2700 development projects in 2016) and makes strategic acquisitions and partnerships thanks to which it delivers constant innovations in CO2 emission reduction and intuitive driving (50% of order intake in innovative products in 2016). Valeo has also a global footprint with a strong presence in Asia, especially in China. The Company has 59 plants (out of a total of 155), 12 development centers (out of total of 38) in Asia & Middle East/Oceania, and made 27% of its total sales in China in 2016. Weaknesses – The Company has limited sales compared to its main competitors (Bosch, Denso, Continental). In 2016, Valeo had €16.5 billion of sales compared to €43.9 billion for Bosch, €36.4 billion for Denso and €24.5 billion for Continental. Opportunities – Valeo focuses on solutions for powertrain electrification, hybridization and smart engines. Thanks to innovations in the three main technologies that will dominate tomorrow’s engine systems, the Company is on track to benefit from opportunities brought by the growing demand for greener cars. Moreover, thanks to innovations in connectivity and driving assistance, the Company has increased its content per car. Owning one of the broadest portfolio of sensor technologies of the industry constituting the foundation for automated driving (ultrasonic, radar, camera, and laser scanner), Valeo is in a comfortable position to benefit from opportunities related to autonomous cars. Finally, innovations in in-vehicle comfort (air conditioning systems, HMIs, visibility systems), and a strong presence in Asia ensure Valeo will benefit from the growth of the global vehicle production in all geographic areas, especially in Asia.
  • 6. Report by Johan NDONG Threats – Fierce competition between automotive suppliers and a slowing growth in China (the Company primary growth market) constitute the main obstacles to Valeo strategy. Latest significant events Valeo will further enforce its position as a leader in automatic cars with the launch of the joint venture Valeo-KAPEC with Pyeong Hwa (specialized in transmission coupling) and the acquisition of FTE Automotive (specialized in transmission actuators), two operations forecast to bring additional sales of €2 billion in 2021. In January 2017, Valeo announced the takeover of Ichikoh (specialized in lighting solutions), an operation that will strengthen the position of the Company as a world leader in lighting systems. In 2016, Valeo launched a joint venture with Siemens eAutomotive to develop products for vehicle electrification. This joint venture announces positive perspectives with already €1.6 billion order intake since its creation.
  • 7. Report by Johan NDONG FINANCIAL ANALYSIS The financial analysis of the Company was done over the period 2012-2016, in comparison with the performance of industry peers. Data analysed are based on extract from Capital-IQ. A table summarizing this analysis is presented in Appendix-2. Peer comparable Valeo peers are European, American and Asian automotive suppliers that develop products for powertrain systems, smart vehicle, interior controls & electronic systems, thermal systems, wipers systems, or lighting systems. The selected companies have a significant part of their business in automotive equipment (more than 45% of total sales), operate in the three major markets (Europe, America and Asia), and make at least €5.0 billion of sales. Appendix-1 provides a classification of Valeo and its peers with regard to the sales achieved in 2016. Sales analysis In 2016, Valeo sales reached €16.5 billion, which represented a €4.8 billion increase from 2012 and a CAGR (Compound Annual Growth Rate) of 8.73% over the period 2012-2016. Regarding the performance of the Business Groups, sales of Visibility Systems grew at a CAGR of 12.60%, sales of Comfort & Driving Assistance Systems grew at a CAGR of 9.50%, sales of Thermal Systems grew at a CAGR of 8.25%, and sales of Powertrain Systems grew a CAGR of 5.10%. In terms of geography, sales in North America grew at a CAGR of 18.00%, sales in Asia grew at a CAGR of 14.38%, and sales in Europe grew at a CAGR of 5.45%. Over 2012-2016, Valeo sales growth outperformed the peers which achieved an average CAGR of 5.71%. Costs analysis In 2016, Valeo had an EBITDA of €1.8 billion and an EBIT of €1.2 billion. Gross margin – Between 2012 and 2016, Valeo gross margin increased from 16.57% to 18.28%. Major source of expense, cost of raw materials averaged 58.54% of total sales. Also at a stable level, depreciation and amortization represented on average 2.92% of total sales. Improvement of the gross margin came from a decrease of labor costs (from 13.22% of total sales in 2012 to 11.96% in 2016) and a decrease of direct production costs and production overheads (from 8.58% of total sales in 2014 to 8.22% in 2016). Compared to the peers, Valeo had a higher gross margin all the years between 2012 and 2016 except in 2014. Over 2012- 2016, Valeo average gross margin was 17.42% compared to 17.25% for the peers. EBITDA and EBIT margins – Between 2012 and 2016, Valeo EBITDA margin increased from 9.39% to 11.08%, and EBIT margin increased from 5.98% to 7.66%. Regarding EBIT margin, selling expense decreased from 1.67% of total sales in 2012 to 1.56% in 2016, administrative expense decreased from 3.65% of total sales in 2012 to 3.23% in 2016, and net expense in research and development increased from 4.99% of total sales in 2012 to 5.70% in 2016 (reflecting Valeo strategy of innovation). Contrary to gross margin, over 2012-2016, Valeo had lower EBITDA margin than its peers. The Company average EBITDA margin was 10.20% compared to 10.39% for the peers. Profitability Return on equity – Return on equity increased from 18.62% in 2012 to 24.44% in 2016. The Company recorded an average return on equity of 21.56% over 2012-2016, a performance above the peer average return on equity of 18.51%. During the last four years, Valeo ranked in the upper quartile among the peers. Return on capital – Between 2012 and 2016, Valeo return on capital increased from 10.64% to 12.42%. Over the period, the Company average return on capital stood at 11.63%, a result above the average of the peer return on capital which stood at 9.96%.
  • 8. Report by Johan NDONG Return on assets – Valeo return on assets increased from 5.03% in 2012 to 6.13% in 2016. During the last two years, with returns on assets of respectively 6.08% in 2015 and 6.13% in 2016, Valeo outperformed the peers which achieved returns of respectively 5.86% and 5.98%. Operating efficiency Over 2012-2016, Valeo had an average asset turnover of 1.33, below the average of 1.43 of the peers (but above the median of 1.31), outlining a possible area of improvement. However, the Company was more efficient than the peers regarding fixed asset turnover (average ratio of 5.65 compared to 5.52 for the peers) and inventory turnover (average ratio of 11.74 compared to 10.87 for the peers). Finally, Valeo had an average operating cash flow to assets ratio of 0.13, above the average ratio of 0.10 of the peers, which shows the better cash generation assets of the Company. Liquidity Valeo current ratio decreased from 1.10 in 2012 to 0.99 in 2015 before it was re-established at 1.05 in 2016. Over 2012-2016, the level of the Company current ratio indicated current assets were sufficient to cover current liabilities but Valeo average ratio of 1.05 was below the average ratio of 1.54 of the peers. Not surprisingly, Valeo had a 0.74 average quick ratio, below the average ratio of 1.05 of the peers. However, the Company had an average operating cash flow to current liabilities ratio of 2.16, above the 1.61 average ratio of the peers, thanks to strong cash generation operations. Solvency Valeo has a net debt to market capitalization ratio below 5% since 2014. The total debt of the Company was €2.9 billion at December 31, 2016, compensated by a cash balance of €2.4 billion. Over the period 2012-2016, Valeo had an average total debt to assets ratio of 0.20, a figure in line with industry practice, the peers having an average ratio of 0.20 as well. The Company had an average total debt to EBITDA ratio of 1.54, which is just below the average ratio of 1.62 for the peers but above the median ratio of 1.31. Valeo stands out from its peers with its high operating cash flow to interests and capex ratio of 2.57, compared to 2.09 for the peers, which highlights the strength and capacity of the Company to pay its interests expense and finance investments aimed at improving its assets by using only the cash generated from its operations. Dupont analysis The Dupont analysis of Valeo shows that the increase of the return on common equity over the period 2012-2016 was primarily attributable to improvement of the Company profit margins which increased by 240 basis points in five years. Valeo 2012 2013 2014 2015 2016 Return On Common Equity 18.4% 18.4% 21.7% 22.4% 25.0% Profit margin = Net Profit / Sales 3.2% 3.8% 4.4% 5.0% 5.6% Asset Turnover = Sales / Total Assets 1.3x 1.3x 1.3x 1.4x 1.3x Financial Leverage = Total Assets / Common Equity 4.3 3.7 3.6 3.3 3.5
  • 9. Report by Johan NDONG VALUATION The valuation of Valeo is done using the DCF model (cash flow analysis) and peer comparable (valuation based on market capitalization). From these two techniques, the value of the share is estimated at €64.10. DCF The Discounted Free Cash Flow model applied over the forecast period 2017-2021 estimates the stock value at €66.60, which corresponds to a 12.90% upside compared to the stock price of €58.99 observed on June 30, 2017. Details of the calculations are provided in Appendix-3. The DCF model is built on the following assumptions: Sales – In the projected business plan, Valeo forecasts sales of the Comfort & Driving Assistance Systems Business Group to grow at a compound annual rate of 10% during 2017-2021, which is in line with the historical CAGR of 9.50% over 2012-2016. The Company plans to achieve sales growth at a compound annual rate of 14% for the Powertrain Systems Business Group, which is almost three times the CAGR of 5.10% between 2012 and 2016, thanks to additional sales brought by the joint-venture Valeo- KAPEC and the acquisition of FTE Automotive (operations currently pending approvals). For the Thermal Systems Business Group, Valeo projects sales to grow at a compound annual rate of 7% during 2017-2021 while the historical CAGR was 8.25% over 2012-2016. Finally, the Company forecasts sales of the Visibility Systems Business Group to grow at a compound annual rate of 10% during 2017-2021, compared to the historical CAGR of 12.60% between 2012 and 2016. Costs and margins – Gross margin is assumed to improve slightly, as this was the case over 2012-2016, increasing from 18.44% of total sales in 2017 to 18.81% in 2021, mainly thanks to decreasing labor costs and stabilized expense in raw materials and direct production costs. The Company projects to spend approximately 6% of total sales in research and development and intends to lower administrative expense to 2.80% of total sales by 2021. Assuming selling expense decreases to 1.43% of total sales in 2021, EBIT margin is expected to increase to 8.58% in 2021. Capital expenditures – The company projects to spend 6% of total sales in capital expenditures during the forecast period. Terminal value – The perpetuity growth rate is assumed to be 1.5%. This is the rate the Company uses in its impairment tests and it is in line with the average long-term growth rate of the business sector. WACC – The WACC of the Company is estimated at 8.92%. The calculation of the cost of equity is based on a risk-free rate of 2.48% (10-year average of the 10-year French Government Bond), a market risk premium of 6% in France (based on industry practice) and an unlevered industry beta of 1.09 (from Valeo estimates). The after-tax cost of debt is derived from a pre-tax cost of debt of 1.625% (corresponding to the coupon of the last 10-year bond issued by the Company) and a tax rate of 25.0% (corresponding to the average rate of taxes paid by the Company over the last 5 years). Sensitivity analysis – The growth of the sales of the Powertrain Systems Business Group (from a CAGR of 5% historically to a CAGR of 14% in the forecast), the WACC, and the perpetuity growth rate are the main critical assumptions of the model (ordered from the most to the least critical). A sensitivity analysis was performed to assess the impact of change of initial assumptions on the valuation. The result of this analysis gives an estimated stock value between €57.45 and €73.54 for a sales growth between 11.0% and 14.5% of the Powertrain Systems Business Group, a WACC between 8.50% and 9.25%, and a perpetuity growth rate between 1.25% and 1.75%. Unlevered Beta (industry peers) 1.09 Risk-Free Rate 2.48% Risk Premium 6.00% Cost of Equity 9.19% Cost of Debt 1.63% Net Debt/Equity 3.45% WACC 8.92%
  • 10. Report by Johan NDONG Peer Comparable The valuation of the Company using peer comparable gives an estimated stock value of €60.34, which corresponds to a 2.3% upside compared to the stock price of €58.99 observed on June 30, 2017. Peer comparable selection criteria are detailed at the beginning of the financial analysis. Only peers for which consensus estimates of sales, EBITDA and EBIT for the years 2017, 2018 and 2019 were used in the valuation. Details of the valuation are provided in Appendix-4. EV / EBITDA multiple – Considering peer Entreprise Value as of June 30, 2017 with EBITDA of the year 2016, average EV / EBITDA multiple is 7.2, the median is 6.3, the minimum is 3.9, and the maximum is 16.1 (with a standard deviation of 38%). The valuation is done using peer Entreprise Value at June 30, 2016 with consensus estimates of their EBITDAs over the years 2017, 2018 and 2019. To avoid noise in the calculation, the peers with the higher and the lower EV / EBITDA multiples were removed from the valuation. Peer average EV / EBITDA multiple with expected 2017 EBITDA is 6.3, the multiple with expected 2018 EBITDA is 5.9, and the multiple with expected 2019 EBITDA is 5.5 (with standard deviations around 25%). Application of the calculated EV / EBITDA multiples to the consensus estimates of the Company EBITDA over 207-2019 results in an estimated stock value of €60.34 (average), a minimum of €48.23 (lower quartile) and a maximum of €70.02 (upper quartile). Other valuation multiples – EV / Sales and EV / EBIT ratios are not accurate enough to value the Company stock in the present case. Indeed, EV / Sales ratio does take into account the difference in operating efficiency and margins between the peers, and EV / EBIT ratio is biased by companies’ accounting of depreciation and amortization. Final stock valuation The DCF model gives an estimate of the fair value of the stock considering the future cash flows of the Company, and peer comparable gives an estimate of the value of the stock considering current market conditions. The result of the DCF model is weighted at 60% in the final valuation since it captures better the intrinsic value of the Company and, in the present case, the future cash flows can be properly estimated. The result of the valuation using peer comparable is weighted less than 50% since the economy is currently under normal conditions (no recession and no underlying bubble in the industry). The combination of the two valuation techniques gives an estimated stock value of €64.10. 66.60 5.00% 8.00% 11.00% 14.00% 14.50% 15.00% 15.50% 8.25% 55.27 60.92 67.20 74.15 75.38 76.63 77.90 8.50% 53.04 58.47 64.50 71.18 72.36 73.56 74.78 8.75% 50.96 56.18 61.98 68.41 69.54 70.69 71.87 8.92% 49.61 54.70 60.35 66.60 67.71 68.83 69.98 9.00% 49.02 54.05 59.64 65.82 66.91 68.03 69.15 9.25% 47.21 52.06 57.45 63.41 64.46 65.53 66.62 9.50% 45.51 50.19 55.39 61.14 62.16 63.19 64.24 Sensitivity to growth of sales of Powertrain Systems (CAGR)WACC 66.60 0.75% 1.00% 1.25% 1.50% 1.75% 2.00% 2.25% 8.25% 67.47 69.54 71.77 74.15 76.72 79.50 82.51 8.50% 64.99 66.91 68.97 71.18 73.54 76.09 78.85 8.75% 62.67 64.46 66.37 68.41 70.59 72.94 75.47 8.92% 61.15 62.85 64.67 66.60 68.68 70.90 73.29 9.00% 60.49 62.15 63.93 65.82 67.85 70.02 72.35 9.25% 58.43 59.99 61.65 63.41 65.29 67.29 69.45 9.50% 56.50 57.96 59.50 61.14 62.89 64.75 66.74 WACC Perpetuity growth rate 50% 55% 60% 65% 70% 30% 64.72 35% 64.41 40% 64.10 45% 63.78 50% 63.47 DCF Peer Comparable (in millions except stock price) Average Total Entreprise Value 16 201 Market Capitalization 14 429 Shares Outstanding 239 Stock Value 60.34
  • 11. Report by Johan NDONG IDENTIFIED RISKS Economic risks The car-making industry is cyclical in nature and depends on economic prosperity, fuel prices, consumer confidence and employment. The automobile industry has recovered from the 2008 crisis but low economic growth in Europe and a slowdown in the growth in China is a risk to Valeo perspectives. Industry risks Valeo operates in a very competitive industry that requires market players to differentiate through innovation, which puts pressure on the Company to invest heavily in research and development in areas which may or may not bring future success. Regulatory & Legal risks Valeo was recently under investigation by the United States and European antitrust authorities regarding components and systems supplied to the automotive industry. Though the first case was settled with the US Department of Justice in 2013 and the Company had made sufficient provision before receiving the fine from the European Commission in March 2017 for the second case, new lawsuits resulting from facts or circumstances that are unknown at present cannot be ruled out. Financial risks Since Valeo operates at an international level, the Company is exposed to fluctuations in foreign currencies and commodity prices.
  • 12. Report by Johan NDONG APPENDIX 1 – PEER GROUP Data from the companies’ annual reports (2016) EMEA NAFTA APAC Engine & Powertrain systems Interior controls & Electronic systems Thermal systems Visibility systems 1 Robert Bosch Germany 43.9 60% 53.0% 19.0% 28.0% X X X X 2 Denso Japan 37.7 100% 13.1% 24.6% 84.1% X X X X 4 Magna Canada 32.9 100% 25.1% 53.2% 6.0% X X X 3 ZF Friedrichshafen Germany 32.6 92% 49.0% 29.0% 22.0% X X 5 Hyundai Mobis South Korea 29.8 100% 12.8% 22.8% 59.4% X X 6 Aisin Seiki Japan 29.7 97% 8.7% 17.4% 73.9% X X 7 Continental Germany 24.5 61% 50.0% 26.0% 21.0% X X 8 Faurecia France 18.7 100% 51.5% 27.9% 16.4% X 9 Lear USA 16.8 100% 38.0% 40.5% 18.6% X 10 Valeo France 16.5 100% 50.0% 20.9% 26.7% X X X X 11 Johnson Controls USA 15.2 45% 27.0% 47.4% 6.0% X 12 Delphi USA 15.1 100% 35.0% 39.0% 26.0% X X X 13 Cummins USA 12.6 80% xxx 54.1% xxx X 14 Mahle Germany 12.3 100% 50.0% 26.0% 19.0% X X 15 Toyota Boshoku Japan 11.3 59% 6.5% 21.5% 72.0% X X 16 Schaeffler Germany 10.3 78% 53.1% 21.0% 25.9% X 17 Autoliv USA 9.1 100% 30.6% 33.6% 35.9% X 18 Calsonic Kansei Japan 8.8 100% 11.9% 40.4% 47.7% X X X 19 BorgWarner USA 8.2 100% 40.0% 33.0% 27.0% X 20 Tenneco USA 7.8 100% 35.0% 49.0% 16.0% X 21 Koito Japan 7.0 100% 4.2% 23.3% 73.3% X 23 Jtekt Japan 6.9 100% 16.0% 24.9% 59.1% X 22 Federal Mogul USA 6.7 100% 41.0% 45.0% 10.0% X X 24 Hella Germany 6.4 100% 55.0% 19.0% 27.0% X X 25 Benteler Germany 5.9 78% 63.3% 19.1% 12.0% X 26 Dana USA 5.3 100% 28.0% 53.0% 13.0% X *Currency translations are based on the averages of the exchange rates that prevailed in 2016 CompanyRank % Sales by geaographic area ProductsAutomotive equipment sales (€ billion*) Automotive equipment sales as % of total salesCountry
  • 13. Report by Johan NDONG APPENDIX 2 – FINANCIAL ANALYSIS Key financials (based on extract from Capital-IQ) 2012 2013 2014 2015 2016 Average* Financial results (in millions of euros) Sales 11 759 11 662 12 725 14 544 16 519 EBITDA 1 104 1 137 1 286 1 549 1 831 EBIT 703 750 851 1 043 1 266 Sales growth 8.20% -0.83% 9.12% 14.29% 13.58% 8.73% Peer average 4.04% 6.05% 8.89% 6.60% 4.25% 5.71% Margins Gross margin 16.57% 17.23% 17.31% 17.69% 18.28% 17.42% Peer average 16.15% 17.03% 17.35% 17.60% 18.13% 17.25% EBITDA margin 9.39% 9.75% 10.11% 10.65% 11.08% 10.20% Peer average 9.58% 10.20% 10.40% 10.68% 11.10% 10.39% EBIT margin 5.98% 6.43% 6.69% 7.17% 7.66% 6.79% Peer average 6.00% 6.55% 6.81% 6.98% 7.25% 6.72% Profitability Return on Equity 18.62% 19.82% 21.63% 23.29% 24.44% 21.56% Peer average 22.30% 15.26% 16.48% 18.16% 20.33% 18.51% Return on Capital 10.64% 10.81% 11.58% 12.69% 12.42% 11.63% Peer average 9.46% 9.32% 10.28% 10.27% 10.45% 9.96% Return on Assets 5.03% 5.27% 5.63% 6.08% 6.13% 5.63% Peer average 5.29% 5.32% 5.80% 5.86% 5.98% 5.65% Operating efficiency Asset turnover 1.35x 1.31x 1.35x 1.36x 1.28x 1.33x Peer average 1.48x 1.46x 1.44x 1.40x 1.37x 1.43x Inventory turnover 12.63x 12.07x 12.04x 11.41x 10.57x 11.74x Peer average 11.38x 11.04x 10.75x 10.65x 10.51x 10.87x Fixed Asset turnover 5.83x 5.61x 5.56x 5.55x 5.69x 5.65x Peer average 5.90x 5.67x 5.53x 5.36x 5.16x 5.52x Days Sales Outstanding 50 47 45 46 49 47 Peer average 56 54 54 55 57 55 Days Inventory 29 30 30 32 35 31 Peer average 40 39 40 40 42 40 Payable Period 85 86 86 89 95 88 Peer average 56 55 56 57 61 57 Cash Conversion Cycle -6 -9 -11 -11 -11 -10 Peer average 39 38 38 38 38 39 Operating Cash Flow to Assets 0.11x 0.15x 0.13x 0.15x 0.13x 0.13x Peer average 0.10x 0.10x 0.10x 0.10x 0.11x 0.10x Liquidity Current Ratio 1.10x 1.09x 1.04x 0.99x 1.05x 1.05x Peer average 1.55x 1.55x 1.58x 1.52x 1.50x 1.54x Quick Ratio 0.73x 0.78x 0.74x 0.69x 0.76x 0.74x Peer average 1.06x 1.07x 1.06x 1.03x 1.03x 1.05x Op. Cash Flow to Current Liabilities 0.23x 0.34x 0.30x 0.32x 0.30x 0.30x Peer average 0.31x 0.32x 0.31x 0.33x 0.35x 0.32x Solvency Total Debt to Assets 0.23x 0.21x 0.18x 0.16x 0.20x 0.20x Peer average 0.18x 0.20x 0.20x 0.22x 0.20x 0.20x Total Debt to EBITDA 1.89x 1.64x 1.43x 1.15x 1.59x 1.54x Peer average 1.62x 1.59x 1.58x 1.69x 1.60x 1.62x EBITDA to Interest expense 9.44x 10.63x 12.61x 16.66x 20.12x 13.89x Peer average 33.25x 32.49x 34.10x 34.20x 36.02x 34.01x Op. Cash Flow to Interest expense + Capex 1.93x 2.90x 2.52x 2.89x 2.60x 2.57x Peer average 1.83x 2.42x 1.95x 1.99x 2.27x 2.09x *Average Sales growth = Compound Annual Growth Rate
  • 14. Report by Johan NDONG Sales analysis Costs analysis (removing impairments) (in millions of euros) 2012 2013 2014 2015 2016 CAGR 2012-2016 Sales by Business Group Comfort & Driving Assistance Systems 2487 2217 2291 2702 3343 9.50% % Growth 17.09% -10.86% 3.34% 17.94% 23.72% Powertrain Systems 3237 3119 3292 3706 3975 5.10% % Growth 4.45% -3.65% 5.55% 12.58% 7.26% Thermal Systems 3313 3340 3598 4032 4622 8.25% % Growth 6.53% 0.81% 7.72% 12.06% 14.63% Visibility Systems 2698 2958 3515 4073 4545 12.60% % Growth 7.45% 9.64% 18.83% 15.87% 11.59% Other 24 28 29 31 34 7.21% % Growth 0.00% 16.67% 3.57% 6.90% 9.68% Total sales 11759 11662 12725 14544 16519 8.73% Restated (in millions of euros) 2012 2013 2014 2015 2016 CAGR 2012-2016 Sales by geographic area Europe (including Africa) 6233 6313 6637 7283 8262 5.45% % Growth -1.66% 1.28% 5.13% 9.73% 13.44% North America 1921 1977 2454 3085 3452 18.00% % Growth 27.30% 2.92% 24.13% 25.71% 11.90% South America 686 602 455 351 393 -12.52% % Growth -10.56% -12.24% -24.42% -22.86% 11.97% Asia 2919 2770 3179 3825 4412 14.38% % Growth 29.50% -5.10% 14.77% 20.32% 15.35% Total sales 11759 11662 12725 14544 16519 8.73% Restated (in millions of euros) 2012 2013 2014 2015 2016 Total sales 11759 11662 12725 14544 16519 Cost of sales Raw materials consumed -6895 -6837 -7423 -8510 -9681 % ofTotal Sales 58.64% 58.63% 58.33% 58.51% 58.61% Labor -1555 -1509 -1642 -1806 -1975 % ofTotal Sales 13.22% 12.94% 12.90% 12.42% 11.96% Direct production costs and production overheads -1019 -979 -1092 -1209 -1358 % ofTotal Sales 8.67% 8.39% 8.58% 8.31% 8.22% Depreciation and amortization -342 -328 -365 -446 -485 % ofTotal Sales 2.91% 2.81% 2.87% 3.07% 2.94% Total cost of sales -9811 -9653 -10522 -11971 -13499 Gross margin 1948 2009 2203 2573 3020 Gross margin as % oftotal sales 16.57% 17.23% 17.31% 17.69% 18.28% Research and Development expenditure, net -587 -604 -683 -783 -941 % ofTotal Sales 4.99% 5.18% 5.37% 5.38% 5.70% Selling expenses -196 -193 -207 -230 -258 % ofTotal Sales 1.67% 1.65% 1.63% 1.58% 1.56% Administrative expenses -429 -436 -449 -486 -533 % ofTotal Sales 3.65% 3.74% 3.53% 3.34% 3.23% EBIT 736 776 864 1074 1289 Restated
  • 15. Report by Johan NDONG APPENDIX 3 – DCF VALUATION WACC Calculation 1Average effective tax rate during the last 5 years - 2Extract from the 2016 annual report - 3Average net debt / equity ratio during the last 5 years 4Extract from the 2016 annual report Sales forecast Costs projection Corporate Tax Rate1 25.0% Unlevered Beta (industry peers)2 1.09 Re-levered Beta 1.12 Risk-Free Rate 2.48% Risk Premium 6.00% Cost of Equity 9.19% Cost of Debt 1.63% Net Debt/Equity3 3.45% WACC 8.92% Perpetuity Growth4 1.50% (in millions of euros) 2017 2018 2019 2020 2021 Sales Comfort & Driving Assistance Systems 3677 4045 4450 4894 5384 5465 % Growth 10.0% 10.0% 10.0% 10.0% 10.0% Powertrain Systems 4532 5166 5889 6714 7654 7768 % Growth 14.0% 14.0% 14.0% 14.0% 14.0% Thermal Systems 4946 5292 5662 6058 6483 6580 % Growth 7.0% 7.0% 7.0% 7.0% 7.0% Visibility Systems 5000 5499 6049 6654 7320 7430 % Growth 10.0% 10.0% 10.0% 10.0% 10.0% Other 36 39 42 45 48 49 % Growth 7.2% 7.2% 7.2% 7.2% 7.2% Total sales 18190 20041 22092 24366 26888 27291 Terminal Value Forecast (in millions of euros) 2017 2018 2019 2020 2021 Total sales 18190 20041 22092 24366 26888 27291 Cost of sales Raw materials consumed -10649 -11733 -12933 -14264 -15741 -15977 % ofTotal Sales 58.54% 58.54% 58.54% 58.54% 58.54% Labor -2160 -2363 -2585 -2828 -3093 -3139 % ofTotal Sales 11.88% 11.79% 11.70% 11.60% 11.50% Direct production costs and production overheads -1495 -1648 -1816 -2003 -2210 -2244 % ofTotal Sales 8.22% 8.22% 8.22% 8.22% 8.22% Depreciation and amortization -531 -585 -645 -711 -785 -796 % ofTotal Sales 2.92% 2.92% 2.92% 2.92% 2.92% Total cost of sales -14836 -16328 -17979 -19806 -21829 -22157 Gross margin 3355 3713 4113 4560 5059 5135 Gross margin as % oftotal sales 18.44% 18.53% 18.62% 18.71% 18.81% Research and Development expenditure, net -1091 -1202 -1326 -1462 -1613 -1637 % ofTotal Sales 6.00% 6.00% 6.00% 6.00% 6.00% Selling expenses -279 -302 -328 -355 -385 -390 % ofTotal Sales 1.54% 1.51% 1.48% 1.46% 1.43% Administrative expenses -571 -612 -656 -703 -753 -764 % ofTotal Sales 3.14% 3.06% 2.97% 2.89% 2.80% EBIT 1412 1596 1803 2040 2308 2343 EBITmargin as % oftotal sales 7.76% 7.96% 8.16% 8.37% 8.58% Terminal Value Forecast
  • 16. Report by Johan NDONG Stock valuation (in millions of euros) 2017 2018 2019 2020 2021 Total sales 18190 20041 22092 24366 26888 27291 Gross margin 3355 3713 4113 4560 5059 5135 EBIT 1412 1596 1803 2040 2308 2343 Taxes -353 -399 -451 -510 -577 -586 EBIT after taxes 1059 1196 1352 1529 1731 1757 Depreciation & Amortization 805 887 978 1079 1190 1208 Change in Working capital 79 87 96 106 116 118 Capex -1091 -1202 -1326 -1462 -1613 -1637 % ofTotal Sales 6.00% 6.00% 6.00% 6.00% 6.00% Cash Flow to Equity 852 968 1100 1252 1424 19475 Discount Factor 0.9578 0.8794 0.8073 0.7412 0.6805 0.6805 Present Value 816 851 888 928 969 13253 Terminal Value Forecast Total Entreprise Value 17705 Cash & Short Term Investments 2359 Total Financial Debt -2916 Total Minority Interest -236 Debt Equiv. of Unfunded Proj. Benefit Obligation -984 Market Capitalization 15928 Shares Outstanding 239 Stock Value 66.60
  • 17. Report by Johan NDONG APPENDIX 4 – TRADING MULTIPLE VALUATION Data from Capital-IQ EV / EBITDA ratios automotive suppliers (in millions of euros) Country Currency 2017 2018 2019 2017 2018 2019 <<European automotive suppliers>> Valeo France EUR 15 806 1 831 8.6x 2 490 2 812 3 104 6.3x 5.6x 5.1x Continental Germany EUR 44 517 6 101 7.3x 6 961 7 490 7 953 6.4x 5.9x 5.6x Faurecia France EUR 6 992 1 360 5.1x 1 756 1 873 1 967 4.0x 3.7x 3.6x Schaeffler Germany EUR 13 355 2 363 5.7x 2 485 2 646 2 800 5.4x 5.0x 4.8x Hella Germany EUR 5 332 797 6.7x 887 983 1 070 6.0x 5.4x 5.0x <<Asian automotive suppliers>> Denso Japan JPY 3 593 861 573 816 6.3x 607 070 646 319 688 582 5.9x 5.6x 5.2x Hyundai Mobis South Korea KRW 18 515 323 3 550 090 5.2x 3 589 880 4 014 407 4 282 891 5.2x 4.6x 4.3x Aisin Seiki Japan JPY 2 289 721 418 782 5.5x 463 076 493 745 527 730 4.9x 4.6x 4.3x Toyota Boshoku Japan JPY 423 419 109 256 3.9x 10⁶ 457 112 275 116 217 4.0x 3.8x 3.6x Jtekt Japan JPY 787 451 133 553 5.9x 138 771 147 943 161 900 5.7x 5.3x 4.9x Koito Japan JPY 829 250 124 245 6.7x 133 129 142 728 152 901 6.2x 5.8x 5.4x <<American automotive suppliers>> Magna International Canada CAD 27 032 5 011 5.4x 5 253 5 575 5 975 5.1x 4.8x 4.5x Johnson Controls USA USD 56 583 3 510 16.1x 4 839 5 206 5 614 11.7x 10.9x 10.1x Cummins USA USD 27 549 2 310 11.9x 2 800 2 978 3 214 9.8x 9.3x 8.6x Lear USA USD 10 824 1 841 5.9x 2 026 2 091 2 199 5.3x 5.2x 4.9x Delphi USA USD 28 268 2 979 9.5x 2 974 3 155 3 364 9.5x 9.0x 8.4x Autoliv USA USD 10 503 1 257 8.4x 1 295 1 417 1 581 8.1x 7.4x 6.6x Tenneco USA USD 4 564 763 6.0x 882 949 1 000 5.2x 4.8x 4.6x BorgWarner USA USD 11 190 1 511 7.4x 1 548 1 638 1 694 7.2x 6.8x 6.6x Dana USA USD 5 245 612 8.6x 737 791 862 7.1x 6.6x 6.1x Min 3.9x 4.0x 3.7x 3.6x Max 16.1x 11.7x 10.9x 10.1x Peer average 7.2x 6.3x 5.9x 5.5x Std. Dev. 2.8x 1.6x 1.5x 1.3x Peer median 6.3x 5.9x 5.4x 5.0x Peer lower quartile 5.6x 5.2x 4.8x 4.5x Peer upper quartile 7.9x 7.2x 6.7x 6.3x Std. Dev. % 38% 25% 25% 24% EV / EBITDAEBITDA EV EBITDA 2016 EV / EBITDA (2016)
  • 18. Report by Johan NDONG EV / EBITDA analysis Stock valuation 2017 2018 2019 Average EV 15 690 16 541 17 054 Median EV 14 738 15 247 15 461 Lower quartile EV 12 861 13 575 14 103 Upper quartile EV 17 851 18 921 19 699 Weight 0.50 0.33 0.17 (in millions except stock price) Average Low High Total Entreprise Value 16 201 13 306 18 516 Cash & Short Term Investments 2 364 2 364 2 364 Total Debt -2 916 -2 916 -2 916 Total Minority Interest -236 -236 -236 Debt Equiv. of Unfunded Proj. Benefit Obligation -984 -984 -984 Market Capitalization 14 429 11 534 16 744 Shares Outstanding 239 239 239 Stock Value 60.34 48.23 70.02 Valeo Year
  • 19. Report by Johan NDONG APPENDIX 5 – CONSOLIDATED STATEMENT OF INCOME (Extract from Valeo annual report)
  • 20. Report by Johan NDONG APPENDIX 6 – CONSOLIDATED STATEMENT OF FINANCIAL POSITION (Extract from Valeo annual report)
  • 21. Report by Johan NDONG APPENDIX 7 – CONSOLIDATED STATEMENT OF CASH FLOWS (Extract from Valeo annual report)