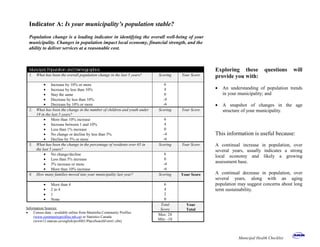
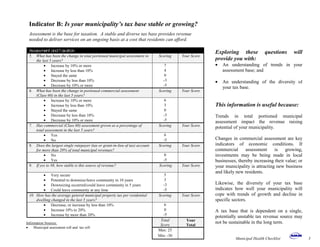
The document is a municipal health checklist that is a self-analysis tool for municipalities to gauge their strengths and challenges. It provides indicators in areas like population change, tax base stability, financial strength, intermunicipal cooperation, and community support. Municipalities can use the checklist to get an understanding of their situation and determine if a new approach could help address any challenges. Scoring each indicator provides an overall score, with higher scores indicating areas that are working well and lower scores identifying challenges. The checklist is the first step for municipalities considering options like service sharing, tax sharing, or potential restructuring.
Where's the Money? State and Local Government Finance Forecast - Outlook 2015Jon Yoffie
"IT’S NOT DOING MORE WITH LESS, IT’S DOING MORE WITH THE SAME." Governing Publisher Mark Funkhouser coined this one in the "Where’s the Money?" briefing on state and local government revenues and budgets. State and local government revenues are up 3.3% overall, but spending next year will be a bit below the pre-Recession peak, and long-term growth rates are going to be lower than projected long-term liabilities (pensions, government retiree healthcare, Medicaid, etc.), even as federal-to-state and state-to-local funds decline. So while we’ve moved beyond doing more with less, the bottom line is still (and for the foreseeable future will be) the bottom line. Finding ways to cut costs, increase efficiencies and fund programs with creative revenue-generating or private-sector partnership solutions will be paramount.
Testimony: Mississippi Tax Policy: Options for Reform (10/3)Tax Foundation
This presentation accompanied testimony to the Mississippi Tax Policy Council about the state of Mississippi's tax code and the best options for reforming it.
Topics covered include:
An overview of the Tax Foundation
Mississippi's place on the State Business Tax Climate Index
Mississippi's state-local tax burdens
A path toward reform
This report provides a fact-based assessment of Michigan’s economic competitiveness relative to other states. Michigan’s performance is compared on key output (e.g., employment, GDP) and input (e.g., labor cost) metrics. A set of “traditional,” “new economy,” and “Top Ten” benchmark states were used to provide multiple reference points to evaluate Michigan’s performance.
While the intent of this report is not to make recommendations, general conclusions are outlined. These conclusions are used by Business Leaders for Michigan to help develop strategies for making Michigan a “Top Ten” state for jobs, personal income, and a healthy economy.
Testimony: Mississippi Tax Policy: Options for ReformTax Foundation
This presentation accompanied testimony to the Mississippi Tax Policy Council about the state of Mississippi's tax code and the best options for reforming it.
Topics covered include an overview of Mississippi's tax system, tax rates and collections, state-local tax burdens, state business tax climate, previous state success stories, and suggestions for reform.
The presentation was given on September 1, 2016.
Excise taxes on alcohol & other sin products have long been a dependable and significant revenue source for Policy planners in India. Maximization of Government Revenue to generate resources that can be utilized to finance Departmental projects is always accorded a high priority on the agenda of the policymakers. However, when it comes to framing a policy such as Excise Policy, the Excise & Taxation Department has to give due weight to the health and well-being of the citizens of the State. An ideal Excise Policy, therefore, not only has to strike a delicate balance between the twin objectives of preventing dominance of liquor mafia or social degeneration on the one hand and securing an optimum revenue for the Government on the other, but also has to address the concerns of all the four key stakeholders i.e. the Government, the Manufacturers, the Licensees and most important of all, the Consumer. While there are various other factors that also play a significant role in
achieving the State Excise Objective, the article explores the role of Tax Stamps & Traceability Technology Role in State Excise Policy in the current scenario.
FreeBalance Government Customers on the Road to Improved GovernanceFreeBalance
Study comparing national governments running FreeBalance Government Resource Planning (GRP) for Public Financial Management (PFM) for governance outcomes such as government effectiveness and country growth with peer countries that are not running FreeBalance software
Mexico is a fascinating country for students to look at as part of their studies in economic growth and development and macroeconomic policy. The country has an enviably low rate of unemployment and has made important progress in lifting per capita incomes for many of their 100 million plus inhabitants. But inequality remains very high, the economy is dominated by monopolies and there is also a huge informal, low productivity economy which needs to be addressed for future growth and development to be more inclusive. Can Mexico avoid a middle income trap?
This study discusses Canadians’ opinion of their own provincial economies and the new financial direction for the country in 2015 – the recession, cost of living, national economy.
Danielle Resnick - Are there dividends from district proliferation? The cas...IFPRI SIG
"Are there dividends from district proliferation? The case of Ghana" - Danielle Resnick
SIG 2015 Workshop "Integrating Multi-level Governance into the Post-2015 Development Agenda: Opportunities, Trade-offs, and Implications", Nov 9-10, 2015
Greater Nashua Chamber of Commerce Legislative Symposium and Reception; Janua...Greater Nashua Chamber
This non-partisan open forum presents an opportunity for our state’s representatives to connect just prior to the session’s beginning, which will run until June. We aim to speak theoretically, beyond specific bills and votes, as well as to educate them on topics that will directly affect our business community.
We approach the issues through the lens of the business community’s needs over the next 10 years, and break down the trends to see where we are compared to where we need to be.
Topics and Speakers:
Overview of Medicaid Expansion in NH
Mr. Steve Norton, Executive Director of the NH Center for Public Policy
Mr. Tom Wilhelmsen, Jr., CEO of Southern NH Health Systems*
Mr. Charlie Arlinghaus, President of The Josiah Bartlett Center
Is It Time for a Gas Tax in NH?
Commissioner Chris Clement, NH Dept. Of Transportation
Representative David Campbell (D-Nashua)
Mr. Charlie Arlinghaus, President of The Josiah Bartlett Center
Why Divestiture of PSNH Assets Matters to Southern NH
Mr. William J. Quinlan, President/Chief Operating Officer of PSNH
Mr. Daniel Allegretti, Vice President of State Government Affairs with Constellation Energy*
*Note: Mr. Tom Wilhelmsen, Jr. and Mr. Daniel Allegretti did not use PowerPoint slides during their presentations.
Tax reduction for economic developmentM S Siddiqui
The policy makers in Bangladesh prefer higher both income tax and customs duty in order to finance the development work defying the advice of economists. The own experience of tax reduction and reform in tax law since 1990s has increases higher revenue collection. Bangladesh should listen to economist and learn from the experience of two economies and ignore own experiences.
Presentation by Kevin Perese, Principal Analyst in CBO’s Tax Analysis Division, at the annual meeting of the Allied Social Science Associations.
CBO’s analyses of the distribution of household income and federal taxes rely on a broad measure of before-tax income to rank households and to serve as the denominator for the calculation of average tax rates across the income distribution. In this presentation, CBO examines the strengths and shortcomings of that distributional framework and of several alternative frameworks for analyzing the distributional effects of government transfers and federal taxes. Those alternative frameworks use market income (which excludes all government transfers and federal taxes), after-tax income (which includes government transfers and federal taxes), and gross income (which is a pretax income measure that excludes means-tested government transfers but includes transfers from social insurance programs).
McCarty General Assembly - product managementJustin M
Product management class at General Assembly SF final project. Project outlines "Local-R," a shopping app that aims to help bring retail shoppers back to local neighborhoods and community stores by helping local businesses aggregate their inventories online thereby enabling them to compete against big box stores and online shopping in terms of convenience, price, and loyalty.
Pre-Summit Workshop - New Markets Tax Credit Presentationkingdom1realty
What are New Markets Tax Credits?
First tax credit program to stimulate commercial investment in “low-income communities”
The program is administered by the US Treasury Department through a division call the CDFI Fund, in a unique public/private partnership with Community Development Entities (CDEs)
Budget Proposal For Miami-Dade County For Fiscal Year 201819I.docxcurwenmichaela
Budget Proposal For Miami-Dade County For Fiscal Year 2018/19
Introduction
This paper reviews the budget proposal for Miami-Dade County for fiscal year 2018/19, the budget process, sources of revenue and expenditure.
Overview And Budget Process.
Miami-Dade County is one of the counties in the USA and contains 13 districts. Miami-Dade County has a population of 2.71M people with a median age of 39.9 and a median household income of $45,935. Between 2015 and 2016 the population of Miami-Dade County grew from 2.69M to 2.71M, a 0.74% increase, and its median household income grew from $43,786 to $45,935, a 4.91% increase. The legislative and the governing body of the county is the Board of commission elected into office by the registered voters in a non-partisan election. One county commissioner is elected from each county for the term of four years each; the county chatter normally sets the salaries for each commissioner. The Commissioners elect a Chairperson, who then appoints the Chairperson, Vice-Chairperson, and members of all committees.
The Miami-Dade County commissioners normally plays a lot of roles which includes; reviews and adopts comprehensive development land use plans for the County, licenses and regulates taxis, transportation network entities, sets policy regarding public transportation systems, regulates utilities, adopts and enforces building codes, establishes zoning controls and establishes policy relating to public health, safety services and facilities, recreational and cultural facilities, housing and social services programs, and other services.
The BCC normally sets the tax rates and approve the county budget every financial year. Each year, the commission sets the property tax millage rates and approves the County’s budget, which determines
The expenditures and revenues are necessary to operate all County services, and enacts the County's strategic plan. The County Commission Board may override a Mayoral veto at its next regularly scheduled meeting by a two-thirds vote of those present. The Miami-Date county citizens do not directly play a role in the budget process, but the BCC normally represents them by making policies and advocate them at all levels of government. The Miami-Dade FY 2018/2019 annual budget began on 1st August 2018 and ended 30th June 2019. The budget process takes place in several stages which are a formulation, approval implementation, and audit. Documents essential to the budget process include the budget circular, the budget review, outlook paper, the county fiscal strategy paper, and the county budget estimates. The county has a budget performance analysis which is conducted by each department of the county, and it’s done through the analysis of the outcomes and results. The budget does not include the forecast for future years or prior years. The budget document gives detailed information on sources of revenue and expenditures. The budget report posted in the county’s websites gives inform.
You are a broker at a brokerage firm. You are expected to prepa.docxadampcarr67227
You are a broker at a brokerage firm. You are expected to prepare a financial analysis of a stateor municipal government and present in front of prospective investors including foreign central banks and foreign private investors. Prospective investors expect you to make recommendations on their investing decision. The objective of this project is to let you have an opportunity to analyze a Comprehensive Annual Financial Report (CAFR) and create your own assessment of the government’s financial condition. You can complete this project by having access to a CAFR of your government. A supplementary chapter is posted along with the project description for your guidance to prepare for this project. The use of other supplementary resources is upon your choice.
1. Paper
Contents
Your final work product should include an introduction, an analysis of each of the three components of financial performance discussed in the supplementary text (Environmental, Organizational, and Financial) and a conclusion about the overall financial condition of the state government. Other than what’s required above, you can be creative with the contents of your paper so long as your paper analyzes where the government stands financially and can make suggestions for investing decision. Please read the supplementary text before you begin your group work so that you have basic knowledge with which you can analyze the financial condition of the government you are assigned. MD&A section of CAFR is useful for future outlook but you should be skeptical on what is written in there. Statistical section of CAFR contains some financial ratios. You can choose to calculate your own ratios using financial statements based on lists of financial ratios in the supplementary text or you can use ratios from CAFR to infer your conclusion.
Format
The final report prepared by each group should be typed, double spaced (Times New Roman, 12 point font, one inch margin in all four sides), 10 pages in length, with references (but reference page is not counted toward the 10 pages for the content). No late submission will be accepted.
2. Presentation
Contents
As with the paper, you can be as creative as you wish. However, your presentation should include the gist of your paper. You can make your slides first and develop your paper from there or you can write your paper first and then make a summary for your power point slides. Either way, your paper and presentation should tell a consistent story. In addition, since you are an expert of the government you are presenting, you are expected to include an executive summary of your government in the beginning of your presentation. For this, demographic and economic information along with operating information in the statistical section will be useful. Presentation in Government Accounting class does not need to be boring! Be as creative as possible in delivering your message to your potential investors!!!
Format
How you pr.
You are a broker at a brokerage firm. You are expected to prepa.docx
AMM-Tools-checklist
1. The Municipal Health Checklist is a self-
analysis tool to gauge your municipality’s
strengths and understand its challenges,
and is the first step in determining if a
new approach makes sense for your
municipality.
Step 1:
Municipal
Health Checklist
Manitoba Municipalities:
Embracing 21st
Century Challenges
Tools for Change
2. Municipal Health Checklist
Manitoba Municipalities: Embracing 21st
Century Challenges - Tools for Change
The AMM recognizes that Manitoba’s
municipalities are changing. Some
municipalities’ populations are aging or
declining, while others are experiencing
continued growth. Local economies are
changing. The rural economy, often relying
on small rural business, is declining while
larger, corporate business is expanding.
Meanwhile regional/urban centres are
experiencing growth, capitalizing on new
economic opportunities which attract young
people and families. The expectations of
citizens are also changing. Residents are
becoming more sensitive to the costs of local
government, such as increases in property
taxes, and are placing more demands on
municipalities to deliver a broad range of
quality services.
To effectively manage change,
municipalities are exploring various
approaches such as service sharing, tax
sharing and under certain circumstances,
restructuring. The Municipal Health
Checklist is a self-evaluation tool to give
decision makers a better understanding of
their challenges. The checklist is the first
step in determining if a new approach makes
sense for your municipality.
Using the Municipal Health Checklist:
The checklist is a set of indicators designed to provide a better understanding of
various aspects of your municipality including population change, assessment and
taxation, fiscal strength, intermunicipal or regional strength and governance. Each
indicator includes a series of questions, that once answered, will ‘indicate’ where
things are working well and where there is room for improvement. The checklist is not
intended to provide an exact picture of your municipality’s overall health.
Most indicators require the collection of some data relating to demographics, total
municipal (portioned) assessment, total commercial (portioned) assessment, basic
information about major municipal ratepayers, municipal and regional planning,
existing service sharing agreements, community organizations and local election
results.
This data is easily obtained from your municipality’s audited financial statements,
assessment rolls, The Statistical Information for the Municipalities of the Province of
Manitoba (Stats Book, published by Manitoba Intergovernmental Affairs), census data
(available from www12.statcan.ca/english/profil01/PlaceSearchForm1.cfm), and
Manitoba Community Profiles (www.communityprofiles.mb.ca).
Information on evaluating your municipality’s score and the next steps your
municipality may want to consider are set out at the end of the checklist.
The checklist will require some time to complete. Although it is intended to be easy to
read and follow, some questions may arise or you may have difficulty obtaining the
information necessary to answer the indicator questions. If you require assistance,
Manitoba Intergovernmental Affairs has offered to provide information and technical
support to assist you. You can contact Manitoba Intergovernmental Affairs at
(204) 945-2572.
Municipal Health Checklist
3. Indicator A: Is your municipality’s population stable?
Municipal Population and Demographics
1. What has been the overall population change in the last 5 years? Scoring Your Score
• Increase by 10% or more 6
• Increase by less than 10% 4
• Stay the same 0
• Decrease by less than 10% -4
• Decrease by 10% or more -6
2. What has been the change in the number of children and youth under
19 in the last 5 years?
Scoring Your Score
• More than 10% increase 6
• Increase between 1 and 10% 4
• Less than 1% increase 0
• No change or decline by less than 5% -4
• Decline by 5% or more -6
3. What has been the change in the percentage of residents over 65 in
the last 5 years?
Scoring Your Score
• No change/decline 6
• Less than 5% increase 0
• 5% increase or more -4
• More than 10% increase -6
4. How many families moved into your municipality last year? Scoring Your Score
• More than 4 6
• 2 to 4 4
• 1 2
• None 0
Total
Score
Your
Total
Max: 24
Min: -18
Exploring these questions will
provide you with:
• An understanding of population trends
in your municipality; and
• A snapshot of changes in the age
structure of your municipality.
This information is useful because:
A continual increase in population, over
several years, usually indicates a strong
local economy and likely a growing
assessment base.
A continual decrease in population, over
several years, along with an aging
population may suggest concerns about long
term sustainability.
Municipal Health Checklist 2
Information Sources:
• Census data – available online from Manitoba Community Profiles
(www.communityprofiles.mb.ca) or Statistics Canada
(www12.statcan.ca/english/profil01/PlaceSearchForm1.cfm)
Population change is a leading indicator in identifying the overall well-being of your
municipality. Changes in population impact local economy, financial strength, and the
ability to deliver services at a reasonable cost.
4. Assessment is the base for taxation. A stable and diverse tax base provides revenue
needed to deliver services on an ongoing basis at a cost that residents can afford.
Indicator B: Is your municipality’s tax base stable or growing?
Assessment and T axation
5. What has been the change in total portioned municipal assessment in
the last 5 years?
Scoring Your Score
• Increase by 10% or more 7
• Increase by less than 10% 4
• Stayed the same 0
• Decrease by less than 10% -3
• Decrease by 10% or more -5
6. What has been the change in portioned commercial assessment
(Class 60) in the last 5 years?
Scoring Your Score
• Increase by 10% or more 6
• Increase by less than 10% 3
• Stayed the same 0
• Decrease by less than 10% -3
• Decrease by 10% or more -5
7. Has commercial (Class 60) assessment grown as a percentage of
total assessment in the last 5 years?
Scoring Your Score
• Yes 6
• No -5
8. Does the largest single ratepayer (tax or grant-in-lieu of tax) account
for more than 20% of total municipal revenues?
Scoring Your Score
• No 0
• Yes -5
9. If yes to #8, how stable is this source of revenue? Scoring Your Score
• Very secure 5
• Potential to downsize/leave community in 10 years 3
• Downsizing occurred/could leave community in 5 years -3
• Could leave community at any time -5
10. How has the average general municipal property tax per residential
dwelling changed in the last 5 years?
Scoring Your Score
• Decrease, or increase by less than 10% 6
• Increase 10% to 20% 0
• Increase by more than 20% -5
Total
Score
Your
Total
Max: 25
Min: -30
Exploring these questions will
provide you with:
• An understanding of trends in your
assessment base; and
• An understanding of the diversity of
your tax base.
This information is useful because:
Trends in total portioned municipal
assessment impact the revenue raising
potential of your municipality.
Changes in commercial assessment are key
indicators of economic conditions. If
commercial assessment is growing,
investments may be being made in local
businesses, thereby increasing their value; or
your municipality is attracting new business
and likely new residents.
Likewise, the diversity of your tax base
indicates how well your municipality will
cope with trends of growth and decline in
specific sectors.
A tax base that is dependent on a single,
potentially unstable tax revenue source may
not be sustainable in the long term.
Municipal Health Checklist 3
Information Sources:
• Municipal assessment roll and tax roll
5. Indicator C: Is your municipality financially strong?
Municipal Finance
11. What percentage of annual expenditures (excluding education) are
spent on general government?
Scoring Your Score
• Less than 15% 7
• 15% to 20% 0
• More than 20% -7
12. What percentage of annual expenditures are spent on servicing
municipal debt (principal and interest)?
Scoring Your Score
• Less than 2% 7
• 2% to 4% 0
• More than 4% -7
13. How much borrowing capacity does your municipality have
available?
Scoring Your Score
• More than 50% of municipal debt limit available 0
• Less than 50% of municipal debt limit available -4
• Debt limit reached/exceeded -7
14. The full value of General funded reserves represents what percentage
of annual expenditures?
Scoring Your Score
• More than 10% 7
• 5% - 10% 0
• Less than 5% -7
Total
Score
Your
Total
Max: 21
Min: -28
Exploring these questions will
provide you with:
• An understanding of how efficiently
your municipality is being governed; and
• Insight into whether your municipality
has the financial strength required to
meet local priorities.
This information is useful because:
The ability of your municipality to provide
efficient local government contributes to
overall health and ensures that services can
be provided at the lowest possible cost.
Municipalities that maintain financial
reserves have flexibility to deal with a
changing environment and changing service
demands, and still preserve their
opportunities for future growth.
A strong financial position enables your municipality to provide services that ratepayers
demand, at a price they are willing to pay. Municipalities in a strong financial position
are able to maintain competitive tax rates and have the flexibility to take advantage of
opportunities for growth.
Municipal Health Checklist 4
Information Sources:
• Audited municipal financial statements
6. Indicator D: Does your municipality take advantage of opportunities to work with others?
Intermunicipal Involvement
15. Does your municipality have/participate in: a Community Round
Table involving 2 or more municipalities, a Conservation District, a
Planning District, and/or a Regional Economic Development
Strategy?
Scoring Your Score
• 3 or more of the above 5
• 2 of the above 3
• 1 of the above 0
• None of the above -4
16. Is your municipality involved in service sharing arrangements with
other municipalities to share: recreation, building inspection duties,
waste disposal, snow clearing/ road maintenance, utility
infrastructure, economic development officer and/or a CAO?
Scoring Your Score
• More than 4 of the above 5
• 2-4 of the above 3
• 1 of the above 0
• 1 of the above that has not been reviewed in 5 or more years -2
• None of the above -4
17. How would the establishment of a major industry or growth in the
economy of a neighbouring municipality affect your municipality?
Scoring Your Score
• Increase in municipal tax revenue (due to tax sharing
agreement) AND significant local job creation/economic
spin-offs
5
• Significant local job creation/significant economic spin-offs
(no tax sharing)
3
• Few local jobs created, minor economic spin-offs 0
• Limited local economic impact -2
• No impact -4
Total
Score
Your
Total
Max: 15
Min: -12
Thinking on an intermunicipal or regional basis is becoming essential for municipalities to
adapt successfully to a changing environment. Recognizing that your municipality needs its
neighbours and being able to capitalize on opportunities to work together is becoming critical
to maintaining a strong municipality.
Exploring these questions will
provide you with:
• A gauge of whether your municipality is
fully accessing opportunities to take
advantage of interrelationships with
other municipalities.
• Insight into whether your municipality is
aware of its interrelationships with other
municipalities and prepared to take
advantage of the opportunities these
interrelationships present.
This information is useful because:
Although your municipality may be
experiencing pressures such as changing
demographics, shifts in local economy or
increasing expectations from taxpayers to
deliver affordable and efficient services,
these issues may be able to be addressed
through an intermunicipal approach.
Municipal Health Checklist 5
7. Indicator E: Is there local interest and support in your community?
Community Interest and Support
18. How many members of Council were acclaimed or appointed in the
last municipal general election?
Scoring Your Score
• 0 5
• 1 3
• 2 0
• 3 or more, but less than half of Council -2
• Half of Council or more -4
19. How secure is your municipality’s administrative support? Is your
CAO likely to retire in the next 3 years?
Scoring Your Score
• No, or yes but a succession plan is in place 5
• Yes, and no succession plan in place -2
• CAO position is vacant -4
20. Are there opportunities for residents to support your community? Do
you have citizens serving on Council committees and organizations
such as a chamber of commerce, service clubs, active Church groups,
cultural organizations?
Scoring Your Score
• 4 or 5 of the above 5
• 2 or 3 of the above 0
• Fewer than 2 of the above -4
Total
Score
Your
Total
Max: 15
Min: -12
Interest by citizens in the affairs of your municipality, strong administrative support now
and into the future and an active volunteer/non-profit sector make your community a
viable and vibrant place to live.
Exploring these questions will
provide you with:
• Insight into the willingness of residents
to serve on Council;
• The ability of your municipality to
provide reliable administrative capacity
into the future; and
• A gauge of the opportunities for
residents to participate in their
community.
This information is useful because:
In order to be viable and vibrant
communities, municipalities need
leadership, interest and support from
residents.
Contested elections provide opportunities
for important municipal issues to be debated
in public. A municipality is not viable
without sufficient candidates to run for
council.
Municipalities need reliable administrative
capacity to deliver efficient and effective
services.
Community involvement by residents and
volunteer organizations is an important
source of support for local projects and
events.
Municipal Health Checklist 6
Information Sources:
• Municipal general election records
8. Evaluating Your Scores:
The Municipal Health Checklist provides ‘scores’ on each
indicator. Once you have completed all the questions in an
indicator, add up the scores. A high or low score for an
individual indicator should not be interpreted prior to
completing the entire checklist. Individual indicator scores may
provide a piece of the puzzle but will not give you an exact
picture of your municipality.
The scores from the five indicators should be totaled as illustrated
below. The maximum score is 100 and the minimum score is
• 100. Your score should be interpreted in broad terms:
municipalities that score well above zero typically can interpret
that things are working relatively well.
Municipalities that score well below zero can use their score as
the first step in identifying challenges and determining if there is a
new approach that makes sense for your municipality.
It is anticipated that some municipalities will score just above or
below zero. In these circumstances, the checklist will indicate
areas that are working well and areas that may benefit from
further analysis.
When interpreting your overall score or a specific indicator’s
score, you should also rely on your knowledge and judgement of
your municipality. You know your municipality best!
Indicator
Total
Score
Your
Total
A – Is your municipality’s population stable?
Max: 24
Min: -18
B – Is your municipality’s tax base stable or
growing?
Max: 25
Min: -30
C – Is your municipality financially strong?
Max: 21
Min: -28
D – Does your municipality take advantage of
opportunities to work with others?
Max: 15
Min: -12
E – Is there strong interest in community
matters?
Max: 15
Min: -12
Grand
Total
Your
Overall
Score
Max: 100
Min: -100
Municipal Health Checklist 7
9. Next Steps:
Now that you have completed The Municipal Health Checklist,
you will have a better sense of your municipality’s situation and
challenges. If your municipality is interested in working towards a
new approach, you will need to determine a particular direction
that makes sense for your municipality.
The next step in determining an approach that will fit your needs
is to refer to The Reference Series on Municipal Approaches to
Managing Change, available from the Association of Manitoba
Municipalities. The Series combines the checklist results with
your municipality’s situation to assist in selecting the best
approach to meet the needs of your municipality.
The Reference Series provides logical and useful information on
different approaches such as service sharing, tax sharing and
possibly restructuring. It will also provide you with an idea of
what approach will work best for your municipality’s situation.
Fact sheets highlighting Successful Municipal Practices will also
be available from AMM. These informative sheets offer insight
into the motivations behind and methods used to implement new
approaches. AMM is also sponsoring an annual Innovations
Awards Program that will recognize excellence in municipal
practices that improve governance, administration, service
delivery or intermunicipal cooperation.
Once you have completed the checklist and have reviewed The
Reference Series on Municipal Approaches to Managing Change,
your municipality has taken an important step towards
determining an approach to meet your challenges. At this point, if
you would like further support or information, contact the
Association of Manitoba Municipalities at (204) 857-8666 or
Manitoba Intergovernmental Affairs at (204) 945-2572.
Municipal Health Checklist 8