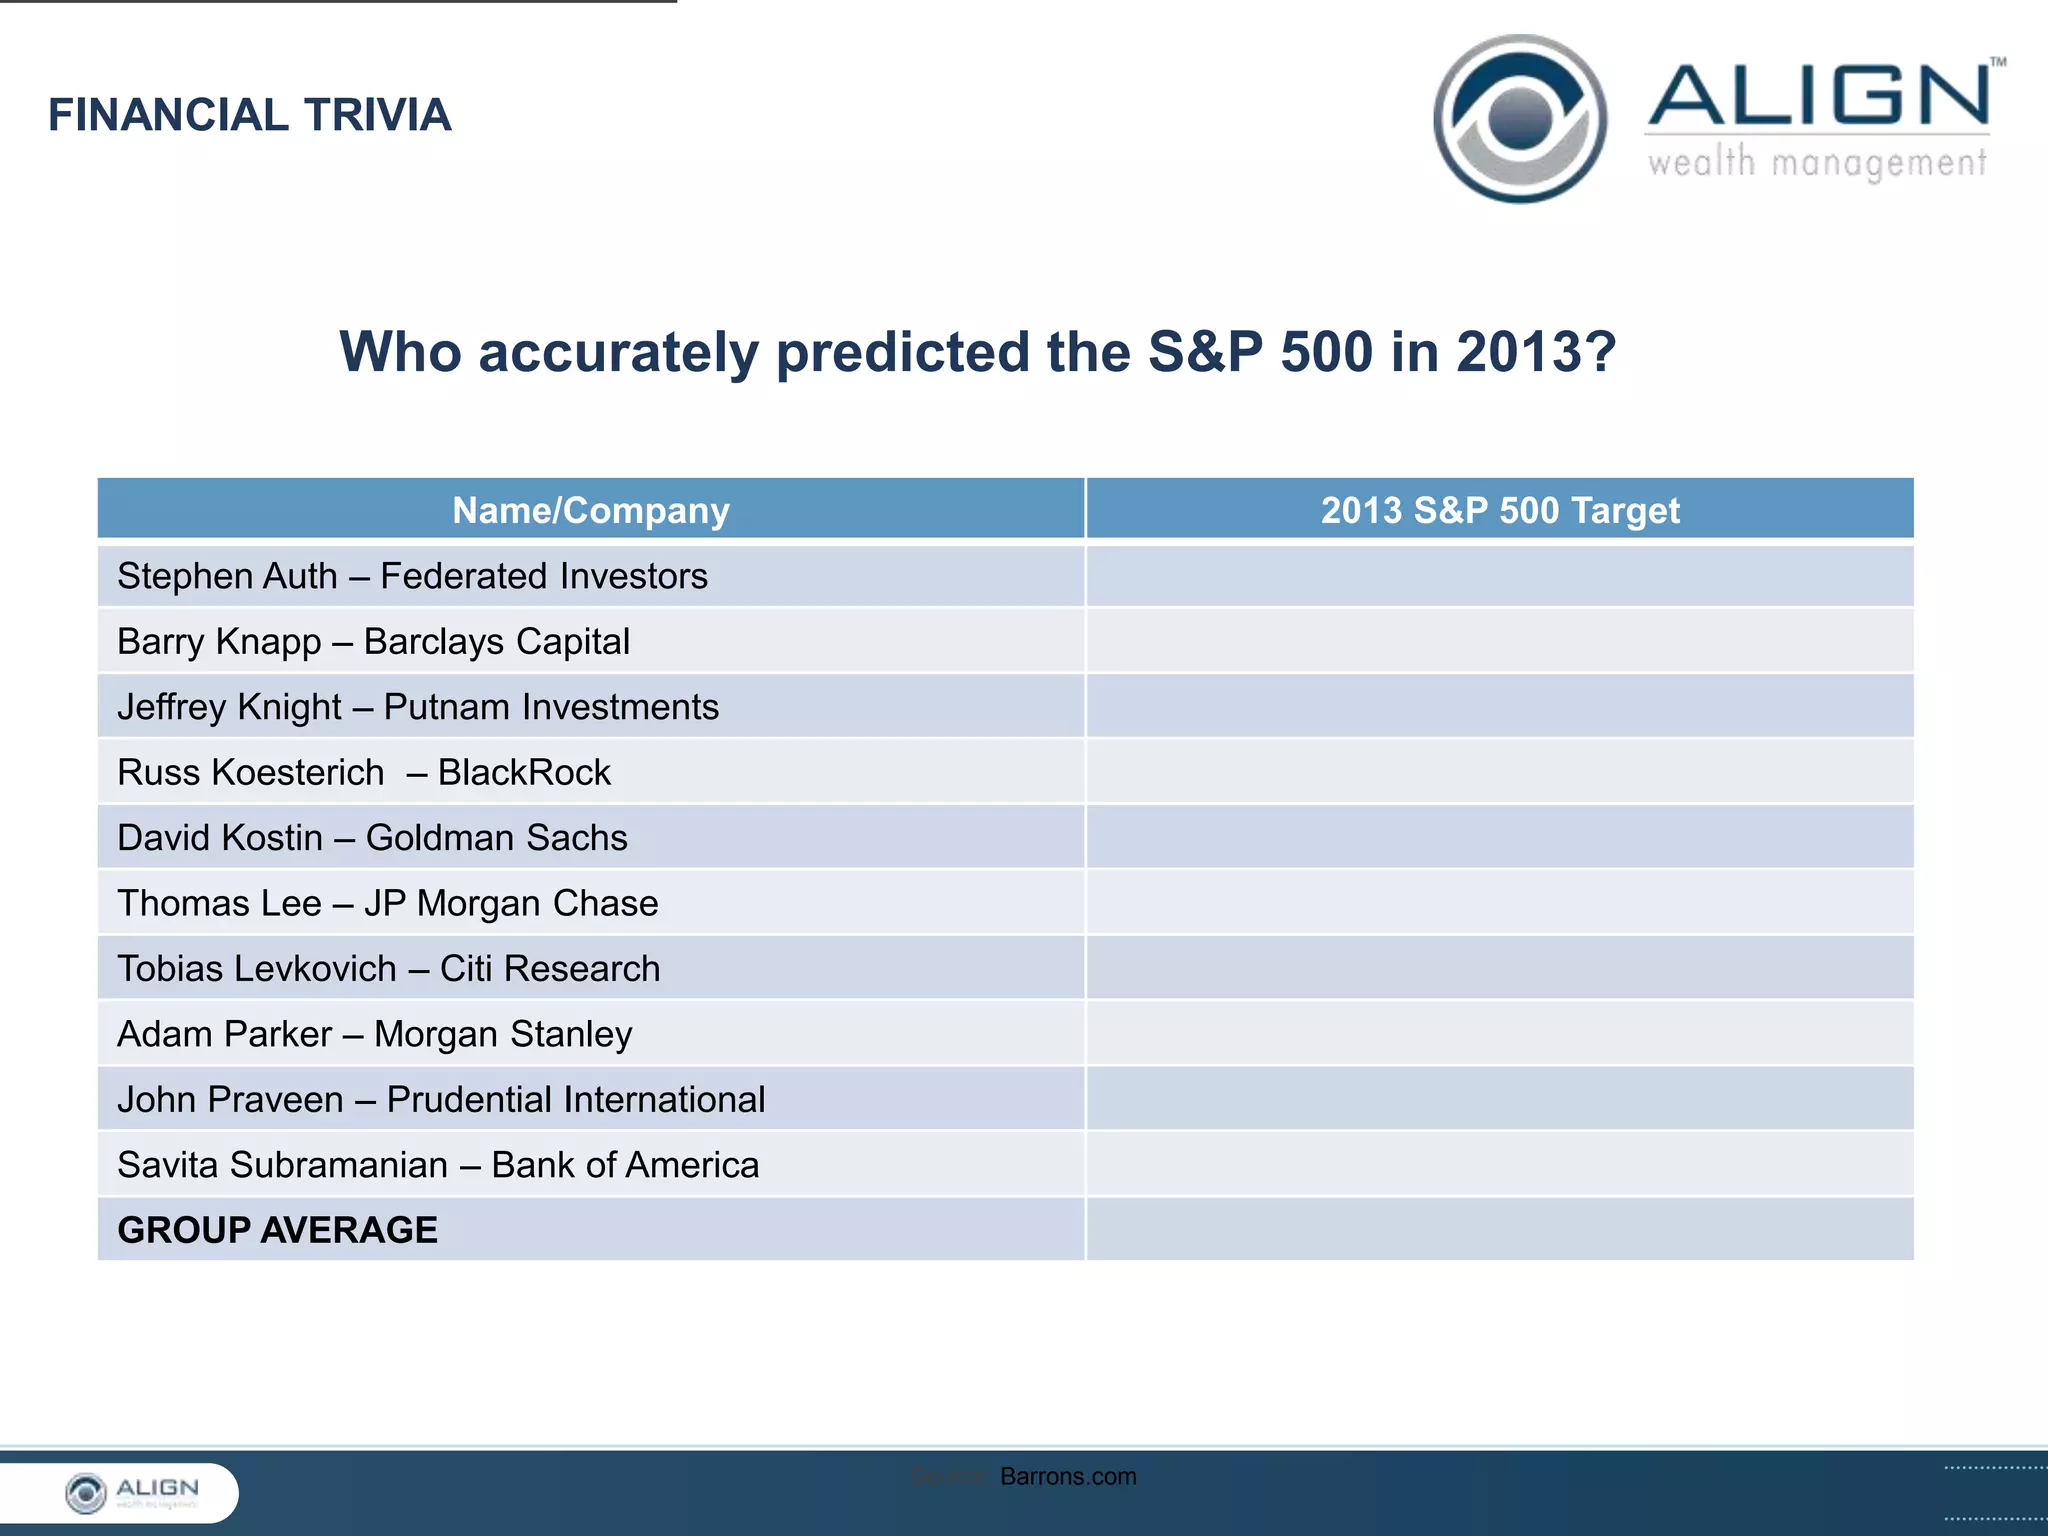
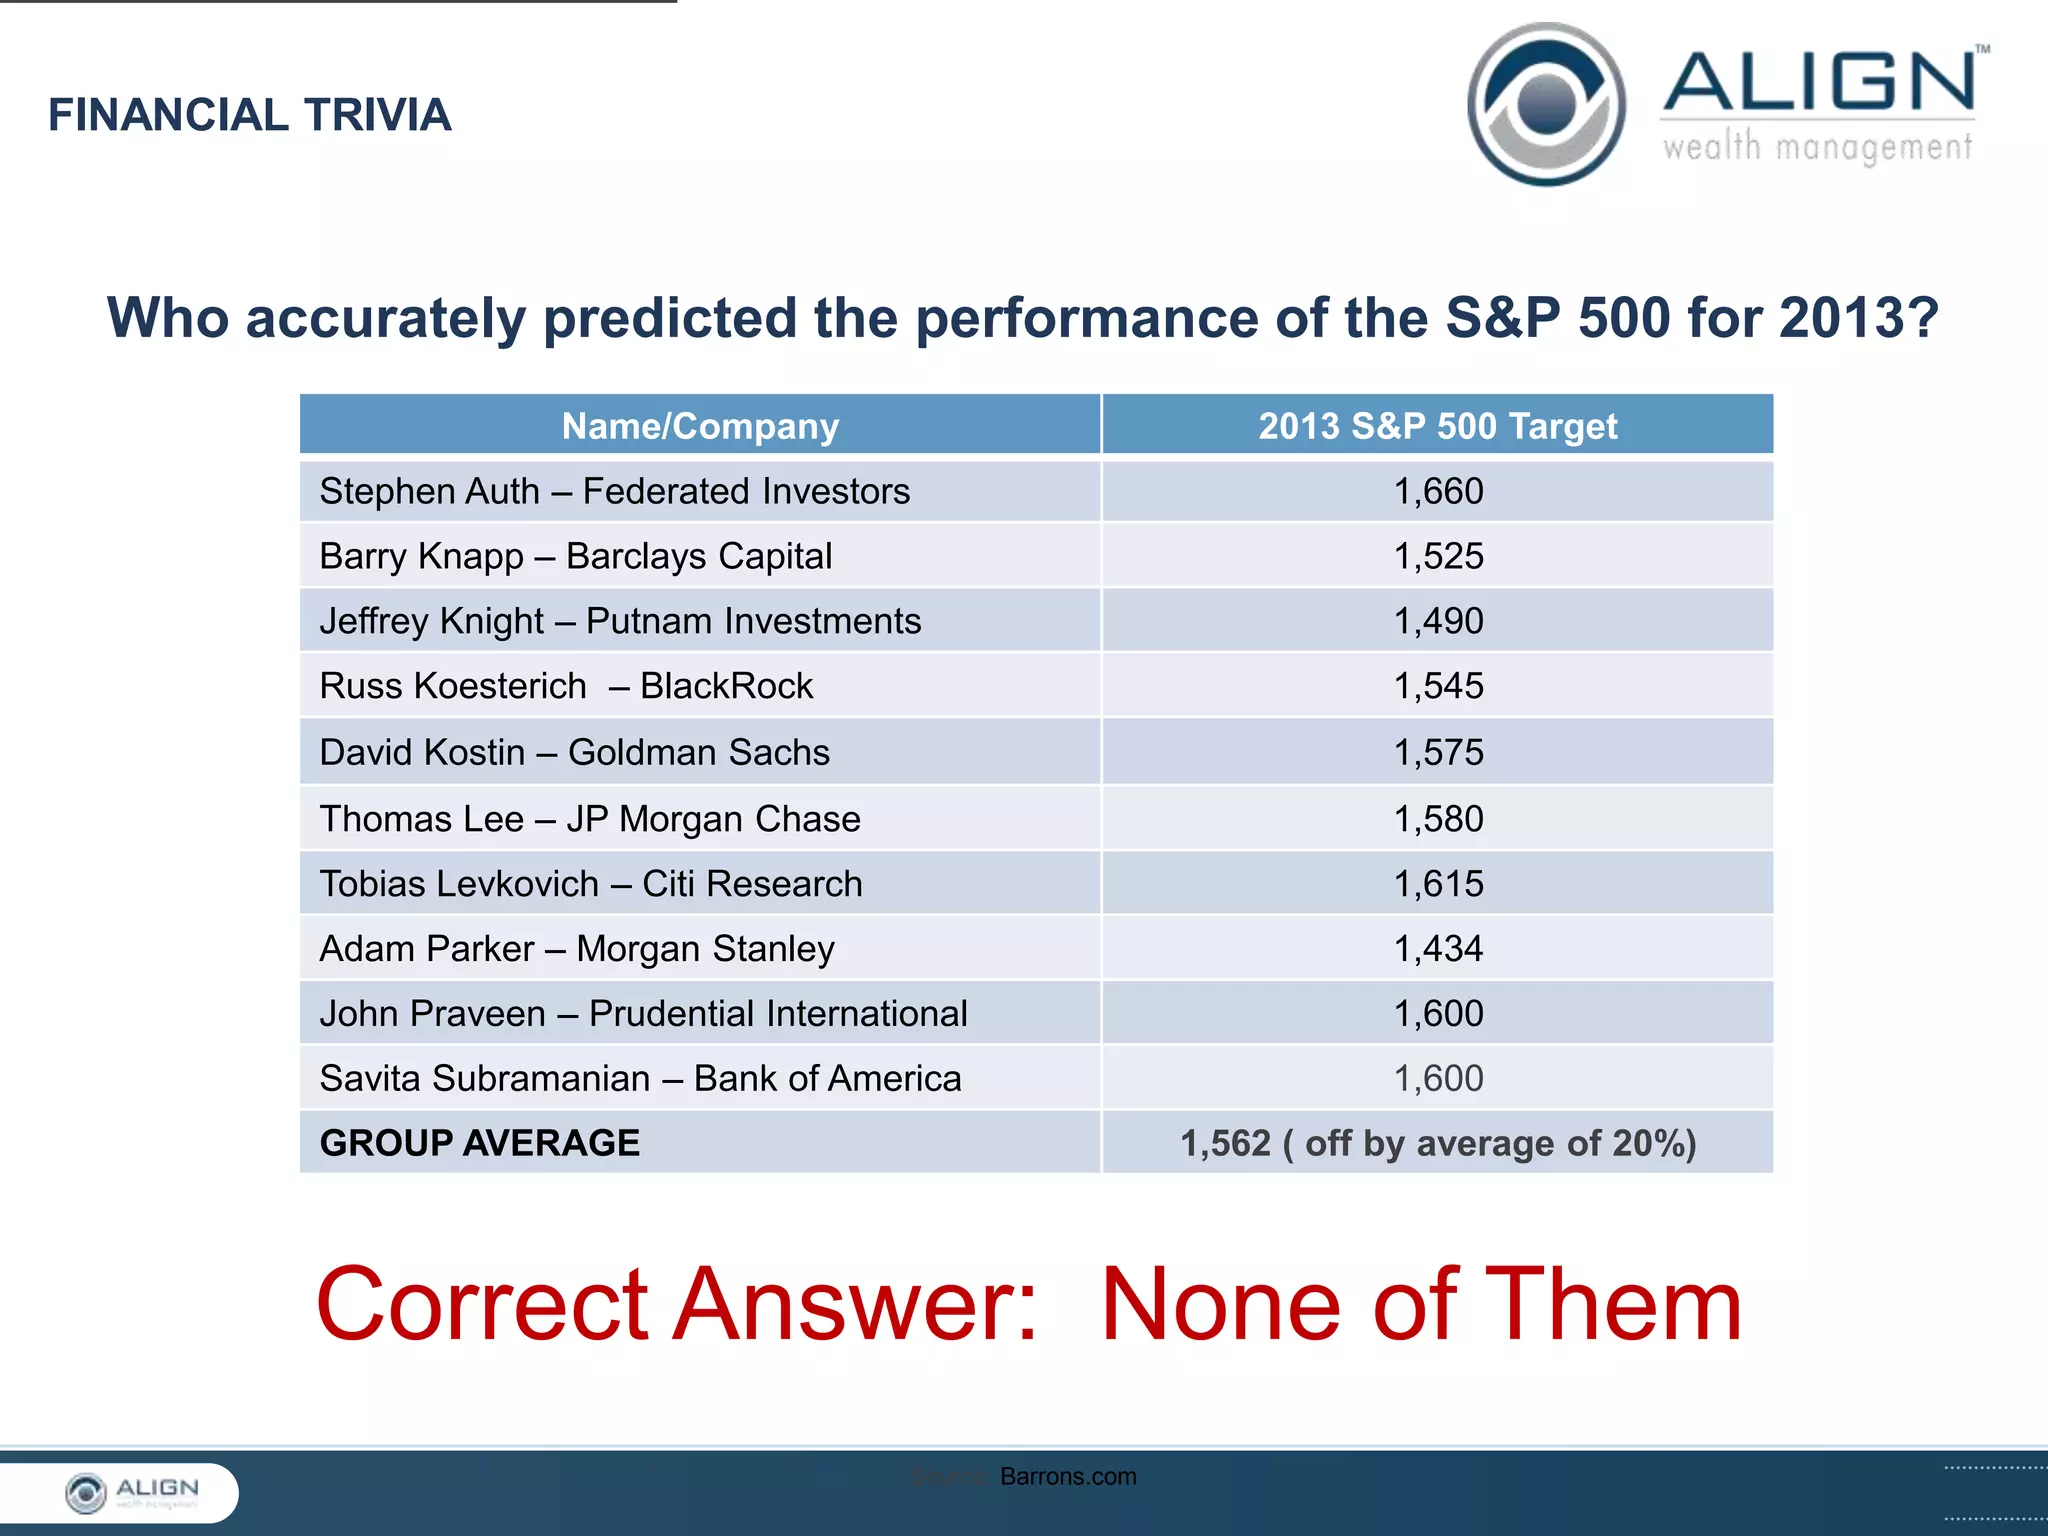
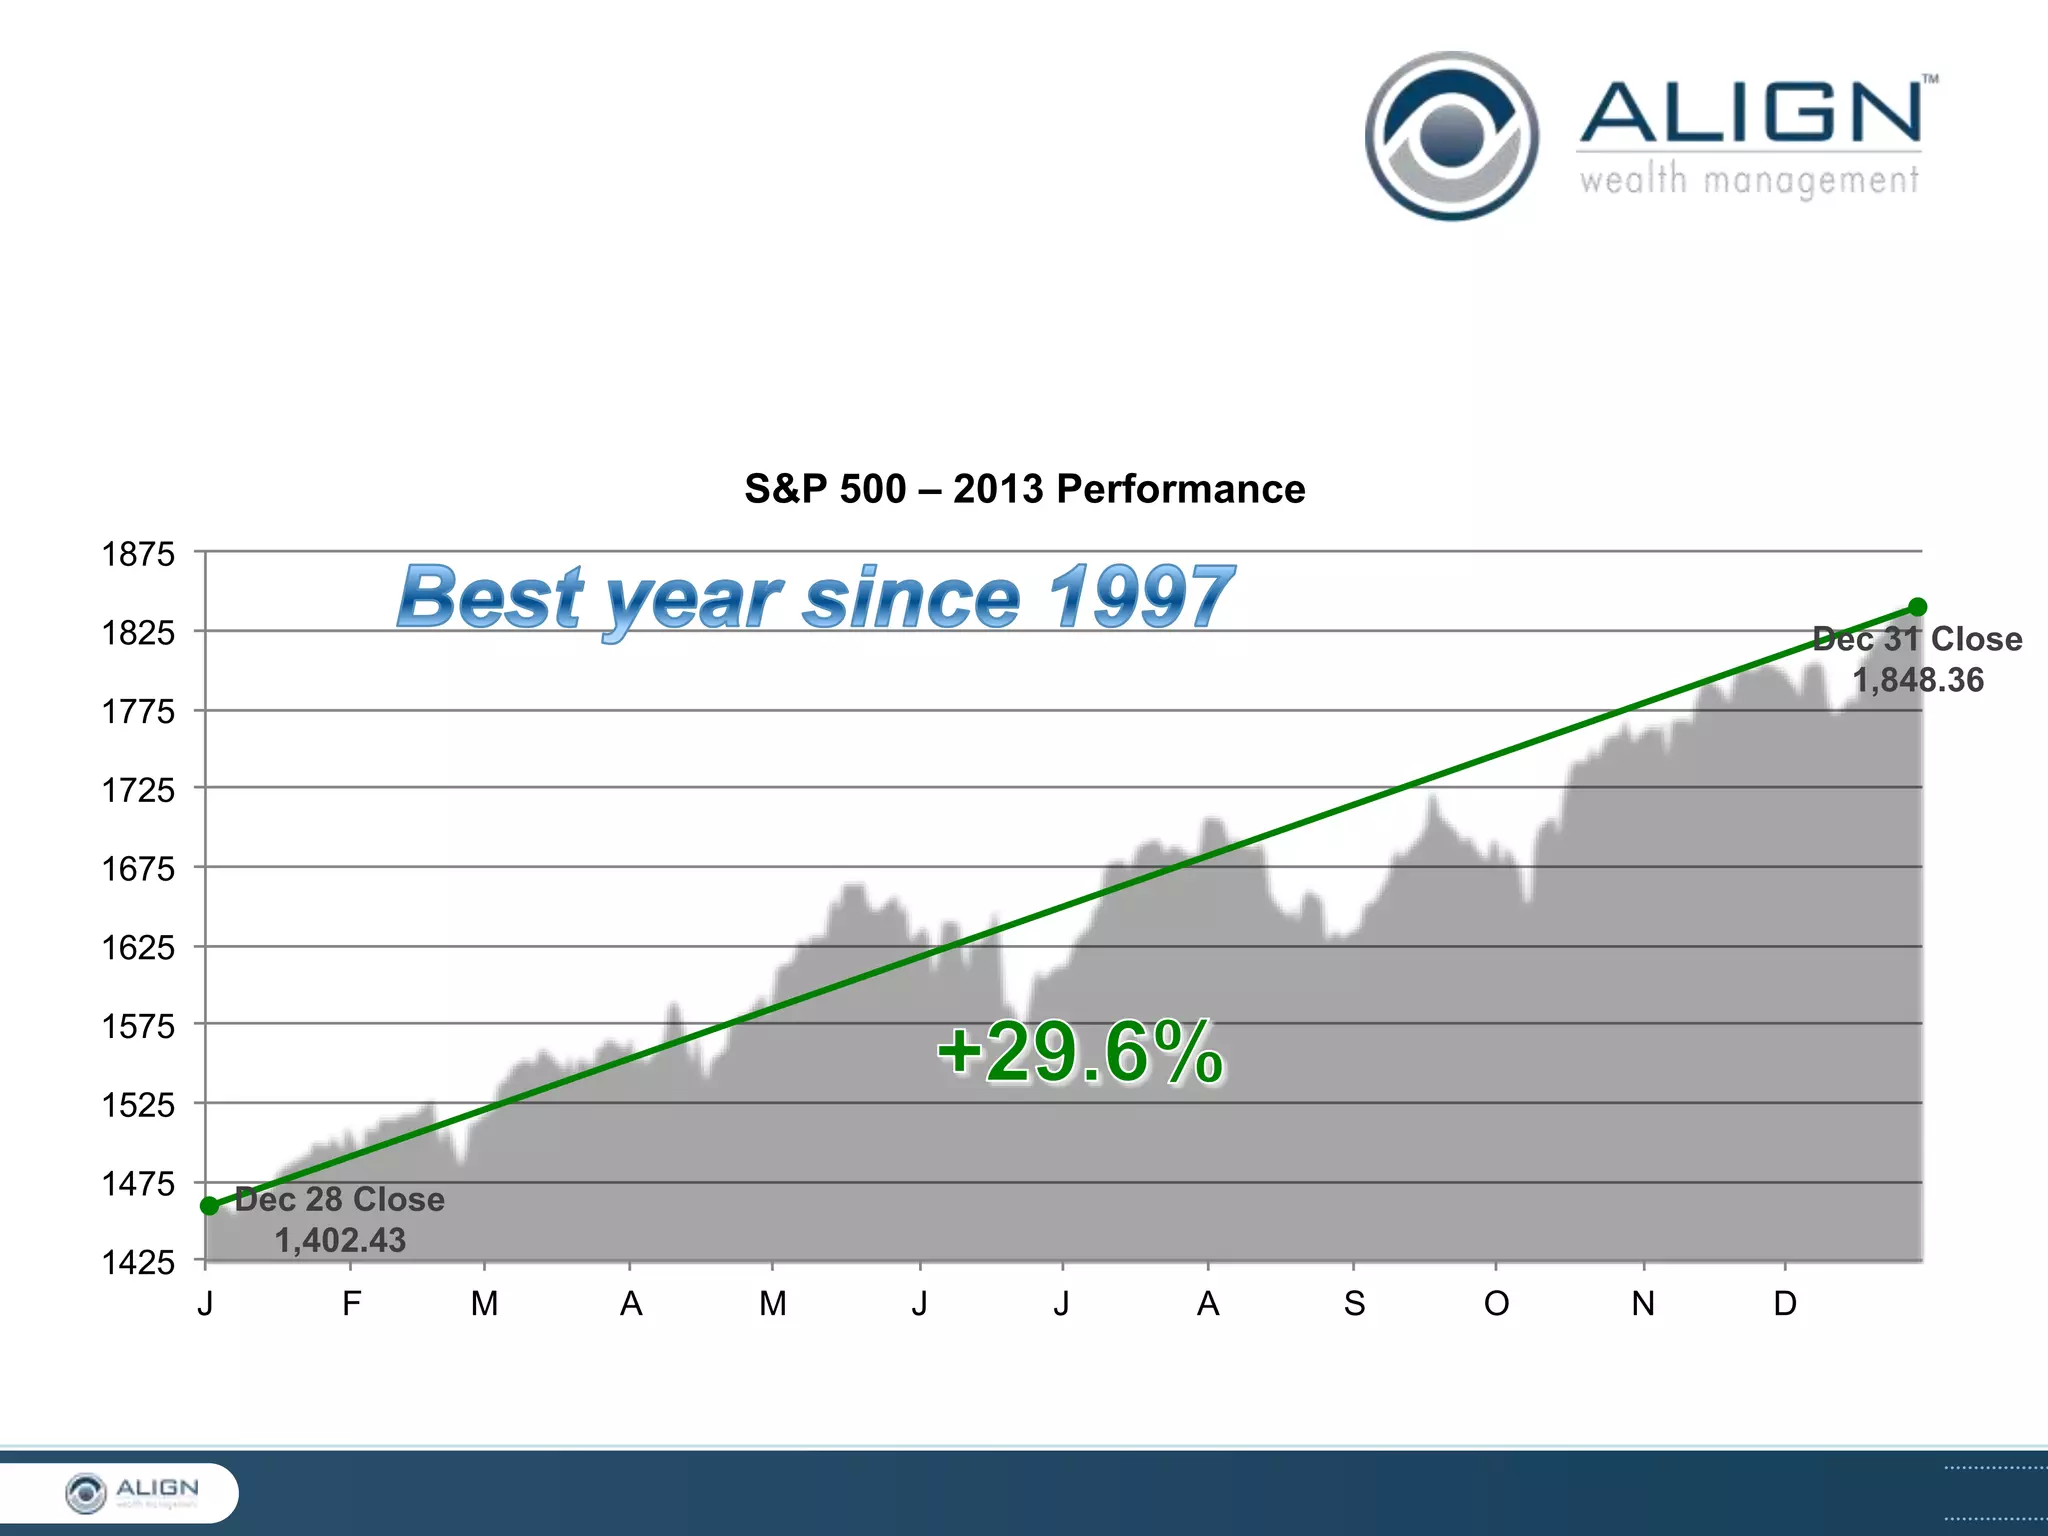
State
of the

Markets
2014
FINANCIAL TRIVIA

Who accurately predicted the S&P 500 in 2013? FORECASTS
Name/Company

2013 S&P 500 Target

Stephen Auth – Federated Investors
Barry Knapp – Barclays Capital
Jeffrey Knight – Putnam Investments
Russ Koesterich – BlackRock
David Kostin – Goldman Sachs
Thomas Lee – JP Morgan Chase
Tobias Levkovich – Citi Research
Adam Parker – Morgan Stanley

John Praveen – Prudential International
Savita Subramanian – Bank of America

GROUP AVERAGE

Source: Barrons.com
FINANCIAL TRIVIA

Who accurately predicted the performance of the S&P 500 for 2013?
Name/Company

2013 S&P 500 Target

Stephen Auth – Federated Investors

1,660

Barry Knapp – Barclays Capital

1,525

Jeffrey Knight – Putnam Investments

1,490

Russ Koesterich – BlackRock

1,545

David Kostin – Goldman Sachs

1,575

Thomas Lee – JP Morgan Chase

1,580

Tobias Levkovich – Citi Research

1,615

Adam Parker – Morgan Stanley

1,434

John Praveen – Prudential International

1,600

Savita Subramanian – Bank of America

1,600

GROUP AVERAGE

1,562 ( off by average of 20%)

Correct Answer: None of Them
Source: Barrons.com
"The only value of stock forecasters is to
make fortune-tellers look good.“
Warren Buffett
We do not have, never have had, and never will have
an opinion about where the stock market, interest
rates, or business activity will be a year from now.
Warren Buffett
Agenda
 Firm Update
 Align’s Approach

 Market Factors
 The Distinction: Volatility v. Risk
Align Wealth Management
Fiduciary Wealth Management
 Serving community of 1 3 0 C L I E N T S
 $ 1 8 5 M I L L I O N under management
 Over 2 0 Y E A R S O F S U C C E S S

Experience • Independence • Transparency

Our passion is helping you make
the most of your one financial life.
2013 SNAPSHOT

S&P 500 – 2013 Performance
1875
1825

Dec 31 Close
1,848.36

1775
1725
1675
1625
1575
1525
1475

Dec 28 Close
1,402.43

1425
J

F

M

A

M

J

J

A

S

O

N

D
Financial Headlines from 2013
“Rebirth of Equities Ain’t Necessarily So”
January 12, Financial Times
“Stock Markets Defy Economic Woes”
March 7, Financial Times
“Stock Market Optimism on This Scale Hard to Explain”
May 18, Financial Times
“U.S. Government Shutdown Battle Looms as Budget Woes Fester”
June 7, Wall Street Journal
“As Investors Rush in, Stocks Are Sending Warning Signals”
July 7, Wall Street Journal
“Lofty Profit Margins Hint at Pain to Come for U.S. Shares”
August 24, Wall Street Journal
“Get Ready For a Drop in Stock Prices”
October 7, Wall Street Journal
“Is This a Bubble?”
November 16, Wall Street Journal
9
A HISTORY LESSON

A History Lesson
% of Time
Stocks Up
Following Year

Average Gain
Following Year

Whenever market is up at least 20% for the year

64.5%

7.4%

All years other than when market gains more than 20%

65.9%

7.2%

Whenever market is up for the year

65.0%

8.4%

All years since 1896

65.2%

7.2%
Treasury Yields Nearly Doubled from Mid-Year Lows
10-Year U.S. Treasury Yield

3.1%

Data as of 12/26/2013

3.0%
2.9%
2.8%
2.7%
2.6%
2.5%
2.4%
2.3%
2.2%
2.1%
2.0%
1.9%
1.8%
1.7%
1.6%
Source: Federal Reserve

1.5%

Jan-13

Feb-13

Mar-13

Apr-13

May-13

Jun-13

Jul-13

Aug-13

Sep-13

Oct-13

Nov-13

Dec-13
BONDS
Barclays Aggregate Bond Index - 2013 Performance
58.5
58
57.5
57
56.5
56
55.5
55
J

F

M

A

M

J

J

A

S

O

N

D

Barclays Aggregate Bond Index (formerly the Lehman Brothers Aggregate Bond Index) includes U.S. government, corporate, and mortgage-backed securities with maturities of at
least one year. Past performance is no guarantee of future results. Indices are unmanaged and cannot be invested into directly.
Data Source: Google Finance. All data as of December 31st, 2013.
Why Own Bonds?

Why Own Bonds?

Barclays Agg Returns*

Starting 10yr Treasury Yield
25.0%

23.1%

Starting Yield / Return on Core Bonds

20.0%

14.4%

15.0%
10.6%
10.0%
6.4%
5.1%

4.6%

5.0%

0.0%
Aug '81 - Aug '82
S&P 500* (-23.4%)
Source: Litman Gregory Analytics. *Annualized Returns.

Mar '00 - Oct '02
S&P 500* (-22.52%)
Equity Market Declines

Oct '07 - Feb '09
S&P 500* (-40.25%)
Market Summary
2013 Annual Index Returns
US
Stock
Market

+32.39%

International
Developed
Stocks

Emerging
Markets
Stocks

+22.78%

STOCKS

-2.60%

Global
Real
Estate

+1.73%

US Bond
Market

Global
Bonds

-2.02%

1.42%

BONDS
Opportunistic Rebalancing

IPB p 27
Our Investment Philosophy

Our approach
in plain English
Evidenced-based Investing
Building a
Portfolio
Four Principles to
Our Discipline

Rather than try to outguess
the market, let it work for you

Leverage academic research to
master diversification

Engage only risks
worth taking

Customize Your Portfolio to
minimize risk, cost, tax
TODAY’S INVESTMENT CLIMATE

For Advisor Use Only
Yea, But What About the Taper?
What Do Higher Rates Mean?
RISING RATES AND STOCKS

1988: Rates up 3.25%
S&P 500 Stock Index
AGG Bond Index

+16.6%
+ 7.9%

S&P 500 Stock Index
AGG Bond Index

+ 1.3%
- 2.9%

S&P 500 Stock Index
AGG Bond Index

+ 21.0%
.8%

S&P 500 Stock Index
AGG Bond Index

+ 10.9%
+ 4.3%

1994: Rates up 3.00%

1999: Rates up 1.75%

2004: Rates up 4.25%

Source: UBS U.S. Equity and Derivatives Strategy 2014 Outlook
So, Where Are We Now?
S&P 500 Price

1773

S&P 500 Earnings

109

Current P/E Ratio: 16
Trend Line P/E:
15
So, Where Are We Now?

S&P 500 Earnings

S&P 500 Price

109

1773

S&P Earnings Yield:

6.1%

10-Year Treasury Yield:

2.7%
Volatility vs. Risk
Aren’t They the Same Thing?
A History of Declines
1946–2013

Decline

Number of Declines

Average

10% or more*

53

Annually

15% - 19%

21

Every 3 years

20% or more**

12

Every 5.5 years

*Average of -14.4%.

**Average of -29.3%

Source: Standard & Poor's
Standard & Poor’s
500 Stock Index
January 1946

18

February 6, 2014

1773
49
The S&P 500 has had a positive annual
return in 49 of the 68 calendar years
1946–2013 or 72% of the time.

Source: Standard & Poor’s
Percentage of Rolling Periods With Positive Returns
For The S&P 500, 1926 - 2013

729 of 998

827 of 950

847 of 890
$347,000,000
How much money did Warren
Buffett lose in the stock market
on October 19, 1987?
IPB p. 10
Portfolio Risk Levels
RISK LEVEL

INVESTMENT ALLOCATION

PORTFOLIO TYPE

1-Year Loss
Threshold

Probability
of Violating
Loss
Threshold

INVGRADE
BONDS

LARGECAP
STOCKS

SMALLCAP
STOCKS

FOREIGN
STOCKS

Conservative Balanced

-5%

2.2%

60%

30%

5%

5%

Balanced

-10%

1.4%

40%

40%

8%

12%

Equity-Tilted Balanced

-15%

0.9%

25%

50%

10%

15%

Equity

-20%

1.2%

0%

65%

15%

20%
IPB p. 5. 9,000 trading days
"I can't recall ever once having seen the
name of a market timer on Forbes'
annual list of the richest people in the
world. If it were truly possible to predict
corrections, you'd think somebody would
have made billions by doing it.“
-Peter Lynch
Fidelity Magellan Fund Manager
"Only liars manage to always be out
during bad times and in during good
times.“

-Bernard Baruch
BE WELL.

“…a one-day drop in equities of 1.5% is followed
by a ¼ % increase in hospital admissions on
average over the next two days.”

Source: March 2013 study by Joseph Engelberg and Christopher Parsons, associate professors of finance at the University of California at San Diego
Thank You

Align Wealth Management - State of the Markets 2014

  • 1.
  • 2.
    FINANCIAL TRIVIA Who accuratelypredicted the S&P 500 in 2013? FORECASTS Name/Company 2013 S&P 500 Target Stephen Auth – Federated Investors Barry Knapp – Barclays Capital Jeffrey Knight – Putnam Investments Russ Koesterich – BlackRock David Kostin – Goldman Sachs Thomas Lee – JP Morgan Chase Tobias Levkovich – Citi Research Adam Parker – Morgan Stanley John Praveen – Prudential International Savita Subramanian – Bank of America GROUP AVERAGE Source: Barrons.com
  • 3.
    FINANCIAL TRIVIA Who accuratelypredicted the performance of the S&P 500 for 2013? Name/Company 2013 S&P 500 Target Stephen Auth – Federated Investors 1,660 Barry Knapp – Barclays Capital 1,525 Jeffrey Knight – Putnam Investments 1,490 Russ Koesterich – BlackRock 1,545 David Kostin – Goldman Sachs 1,575 Thomas Lee – JP Morgan Chase 1,580 Tobias Levkovich – Citi Research 1,615 Adam Parker – Morgan Stanley 1,434 John Praveen – Prudential International 1,600 Savita Subramanian – Bank of America 1,600 GROUP AVERAGE 1,562 ( off by average of 20%) Correct Answer: None of Them Source: Barrons.com
  • 4.
    "The only valueof stock forecasters is to make fortune-tellers look good.“ Warren Buffett
  • 5.
    We do nothave, never have had, and never will have an opinion about where the stock market, interest rates, or business activity will be a year from now. Warren Buffett
  • 6.
    Agenda  Firm Update Align’s Approach  Market Factors  The Distinction: Volatility v. Risk
  • 7.
    Align Wealth Management FiduciaryWealth Management  Serving community of 1 3 0 C L I E N T S  $ 1 8 5 M I L L I O N under management  Over 2 0 Y E A R S O F S U C C E S S Experience • Independence • Transparency Our passion is helping you make the most of your one financial life.
  • 8.
    2013 SNAPSHOT S&P 500– 2013 Performance 1875 1825 Dec 31 Close 1,848.36 1775 1725 1675 1625 1575 1525 1475 Dec 28 Close 1,402.43 1425 J F M A M J J A S O N D
  • 9.
    Financial Headlines from2013 “Rebirth of Equities Ain’t Necessarily So” January 12, Financial Times “Stock Markets Defy Economic Woes” March 7, Financial Times “Stock Market Optimism on This Scale Hard to Explain” May 18, Financial Times “U.S. Government Shutdown Battle Looms as Budget Woes Fester” June 7, Wall Street Journal “As Investors Rush in, Stocks Are Sending Warning Signals” July 7, Wall Street Journal “Lofty Profit Margins Hint at Pain to Come for U.S. Shares” August 24, Wall Street Journal “Get Ready For a Drop in Stock Prices” October 7, Wall Street Journal “Is This a Bubble?” November 16, Wall Street Journal 9
  • 10.
    A HISTORY LESSON AHistory Lesson % of Time Stocks Up Following Year Average Gain Following Year Whenever market is up at least 20% for the year 64.5% 7.4% All years other than when market gains more than 20% 65.9% 7.2% Whenever market is up for the year 65.0% 8.4% All years since 1896 65.2% 7.2%
  • 11.
    Treasury Yields NearlyDoubled from Mid-Year Lows 10-Year U.S. Treasury Yield 3.1% Data as of 12/26/2013 3.0% 2.9% 2.8% 2.7% 2.6% 2.5% 2.4% 2.3% 2.2% 2.1% 2.0% 1.9% 1.8% 1.7% 1.6% Source: Federal Reserve 1.5% Jan-13 Feb-13 Mar-13 Apr-13 May-13 Jun-13 Jul-13 Aug-13 Sep-13 Oct-13 Nov-13 Dec-13
  • 12.
    BONDS Barclays Aggregate BondIndex - 2013 Performance 58.5 58 57.5 57 56.5 56 55.5 55 J F M A M J J A S O N D Barclays Aggregate Bond Index (formerly the Lehman Brothers Aggregate Bond Index) includes U.S. government, corporate, and mortgage-backed securities with maturities of at least one year. Past performance is no guarantee of future results. Indices are unmanaged and cannot be invested into directly. Data Source: Google Finance. All data as of December 31st, 2013.
  • 13.
    Why Own Bonds? WhyOwn Bonds? Barclays Agg Returns* Starting 10yr Treasury Yield 25.0% 23.1% Starting Yield / Return on Core Bonds 20.0% 14.4% 15.0% 10.6% 10.0% 6.4% 5.1% 4.6% 5.0% 0.0% Aug '81 - Aug '82 S&P 500* (-23.4%) Source: Litman Gregory Analytics. *Annualized Returns. Mar '00 - Oct '02 S&P 500* (-22.52%) Equity Market Declines Oct '07 - Feb '09 S&P 500* (-40.25%)
  • 15.
    Market Summary 2013 AnnualIndex Returns US Stock Market +32.39% International Developed Stocks Emerging Markets Stocks +22.78% STOCKS -2.60% Global Real Estate +1.73% US Bond Market Global Bonds -2.02% 1.42% BONDS
  • 17.
  • 18.
    Our Investment Philosophy Ourapproach in plain English
  • 19.
    Evidenced-based Investing Building a Portfolio FourPrinciples to Our Discipline Rather than try to outguess the market, let it work for you Leverage academic research to master diversification Engage only risks worth taking Customize Your Portfolio to minimize risk, cost, tax
  • 20.
  • 26.
    Yea, But WhatAbout the Taper?
  • 27.
    What Do HigherRates Mean? RISING RATES AND STOCKS 1988: Rates up 3.25% S&P 500 Stock Index AGG Bond Index +16.6% + 7.9% S&P 500 Stock Index AGG Bond Index + 1.3% - 2.9% S&P 500 Stock Index AGG Bond Index + 21.0% .8% S&P 500 Stock Index AGG Bond Index + 10.9% + 4.3% 1994: Rates up 3.00% 1999: Rates up 1.75% 2004: Rates up 4.25% Source: UBS U.S. Equity and Derivatives Strategy 2014 Outlook
  • 28.
    So, Where AreWe Now? S&P 500 Price 1773 S&P 500 Earnings 109 Current P/E Ratio: 16 Trend Line P/E: 15
  • 29.
    So, Where AreWe Now? S&P 500 Earnings S&P 500 Price 109 1773 S&P Earnings Yield: 6.1% 10-Year Treasury Yield: 2.7%
  • 30.
    Volatility vs. Risk Aren’tThey the Same Thing?
  • 31.
    A History ofDeclines 1946–2013 Decline Number of Declines Average 10% or more* 53 Annually 15% - 19% 21 Every 3 years 20% or more** 12 Every 5.5 years *Average of -14.4%. **Average of -29.3% Source: Standard & Poor's
  • 33.
    Standard & Poor’s 500Stock Index January 1946 18 February 6, 2014 1773
  • 34.
    49 The S&P 500has had a positive annual return in 49 of the 68 calendar years 1946–2013 or 72% of the time. Source: Standard & Poor’s
  • 35.
    Percentage of RollingPeriods With Positive Returns For The S&P 500, 1926 - 2013 729 of 998 827 of 950 847 of 890
  • 36.
  • 37.
    How much moneydid Warren Buffett lose in the stock market on October 19, 1987?
  • 38.
  • 39.
    Portfolio Risk Levels RISKLEVEL INVESTMENT ALLOCATION PORTFOLIO TYPE 1-Year Loss Threshold Probability of Violating Loss Threshold INVGRADE BONDS LARGECAP STOCKS SMALLCAP STOCKS FOREIGN STOCKS Conservative Balanced -5% 2.2% 60% 30% 5% 5% Balanced -10% 1.4% 40% 40% 8% 12% Equity-Tilted Balanced -15% 0.9% 25% 50% 10% 15% Equity -20% 1.2% 0% 65% 15% 20%
  • 40.
    IPB p. 5.9,000 trading days
  • 41.
    "I can't recallever once having seen the name of a market timer on Forbes' annual list of the richest people in the world. If it were truly possible to predict corrections, you'd think somebody would have made billions by doing it.“ -Peter Lynch Fidelity Magellan Fund Manager
  • 42.
    "Only liars manageto always be out during bad times and in during good times.“ -Bernard Baruch
  • 43.
    BE WELL. “…a one-daydrop in equities of 1.5% is followed by a ¼ % increase in hospital admissions on average over the next two days.” Source: March 2013 study by Joseph Engelberg and Christopher Parsons, associate professors of finance at the University of California at San Diego
  • 44.

Editor's Notes

  • #2 Welcome to our State of the Markets presentation. We’re delighted you’re here. We all have busy schedules - so thanks for taking the time!Before we get started, we’d like to go over a few housekeeping items. First,the restrooms are just outside - off the front lobby - so if you need to take a break, feel free to do so at anytime. As far as time, we’re going to try to keep our prepared remarks under an hour, depending on your questions. And, if you have any questions about what we are talking about, please raise your hand and ask that question. Chances are if you’re wondering something, someone else in the room is wondering the very same thing. Fair enough? Great. So as far as today’s agenda … we’re going to kick things off with some trivia just for fun. So everybody put on your thinking caps. Are we ready? We’re going to give away a prize to whoever gets the correct answer first.
  • #3 Read slide.
  • #4 As they do at the beginning of each year all the talking head from the big banks and brokerages make predictions for the year ahead and more often than not they’re wrong. And, this year they were way wrong. And, this should serve as lesson for all of us. No one – not even the brightest minds in finance – can predict what the markets are going to do. No one has a crystal ball. SOURCE: http://online.barrons.com
  • #6 And we agree with Mr. Buffett on this point. I assure you that we have no ability to predict the future—much less time the markets—and we don’t know of anyone who consistently can do those things. In fact, we don’t even know anyone who knows anyone who can successfully do those things. We also don’t know how to make investment policy out of chaos theory. Such as would be the case if we tried to make investment policy out of politics or macro economics. So we’re left to make investment policy founded on what we regard as reasonable probabilities based on the latest academic research regarding how capital markets really work and we apply that to your particular time horizon, risk tolerance, dollars and deadlines for you and your family’s goals and dreams. So that’s what we’ll be discussing today and that sets the stage for our agenda …
  • #7 First we’ll give you an update on the firm. Then, we’ll review 2013 market performance and our strategy. Then we’ll discuss some key factors affecting the economy & the financial markets. Finally, since we’ve had such a volatile year, we’ll finish with a discussion on the distinction between volatility and risk.So, we’ve had another exciting year at Align.
  • #8 And, that’s good because 2013 marked our 20th year anniversary. And, I think one of the main reasons we’ve been successful for so long, through so many good and bad markets, is that no matter what’s happened we’ve always remained committed to this notion of being client focused period. Of always doing for you what we would want done for ourselves if we were the client. In fact, for the record, we own the exact same investments that you do and our 401k plan owns the same investments also. And, I think its also helped that we’ve always fostered a culture of intellectual honesty at Align. Sure we’ve learned a lot over the past 20 years. But we know that we don’t know everything and we never will. Nobody can. So we’re always learning, always growing, always looking for better ways to serve you.
  • #9 So, it was a great year for stocks.The large cap S&P 500 rose 29.6% - its best annual performance since 1997.
  • #10 But you never would have known it if you paid too much attention to the media. Read slide.But then again, the media is always promoting the next end of the world - which never turns out to be the end of the world.
  • #11 Today, many investors are skeptical about whether or not the bull market will continue through 2014 – and as we said before we don’t have a crystal ball - so we don’t know if it will or not. But, we dug around for some history of what stocks have typically done following a year of strong performance. And this data goes back to 1896. So it’s a very long, very varied and therefore potentially very meaningful data set. Anyhow, as you can see, regardless of what the market has done in any given year over the past 117 years, stocks are basically up 65% of the time. This supports the investment principle that time in the market is more important than timing the market.
  • #12 Turning to bonds, the bond market turned in it’s worst performance in 20 years this year as the yield on the 10 year treasury almost doubled from May to September moving from a low of 1.7% in May to a high of over 3%. The good news is that the bond market seems to have priced in the taper of the Fed’s bond buying activities and rates have now settled back down to around 2.7% on the 10 year treasury bond.
  • #13 This is just a picture showing that as rates rose from May to September bond prices fell. But again, the bond market has stabilized quite a bit since then and bonds are actually off to a pretty good start in 2014. Up 1.5% in a little over a month.
  • #14 So, if bonds pay very little interest and can actually decline in value, then why own bonds at all? And, the main reason is that bonds provide a margin of safety when stocks decline. And, stocks go down all the time – they just don’t stay down. And, as this chart shows, when the market was down over 23% in 1981, bonds were up. During the tech wreck in 2000, when stocks were way down, bonds were up, and most recently in the Great Recession when stocks were down over 40%, bonds were up. So this dampening of the downside is the primary reason to own bonds.
  • #15 Another thing to point out is that a bad market in bonds is nothing like a bad market in stocks. This is a chart going back a quarter of a century showing that the worst year for bonds over the past 25 years occurred in 1994 (the year after I started in this business, when the Fed raised rates 6 times in one year) and bonds declined -2.9%. And, 2013 was the second worst year in bonds over the past 25 years. But the main point here is that a bad market in bonds is not nearly as bad as a bad market in stocks. We need only look back to 2008 for a reminder of why we might want to own some safe bonds.
  • #16 Now, as you know, we believe in extreme diversification, which is why our balanced portfolios are invested in 14 different asset classes, owning the stocks and bonds of over 12,000 companies and governments around the world. So, here are the returns of some of the primary asset classes that we invest in. READ SLIDE
  • #17 And, this is a busy slide, but these are the numbers for some of our more popular managed portfolios. Our Conservative Balance Portfolio (40% stocks) was up 7.1% in 2013 and our Equity portfolio (100% stocks) was up 24% in 2013. All these numbers are net of fees and are right in line with where we’d expect them to be as we have about half of our equity weighting allocated to US stocks and the other half allocated to international stocks - which didn’t do as well as US stocks last year. We also have a weighting to bonds in our balanced portfolios and, as noted, bonds had a rough 2013. But again, I think it’s safe to say that we all know that we will have another bear market in stocks and when that happens we’ll be glad we own some high quality bonds to help protect against the downside. Also, owning short term high quality bonds will also give us some dry powder with which to pick up stocks at lower prices when stocks decline.
  • #18 Now, we don’t time markets but we do stay alert for good rebalancing opportunities where we sell assets that have done better than expected and buy assets that have done poorer than expected, thus selling high and buying low. And, this is on page 27 of the IPB in front of each of you. And, because markets often move in short bursts over just a few days, our rebalancing process is a daily task. That’s not to say that we rebalance everyday – we don’t. But we do monitor every day and we are always on the lookout for rebalancing opportunities. Some years this may lead to only one or two rebalancing trades. Some years, like 2008, it may lead to lots of rebalancing trades. But, its all a matter of paying attention to your portfolio and bringing it back to target when it drifts too far out of balance. So this year, with US stocks shooting the lights out and emerging markets and TIPS performing worse than expected, we are selling US stocks to bring them back down to target and buying emerging stocks and tips to bring them back up to target. Again, selling high to lock in gains and buying low.
  • #19 And, you may have already read our Investment Philosophy, but we’d encourage all of you to take this with you and review it and contact us with any questions you might have. Because we are committed that you know what you own, why you own it, and how its all working together.
  • #20 But, in a nutshell, our approach is to combine the latest academic research with our decades of experience to create an investment plan that is customized to achieve your particular goals - while minimizing risk, cost, and tax.
  • #21 Now lets talk a little about the current investment climate.
  • #22 The good news is that our economy has improved tremendously. As we all know, housing was a major cause of the Great Recession and the fact of the matter is that housing is improving. Combine a stronger housing market with a surging stock market and its no surprise that Household Net Worth has broken into new high territory.
  • #23 And, households have been paying down debt thereby liquefying their balance sheets so that household balance sheets are stronger than they’ve been since 1980. Combine lower debt levels with higher home values and bigger 401ks and consumers are feeling wealthier than they have in many years and they are starting to spend more $ buying more goods and services from the great companies that you own in your portfolio.
  • #24 And, despite how irrational governments have been, the great companies of the world have executed rational business plans in a brilliant fashion. This chart shows how the great companies have built up their cash reserves to levels not seen since the 1950’s.
  • #25 At the same time, we’re seeing record earnings per share and profit margins. And, companies are achieving these results with a dramatic decrease in corporate debt.
  • #26 And, this chart shows that after sensibly deep cuts in the depths of the financial crises, dividends are rising to record levels. And, remember the previous chart that showed that even after these big dividends increases, companies have more cash with which to increase dividends even further. And, if stocks are such a terrible investment - as the media might have us believe - then why are the cash rich great companies of the world repurchasing their own shares at such a hungry rate? The main point we want to make with these last few slides is that we would encourage all of you to focus on the companies rather than on geopolitics, domestic politics and/or the macro economy. For as irrational as governments can be, the great companies have shown that they can excel in a rational way. That they can succeed in spite of the dis-function in Washington.
  • #27 So now lets talk about the taper. Everyone is talking about what it may mean for the Fed to reduce its bond buying activities. For the record, the taper of the Fed’s quantitative easing program is well underway. On December 18, the Fed decided to taper its QE policy by $10 billion per month, to $75 billion. On January 29, the Fed announced that it would taper quantitative easing by another $10 billion per month to $65 billion. Currently, the consensus is that the Fed will continue to reduce its QE program through 2014 and ultimately wind it up by the end of the year. However, this isn't necessarily a guarantee and the appointment of Janet Yellen probably means that low rates are here until we have very strong economic growth or a rapid rise in inflation or both.
  • #28 So are higher rates really something that should concern you? I mean, if you think about it, this whole scheme of cheap easy money and low interest rates has punished the saver and rewarded the borrower. Higher interest rates may actually be a good thing for the thrifty saver and a bad thing for the spendthrift borrower. But I digress. To put things in perspective, we went back and looked at all the rising rate environments over the past 25 years and compared that to what happened in the financial markets.READ SLIDEWhile past returns are by no means a guarantee of future results, we can see from these examples that interest rate hikes don’t necessarily mean calamity for stocks and bonds – contrary to what the media might lead you to believe. Remember, the media is always selling the next end of the world. Which of course, never turns out to be the end of the world.
  • #29 Trend line PE since 1871. Source: Stocks for the long run Jeremy Siegel. Bottom line:They’re no longer giving shares away, but stocks are not absurdly overvalued either.
  • #30 And, historically speaking, stocks are rarely this cheap as compared to bonds. So, again, they ain’t given shares away any longer but there is no solid argument that stocks are way over valued either.
  • #31 Now, nothing we’ve discussed means that stocks can’t go down from here. And, while we hope you found the discussion interesting, the fact is that none of the data we’ve talked about today is news (real news – surprising news) to the market. Everything we’ve covered is publicly available data that is already reflected in the prices of publicly traded securities. Only news, real news, surprising news, moves the prices of publicly traded securities. The fact is that stocks go down all the time, they just don’t stay down. The declines are temporary and the advance is permanent.This lead us to a discussion of the distinction between Volatility Vs. Risk. Of how they are similar—and of how they may differ in very important ways. And, one of the ideas I’ll suggest is that the effect of volatility on the investor’s decision-making depends on the element of time. And, in investing, patience is a virtue.
  • #32 Here’s a chart of data provided by Standard & Poor’s of the period 1946—the first full year after World War II—and 2013. It shows the frequency of significant price declines in the S&P 500 Stock Index. What you see is that in 68 years there’ve been 53 intra-year declines of 10% or more. Even more important to the conversation we’re having today, I think, is the fact that the average intra-year decline in these 68 years was about 14%.And then the story gets even worse, doesn’t it? For you see that there have been 21 declines of at least 15% or more—that is, an average of one every three years. And 12 declines of at least 20% or more, or one about every 5½ years, and the average of those is actually closer to 30%.
  • #34 Can you imagine wanting to own an investment whose history, over the last two-thirds of a century, was to invite you to watch an average of 30% of your capital melt away on an average of every 5 years or so? WHY WOULD ANYONE WANT TO DO THAT?Well, I can actually think of a couple of reasons. Here, in its most stark simplicity, is the big reason.From the beginning of 1946 through September 2013, the Index went from about 18 to over1700. And, with dividends compounded, the average annual return on the Index—even amid all that horrific volatility—was about 10% per year. Now, the second reason is this …IN HOW MANY OF THOSE 68 YEARS 1946–2013 WOULD YOU GUESS THAT EQUITIES PRODUCED A POSITIVE RETURN?(Wait for guesses, then click mouse)
  • #35 SLIDE FOUR:And here, I think, we begin closing in on the nub of the issue. Because in these two slides, we see that—despite their very significant volatility—equities have not only produced attractive returns over a long period of time, but that they have produced positive returns the great majority of the time—over 70% of full calendar years. If there’s a lesson to be drawn from this—and I believe there is—it’s that, at least over the particular two thirds of a century we’ve been looking at, VOLATILITY HAS BEEN DEFEATED BY TIME. Specifically, the declines were temporary while the advance was permanent. Now , I cannot stress enough that as long and as potentially credible as these 68 years may have been, THEY DON’T PROVE ANYTHING. Because, NOTHING IN THE PAST PROVES ANYTHING ABOUT THE FUTURE. Heck we can’t even prove the sun’s coming up tomorrow or that you’ll be here to see it. But this is the historical record.
  • #36 And, this chart shows all the 1, 5, and 10 year rolling periods starting at the end of each month going back to 1926. So, again, the longer your time horizon, the less the risk of owning stocks.
  • #37 Let me make this point another way.The number is three hundred forty-seven million dollars. And what is its significance, you ask? I’ll tell you: IT IS THE AMOUNT BY WHICH WARREN BUFFETT’S PERSONAL SHAREHOLDINGS IN BERKSHIRE HATHAWAY COMMON STOCK DECLINED IN VALUE IN ONE DAY. BLACK MONDAY, OCTOBER 19, 1987. At the end of the single worst day in the history of American stock prices—when the broad market declined 23% between sunup and sundown—the value of Buffett’s personal shares in his company declined by $347 million. So does everybody have this? Ok, then, here’s another little quiz.
  • #38 Read slide out loud and wait for answersMost of you seem to be saying that he didn’t lose anything. I agree, but first: how did you arrive at that conclusion?Of course he didn’t lose anything because (a) HE DIDN’T SELL and (b) THE DECLINE WAS TEMPORARY.The lesson: have a plan that you believe in so much that you will not abandon it when stocks decline - which they do all the time. Stocks go down but they don’t stay down. No panic, no sell. No sell, no lose.
  • #39 So now lets talk about how build portfolios to reduce the risk you are taking. We own 14 different asset classes and the main idea is that we want asset classes that do not move in tandem. The idea is to combine asset A with asset B so that when one goes down the other goes up to give you a smoother ride toward your financial goals. This is the hardest thing for clients to accept. But the idea is like an 8 cylinder engine. 4 pistons go up while 4 pistons go down and the car moves forward nicely. And, so it is with your portfolio.
  • #41 But why not just get in when stocks are about to go up and get out when they’re about to go down? Sounds great in theory but it just doesn’t work in the real world. This is the folly of market timing. There is no evidence that anyone has ever been able to reliably predict in advance when to be in the market and when to be out of it. If that were in fact possible, don’t you think that all those analysts and consultants and gurus would be quietly getting rich for themselves on the sidelines, rather than trying to get dollars from you? Investment managers have studies showing you, after the fact, how their models would have correctly predicted when to be in the market and the when to be out of it, but none of those models work consistently in advance. Investors who want to time the markets are trying to essentially predict the future, which is impossible. These investors think about missing the “worst” days, but what if they miss the “best” days? This chart shows what would happen if an investor tried to time the market, but missed the best trading days. The “best trading days” are based on gains as measured by the S&P 500 over the 20-year period ended December 31, 2012.1
  • #43 Barook. Legendary investor and advisor to several US Presidents, Woodrow Wilson, FDR, and Harry Truman.
  • #44 We want our clients – and all of the guests here today – to be healthy and happy in 2014. Sadly, some people watch CNBC far too much, and worry about the stock market and the economy so much that it damages their health. According to a March 2013 study by professors of finance at the University of California at San Diego, A one-day drop in equities of around 1.5% is followed by about a 0.26% increase in hospital admissions on average over the next two days. PLEASE don’t let this be you. We will keep an eye on the markets for you and you go enjoy your lives.
  • #45 Let me conclude by expressing again just how much we appreciate your continued trust and confidence. Please know that we’ll do our best to continue to earn it.Thank you.