Download to read offline


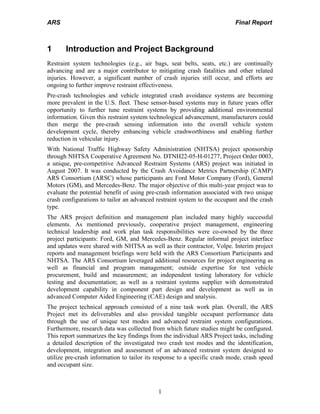


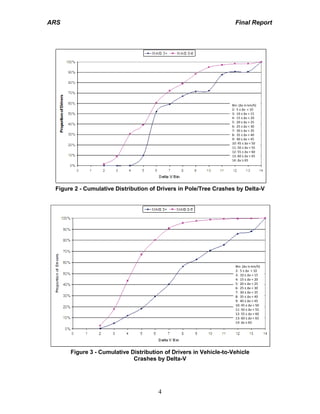


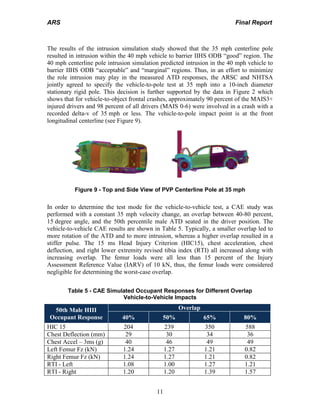


This document presents the final report of the Advanced Restraint Systems project conducted by Ford, GM, and Mercedes-Benz. The project evaluated using pre-crash sensing information to tailor restraint systems to the occupant and crash type. Two crash modes were studied - a vehicle-to-vehicle impact and a vehicle-to-pole impact - at two speeds each. In total, 24 load cases were analyzed for different occupant sizes and positions. Computer modeling and vehicle crash tests were conducted to develop and evaluate prototype advanced restraint systems. The systems included airbags, seatbelts, and seats with features that could be adapted based on pre-crash information to improve occupant protection for various scenarios. Component testing supported the hardware development


![DESIGN AND FABRICATION OF THE IBM 90-90 SEAT BELT CLAMP KIA VEHICLE[1].pptx 2...](https://cdn.slidesharecdn.com/ss_thumbnails/designandfabricationoftheibm90-90seatbeltclampkiavehicle1-260116160442-70ff67fc-thumbnail.jpg?width=640&height=640&fit=bounds)


