Download to read offline


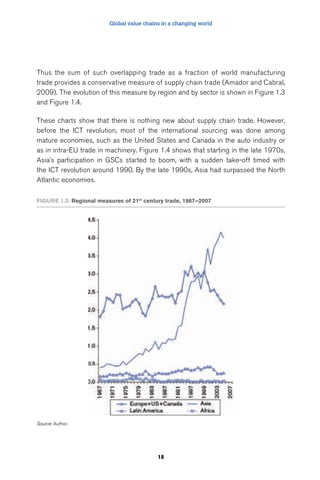


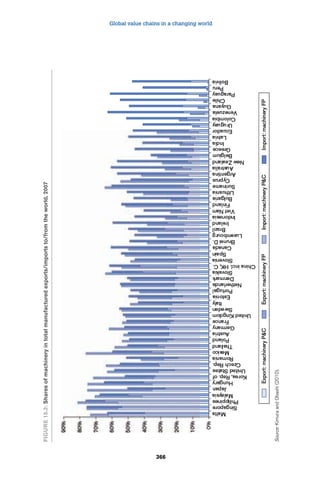
![Global value chains in a changing world
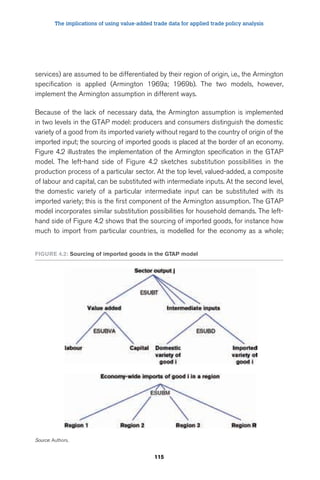
services and cross-border procedures. While the East Asia region is well ahead of
the rest of developing Asia in this respect, there is still a wide margin of progress
in order to close the gap with best international practices, particularly in terms of
administrative arrangements.
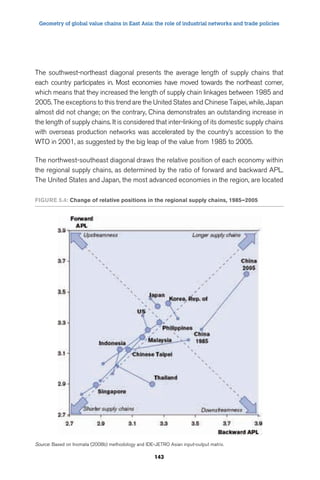
Appendix 5.1. Technical note on average
propagation length
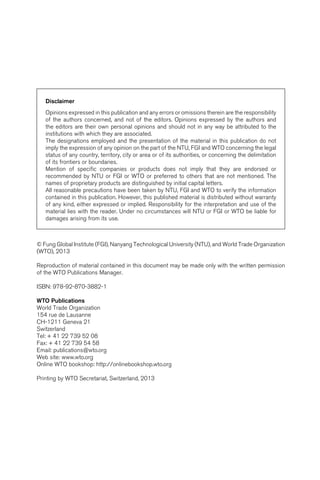
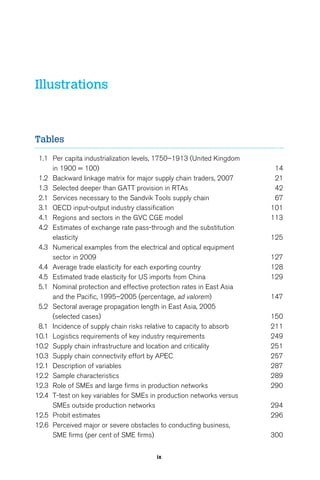
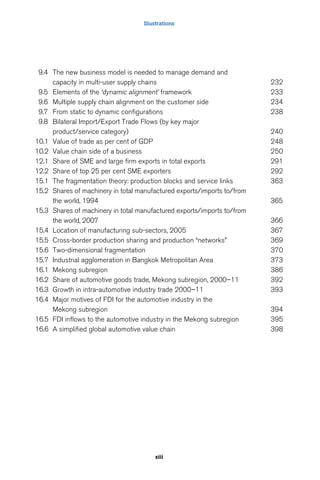
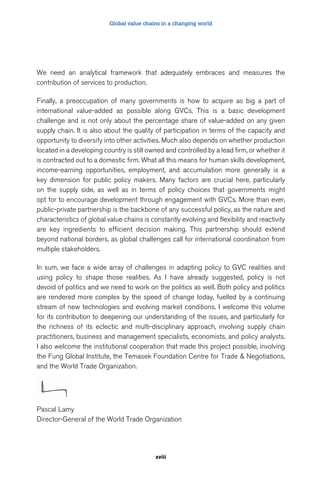
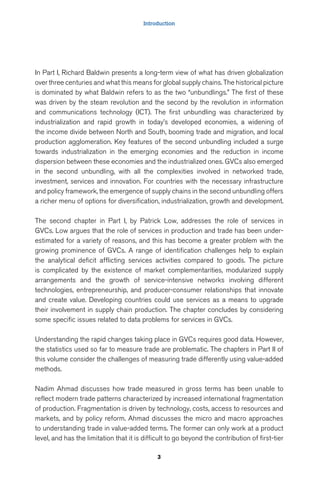
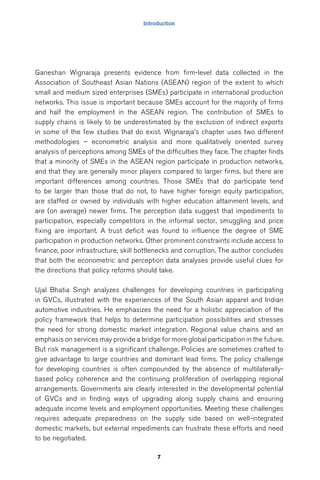
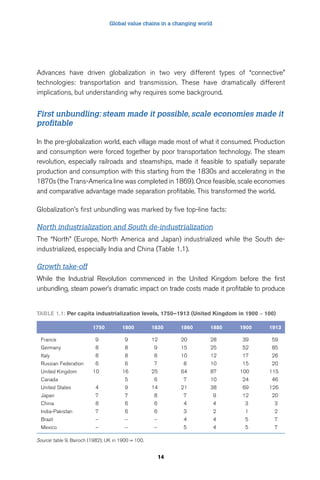
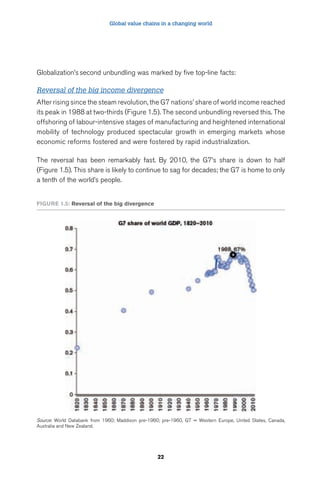
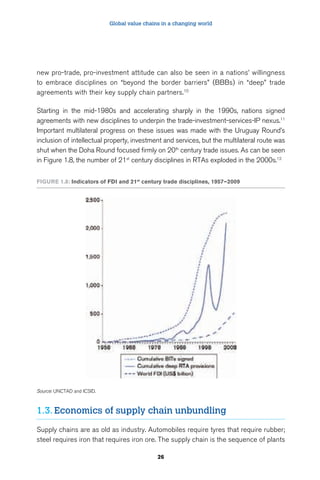
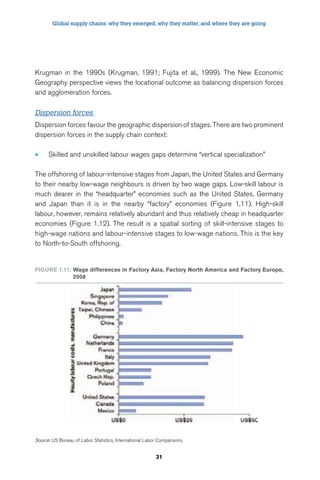
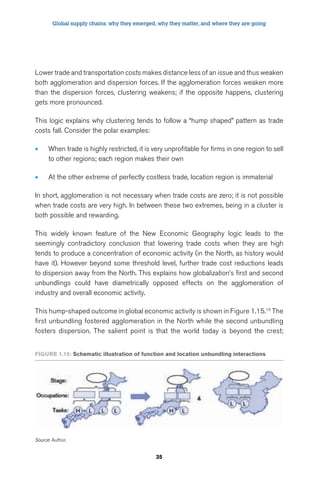
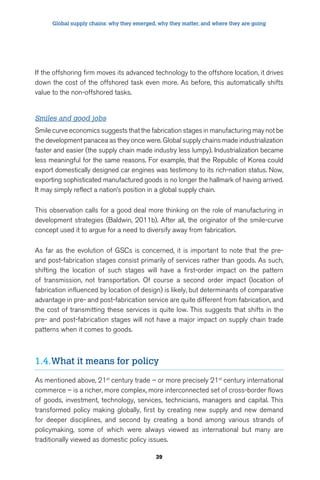
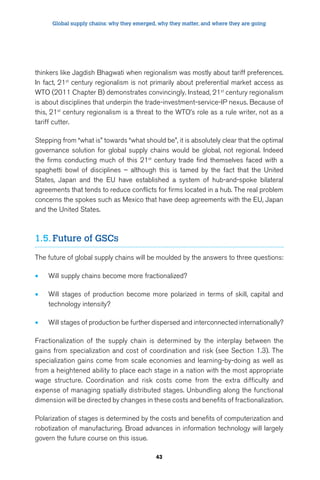
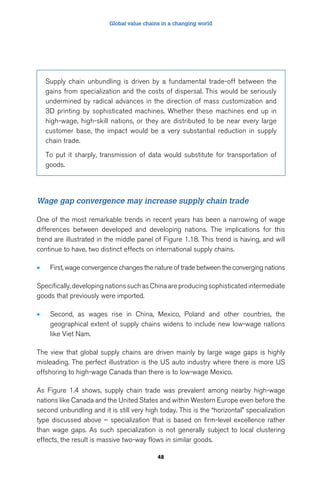
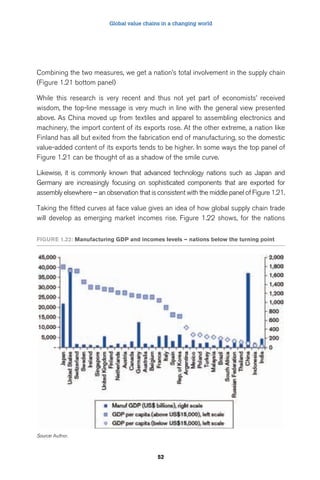
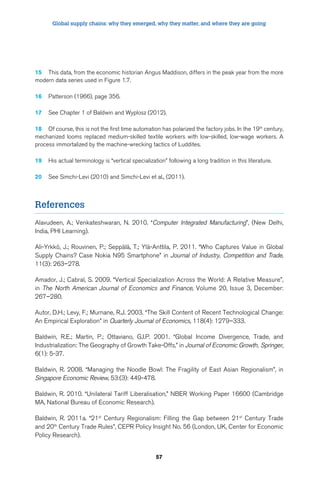
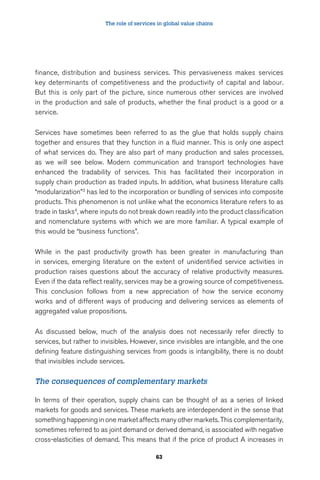
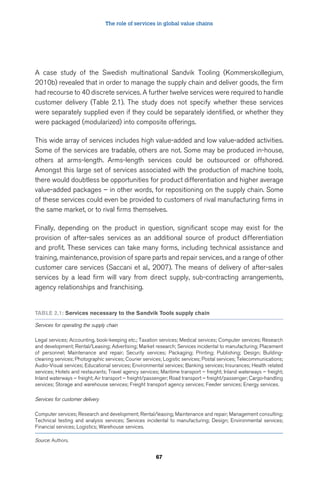
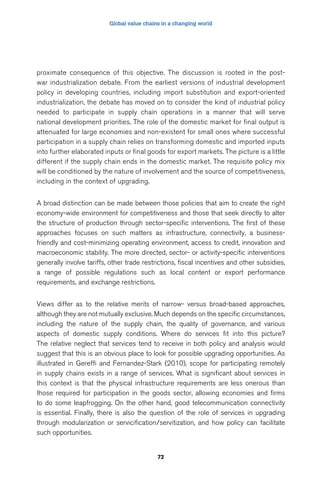
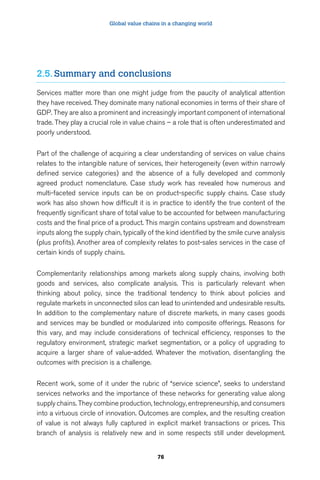
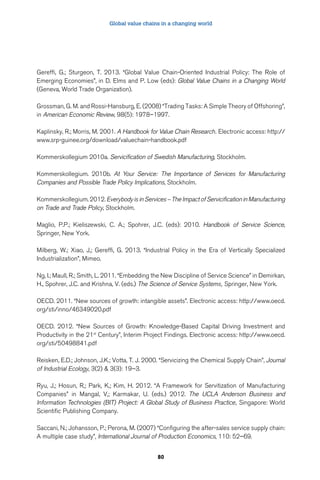
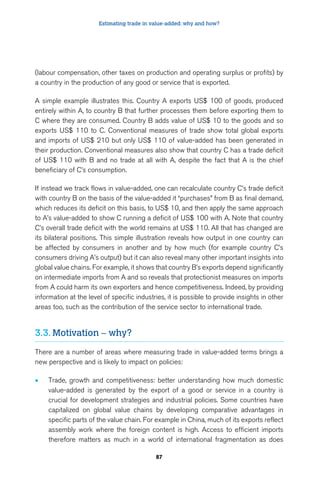
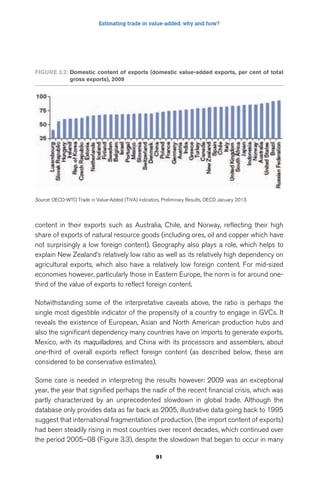
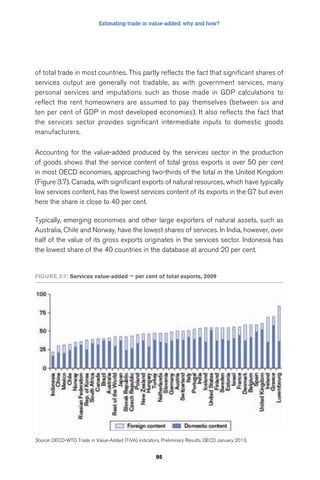
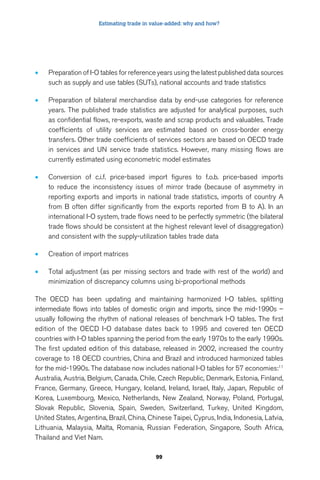
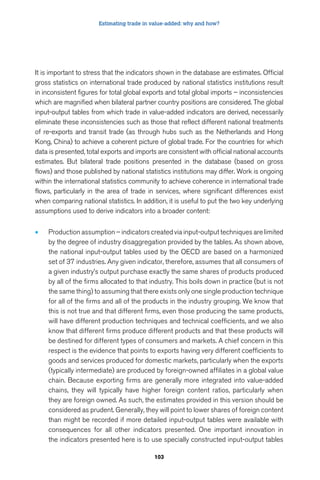
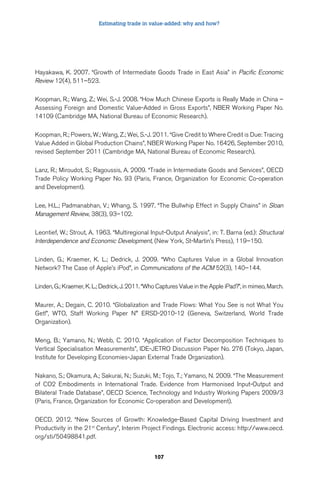
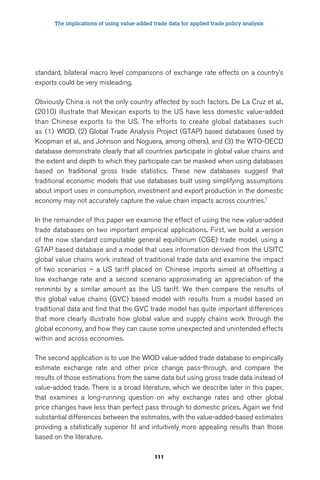
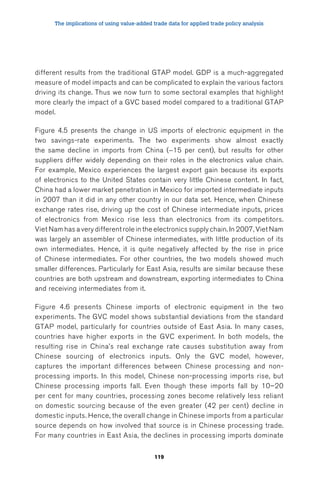
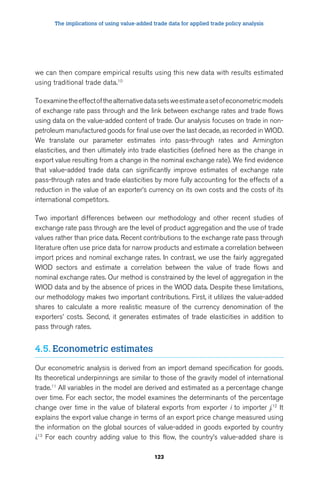
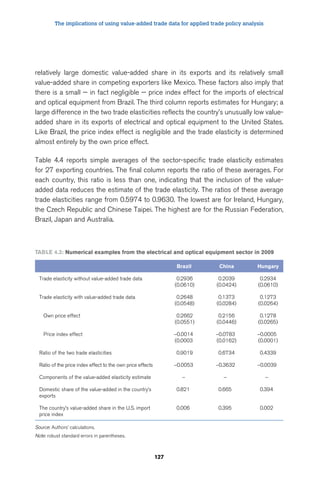
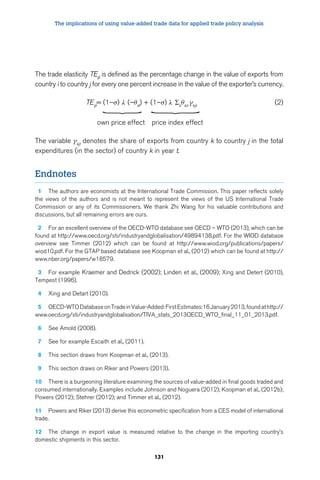
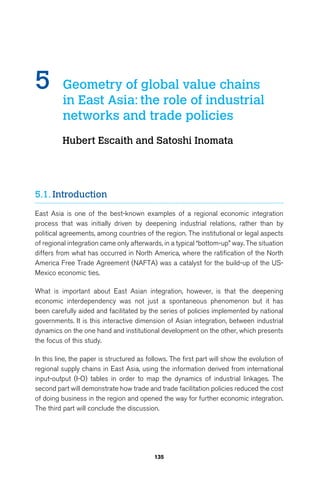
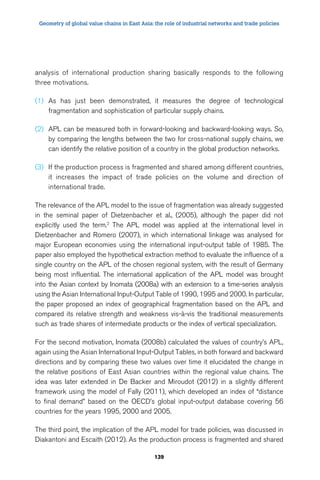
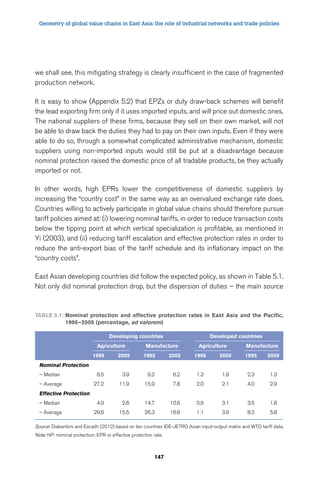
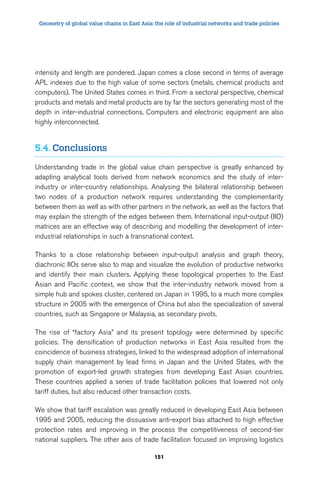
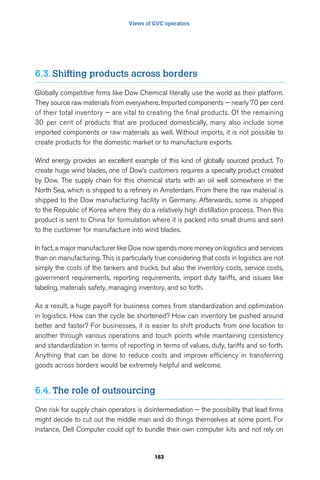
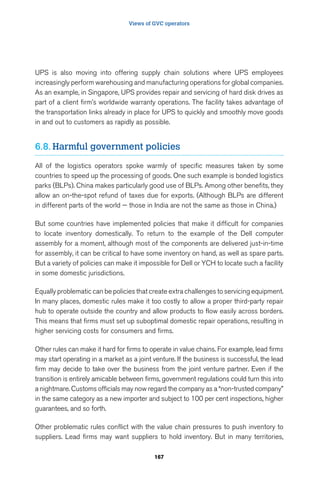
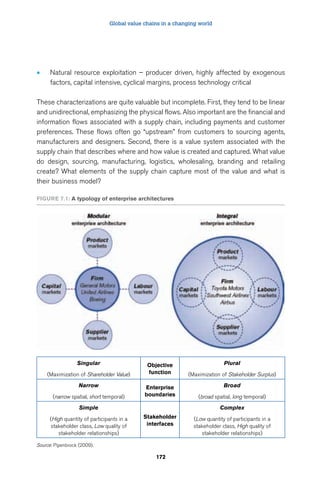
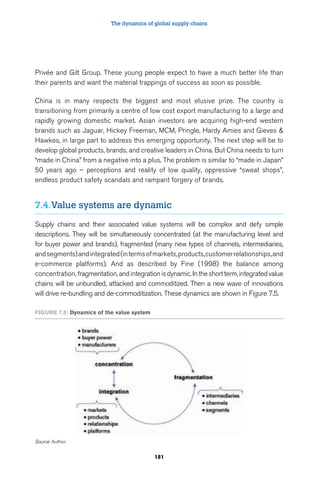
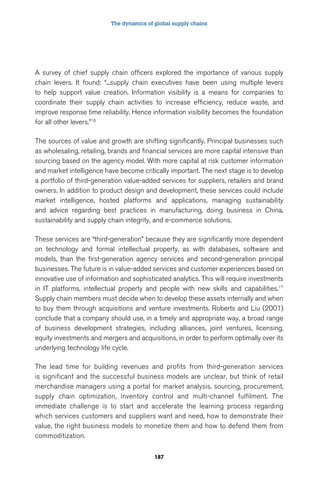
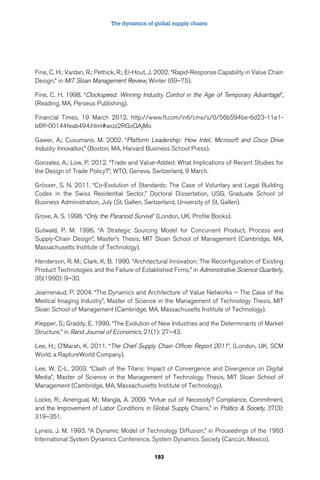
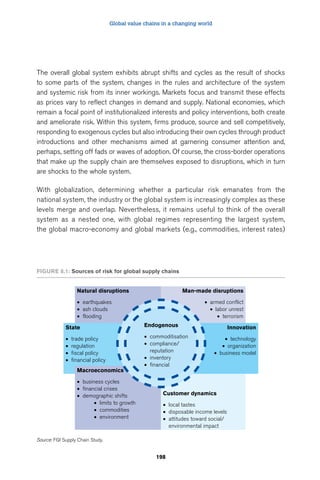
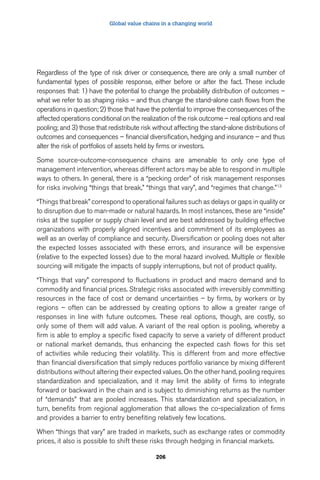
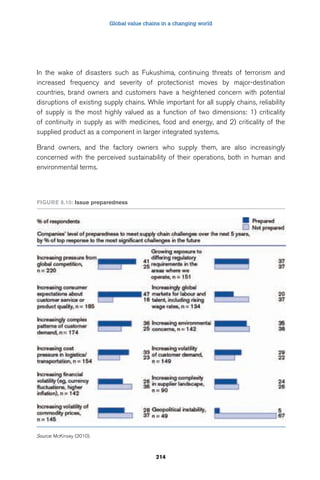
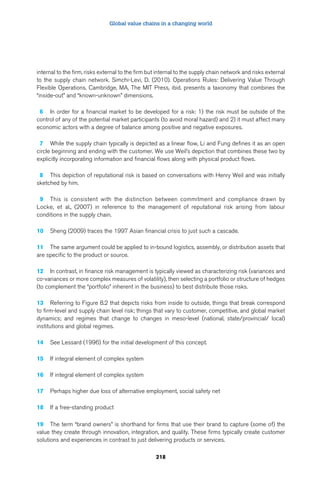
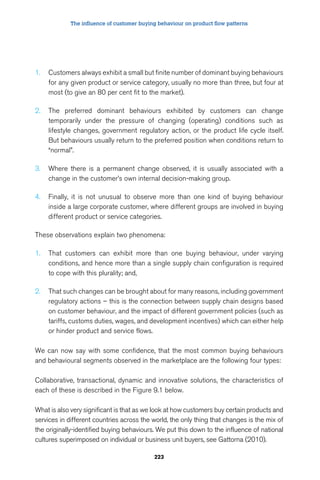
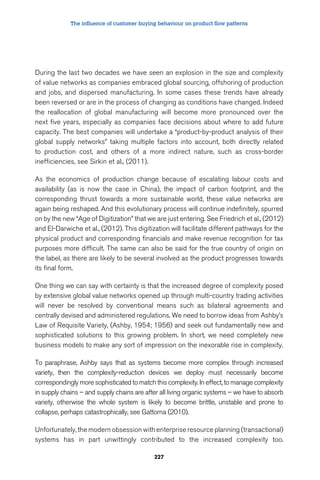
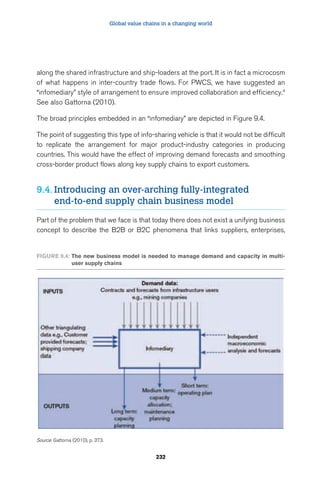
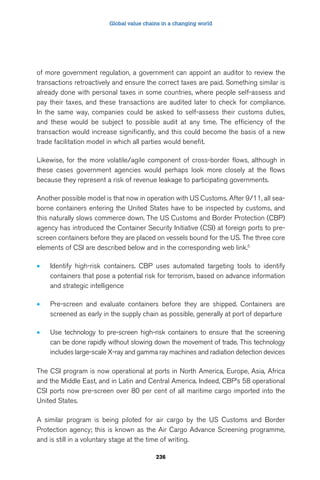
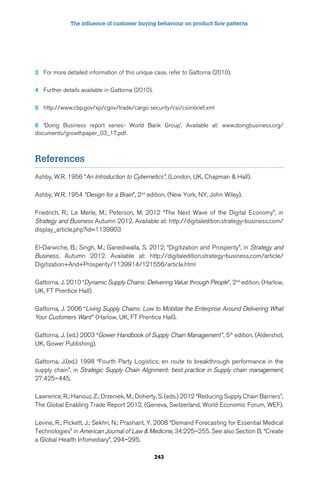
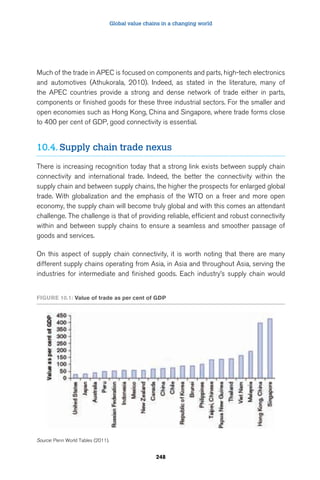
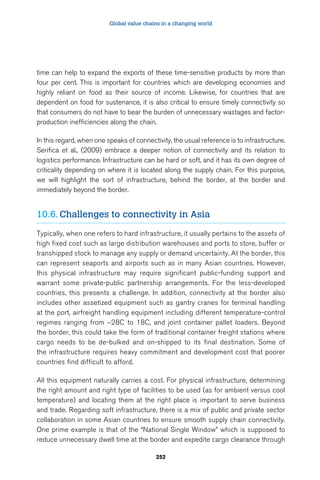
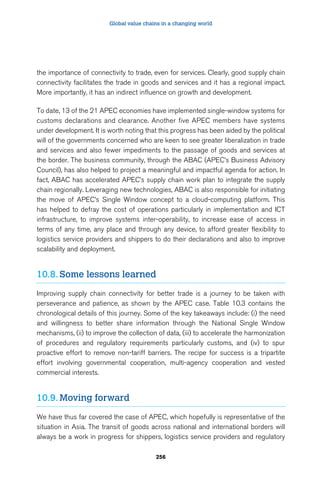
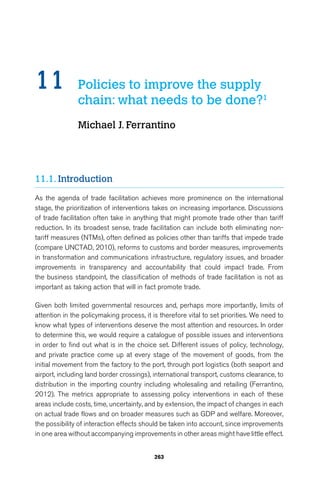
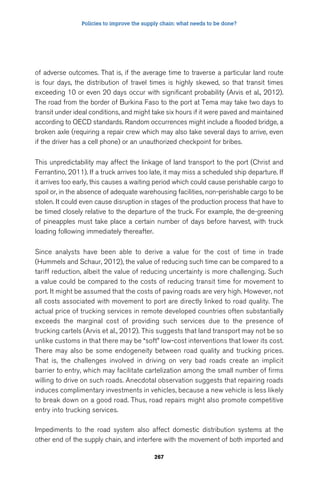
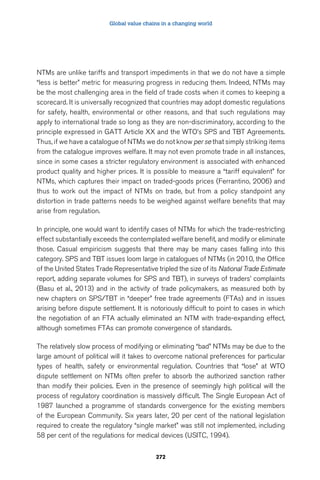
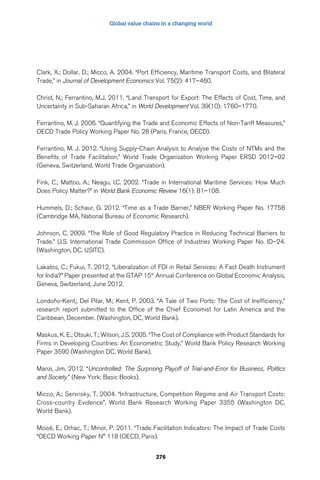
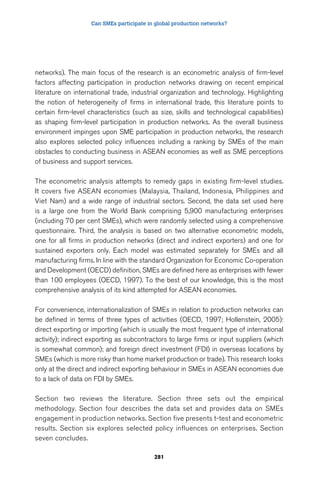
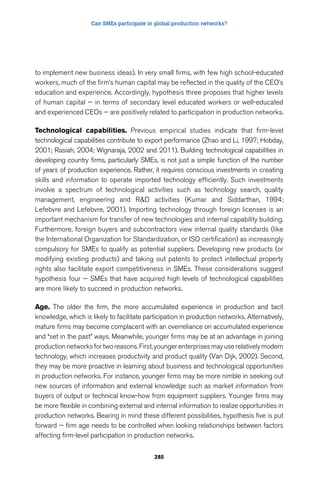
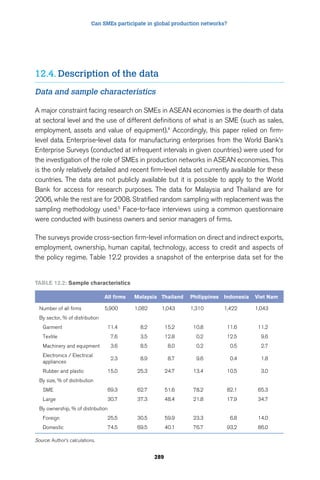
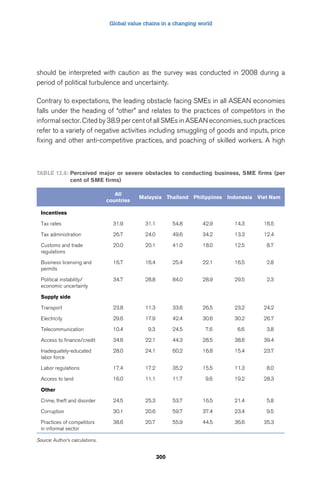
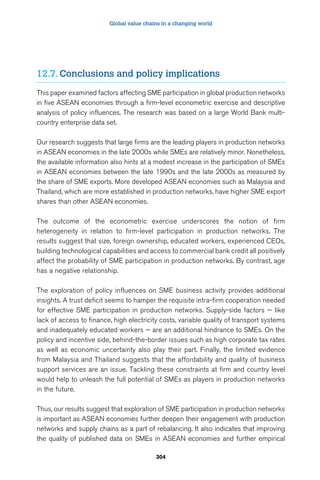
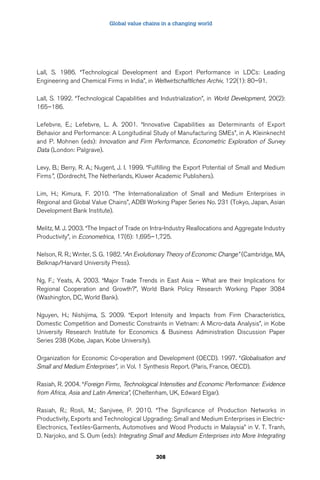
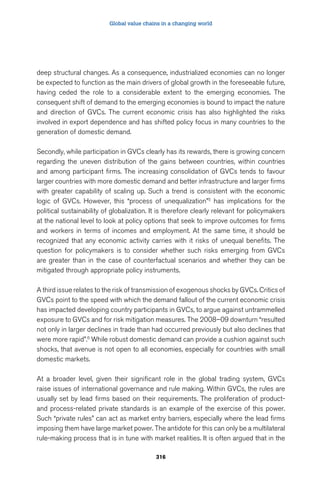
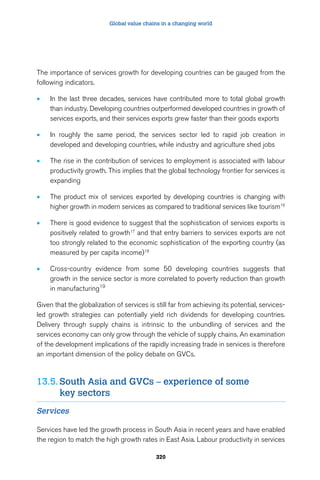
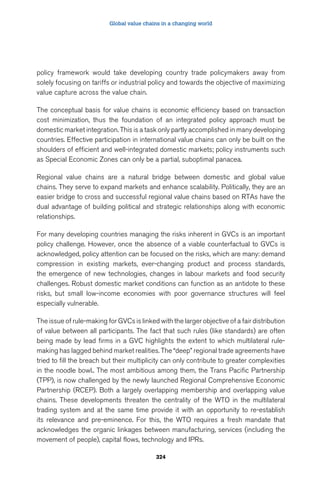
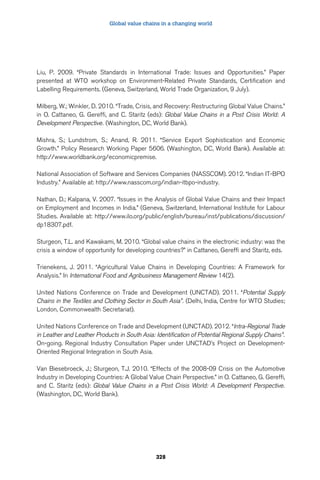
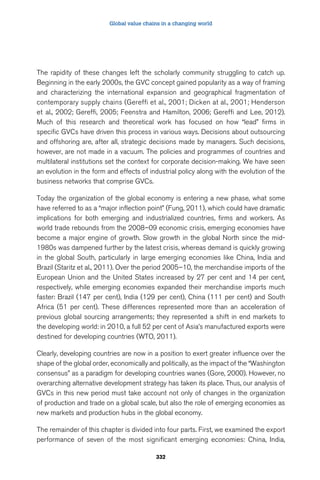
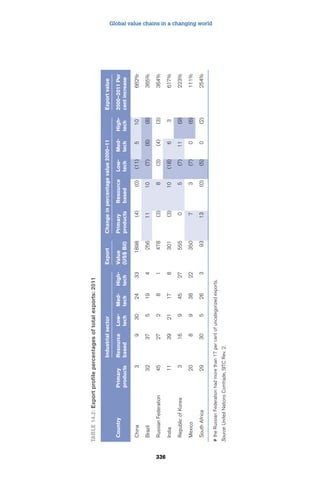
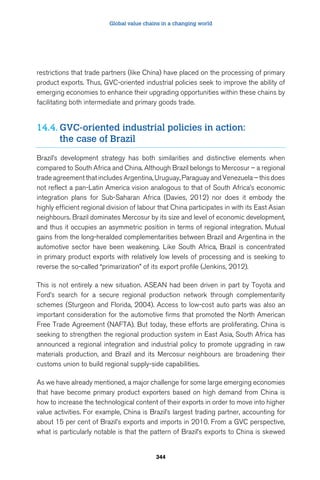
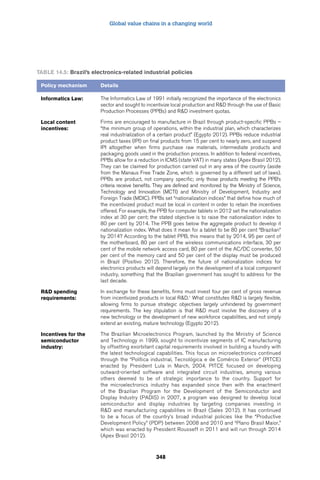
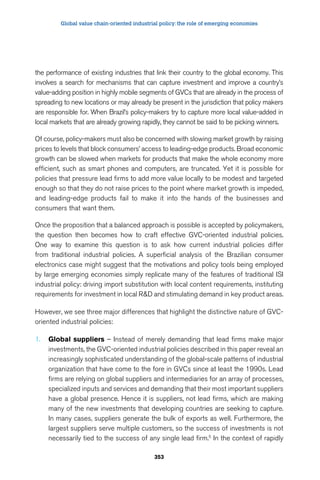
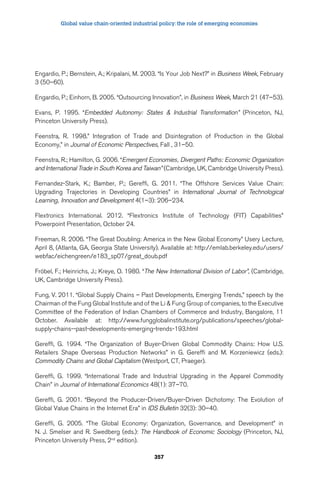
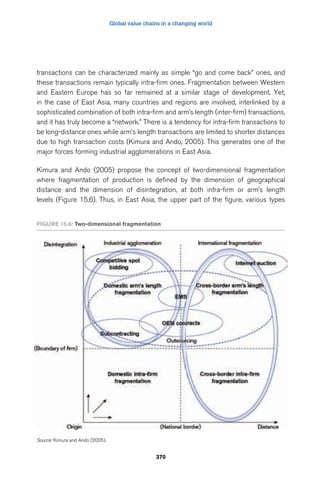
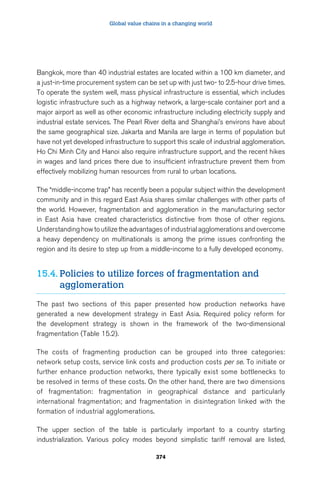
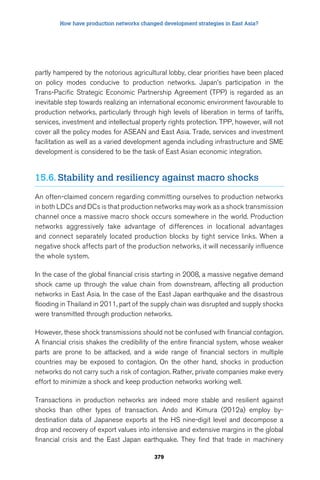
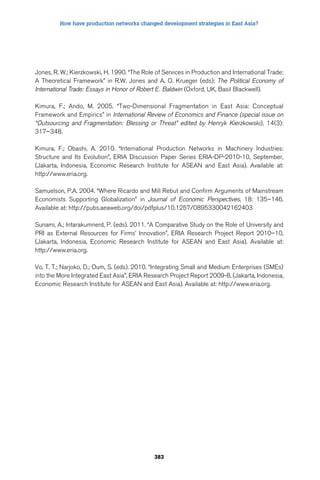
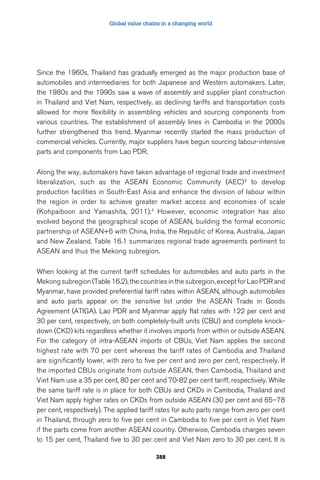
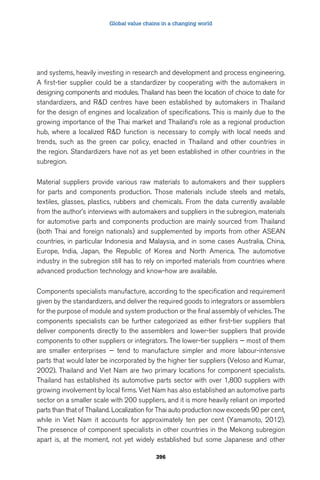
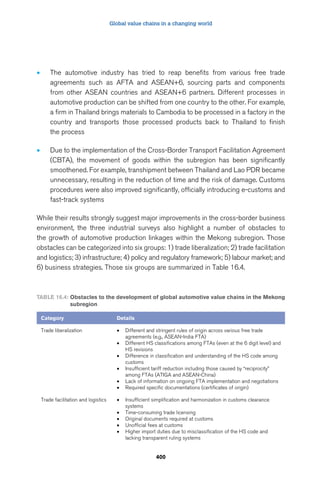
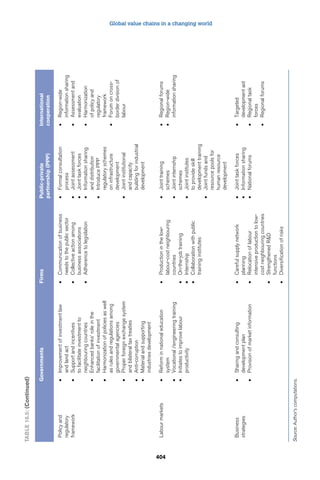
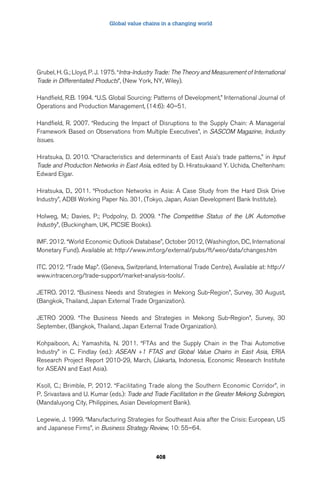
Suppose an n-industrial sector economy with a production structure defined by the
input coefficient matrix A shown in Figure a. Input coefficients aij are calculated from
an input-output table by dividing input values of goods and services used in each
industry by the industry’s corresponding total output, i.e. aij = zij / Xj where zij is a
value of good/service i purchased for the production in industry j, and Xj is the total
output of industry j. So, the coefficients represent the direct requirement of inputs for
producing just one unit of output of industry j.
Figure a An input Coefficient Matrix Figure b Impact delivery paths
152
A =
a a a a
a a a a
a a a a
n
n
n
11 12 13 1
21 22 23 2
31 32 33 3
a n 1 a n a 2 n
3
an
n
1 step path
Ind 3
a13 Ind 1
2 step paths
Ind 3
a23 Ind 2
a12 Ind 1
Ind 3
a33 Ind 2
a13 Ind 1
. . .
. . .
and so on.
The vertical sequence of demand propagation can be depicted as follows. Let us
consider the impact of demand for 100 units in industry 3 upon the output of industry
1. The simplest form of all is given by the direct linkage [3→1], which is calculated
as a product of multiplying 100 units by input coefficient a13. This is because a13,
by definition of an input coefficient, represents an immediate amount of products of
industry 1 required for producing just one unit of products of industry 3. Alternatively,
there is a two-step path going through another industry, say, [3→2→1]. This is derived
by two-stage multiplication, i.e. 100 units by a23, and then by a12. There can also be a
two-step path going through the same industry, such as [3→3→1] or [3→1→1] which
would be derived respectively as “100 × a33 × a13” and “100 × a13 × a11” (see Figure b).](https://image.slidesharecdn.com/aid4tradeglobalvalue13e-140909015815-phpapp01/85/Aid4tradeglobalvalue13-e-177-320.jpg)
![Geometry of global value chains in East Asia: the role of industrial networks and trade policies
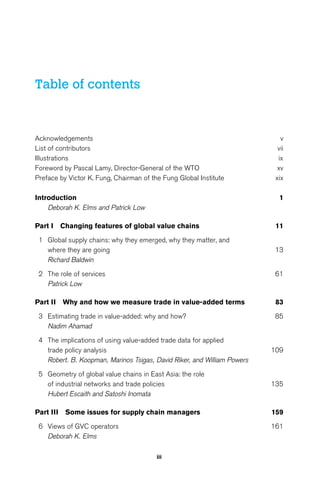
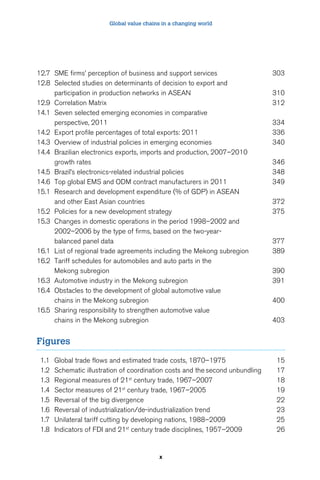
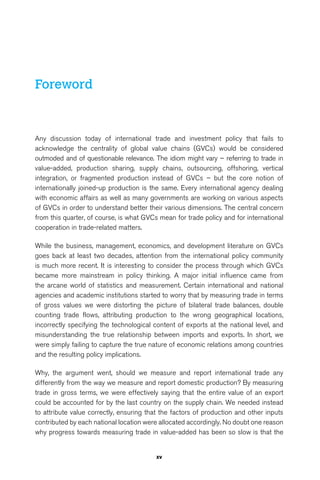
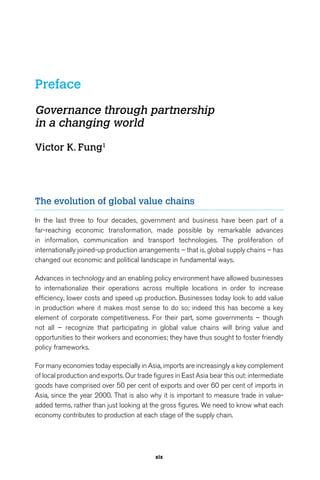
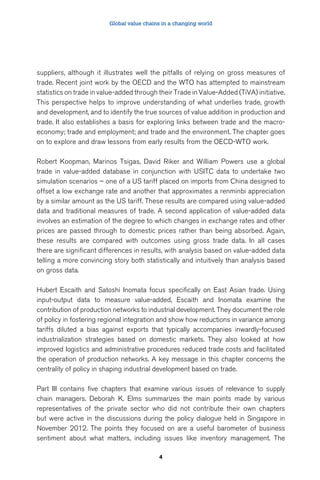
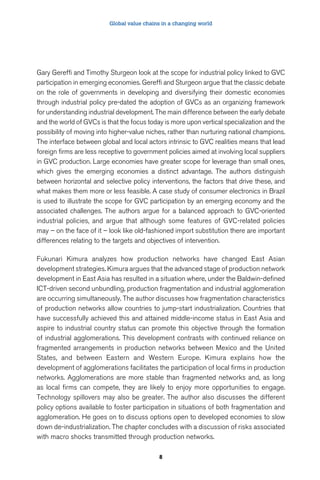
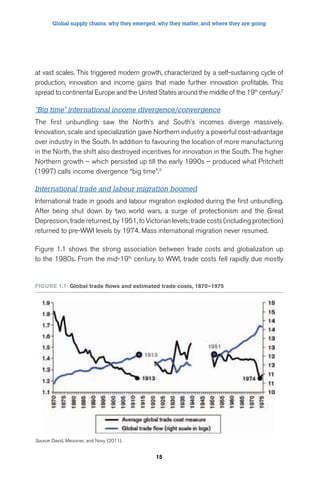
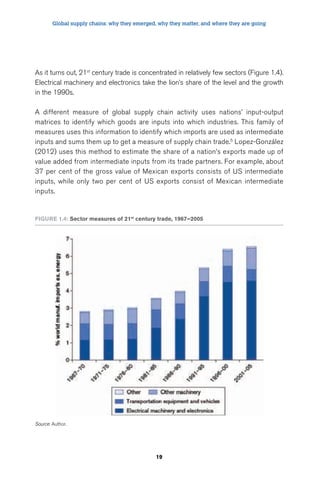
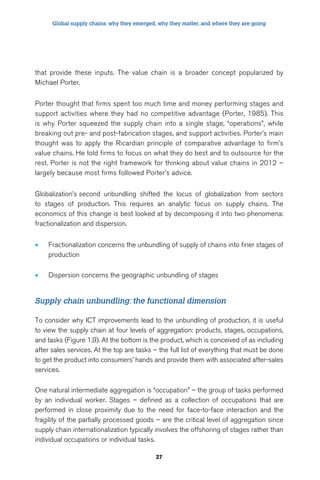
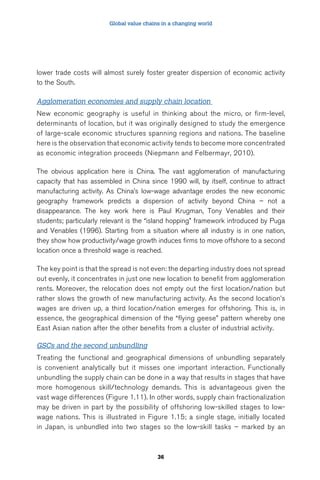
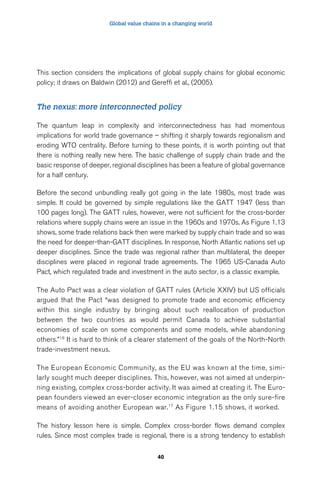
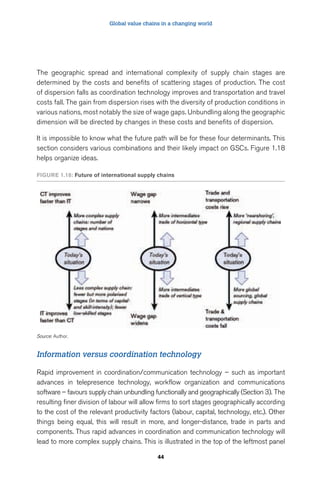
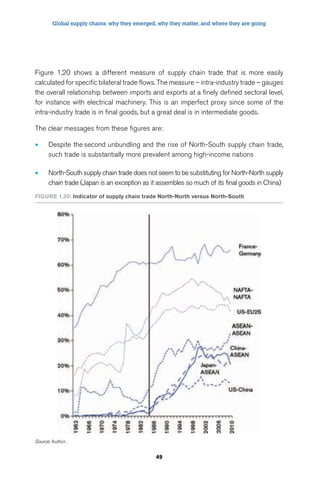
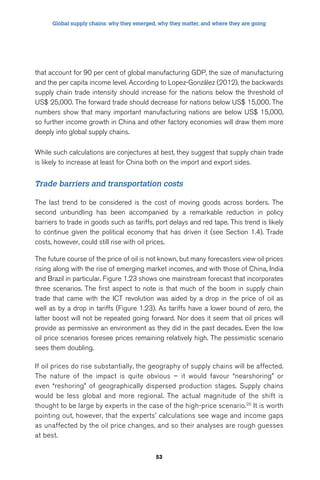
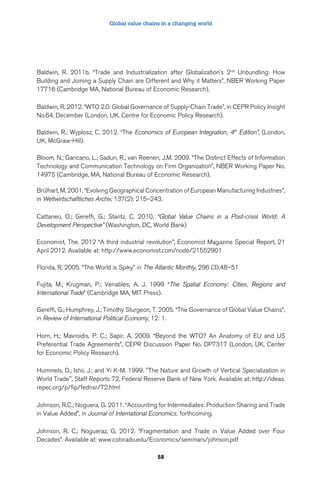
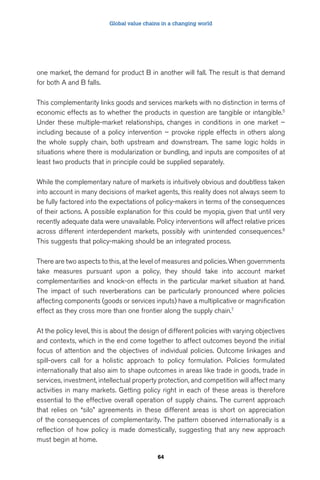
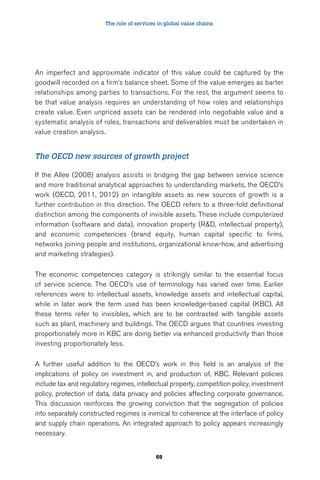
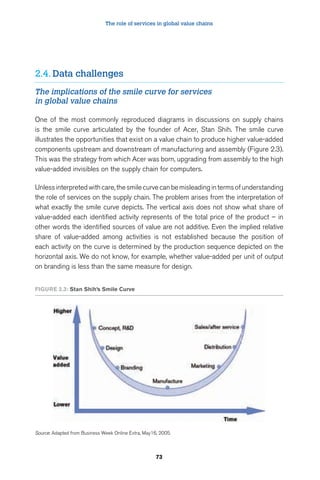
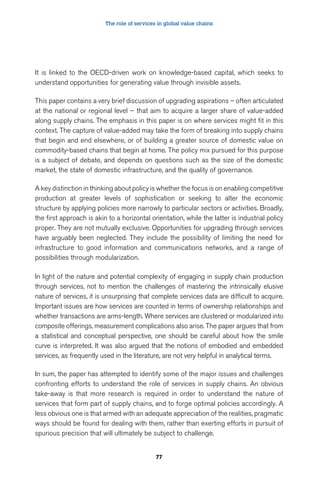
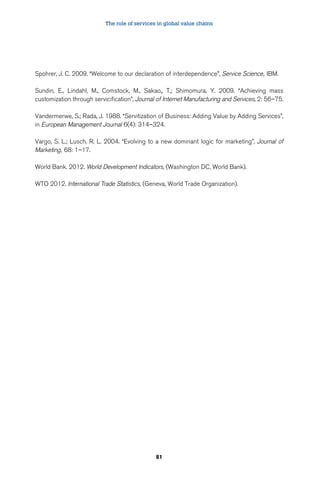
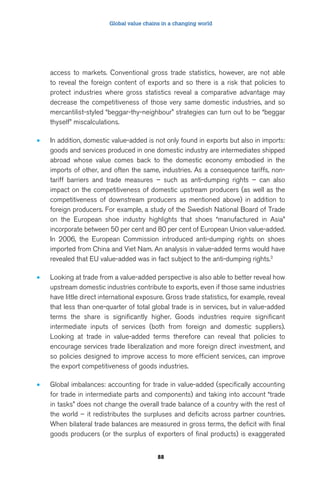
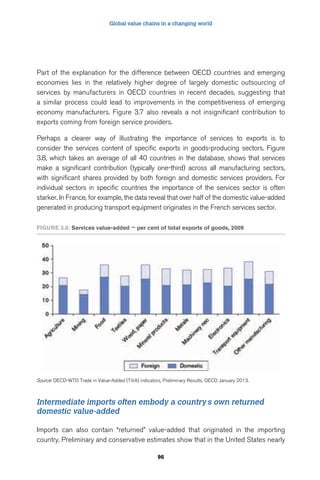
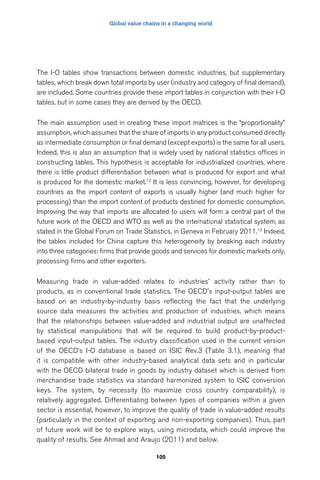
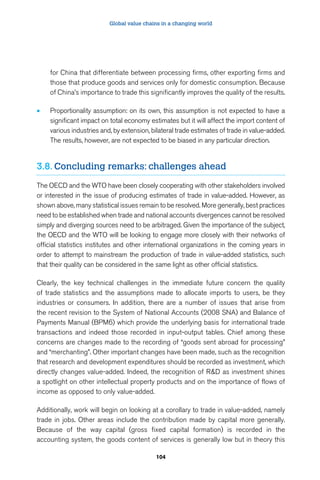
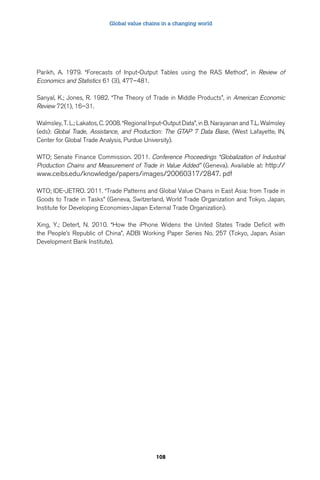
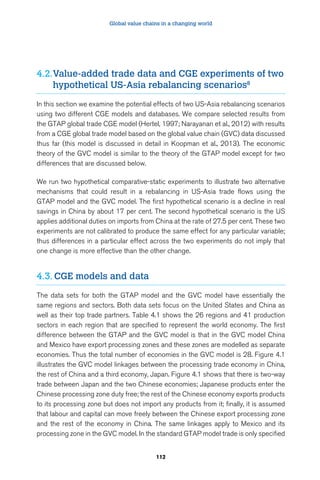
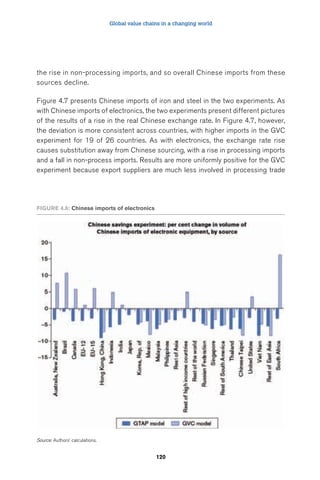
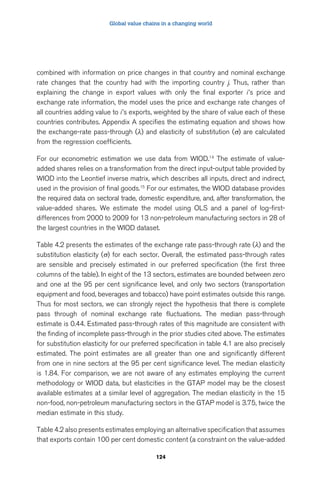
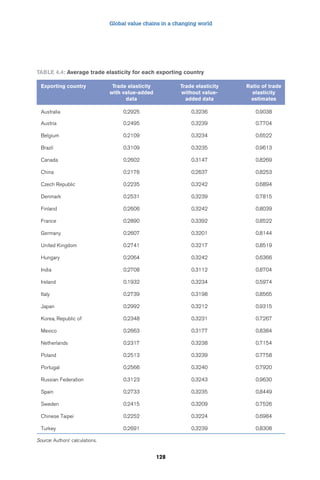
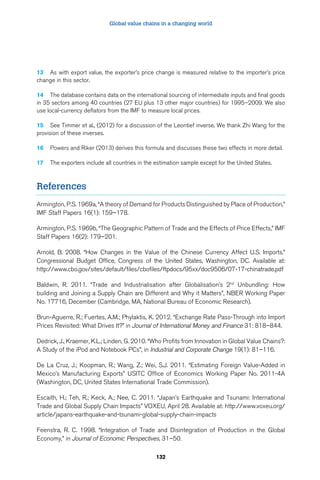
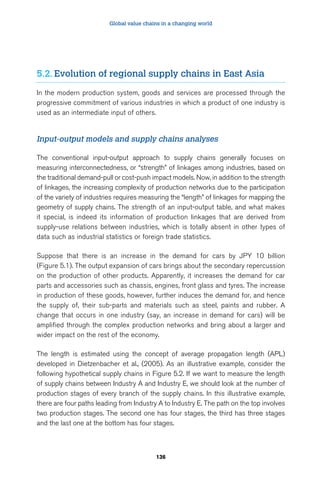
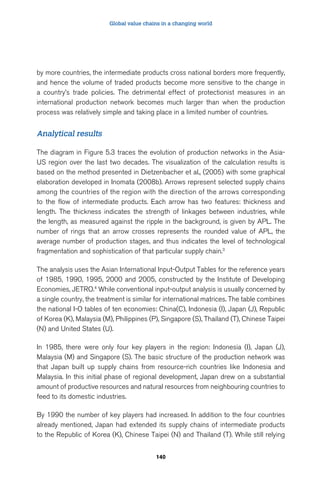
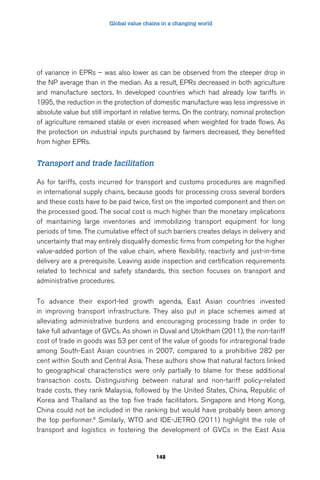
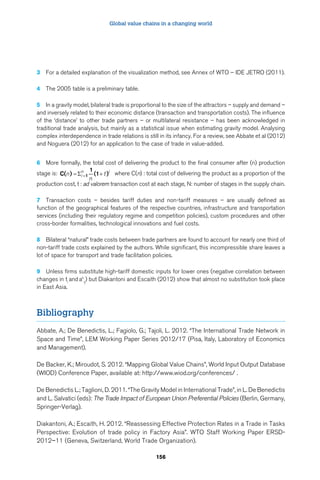
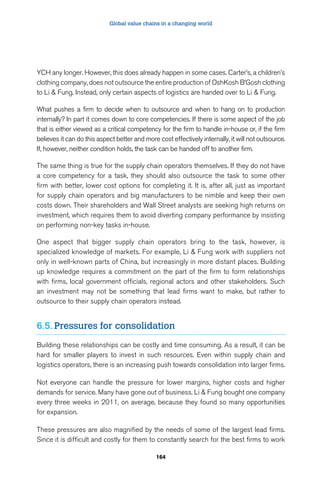
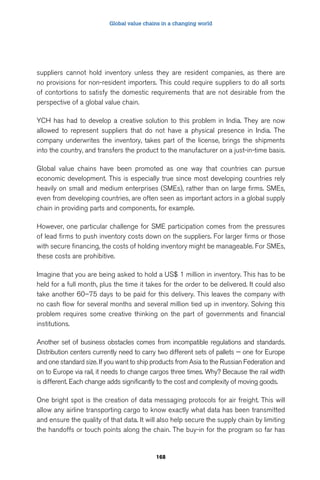
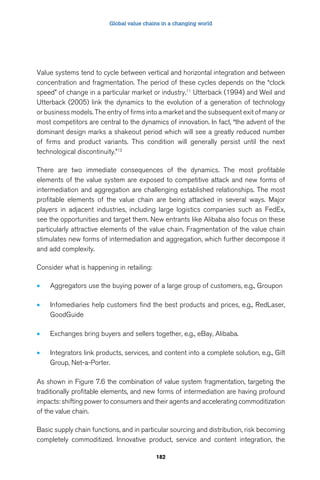
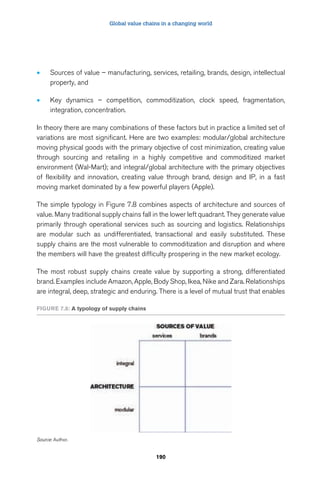
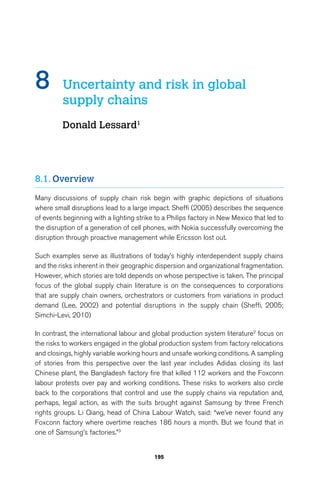
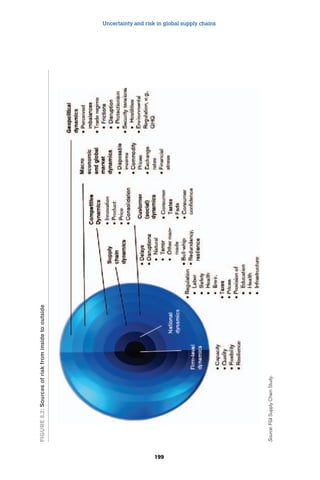
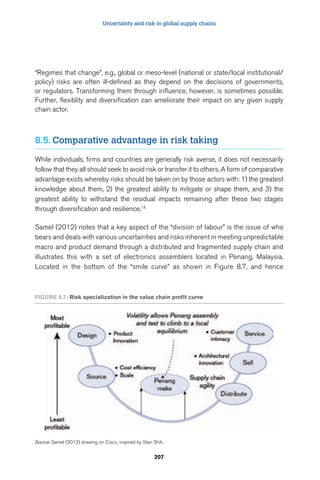
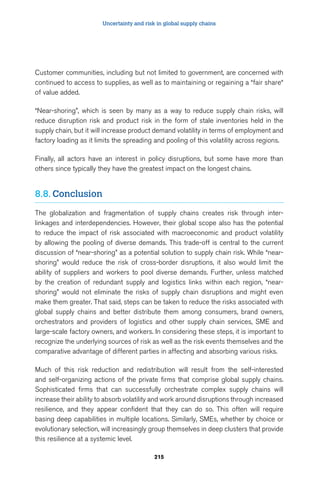
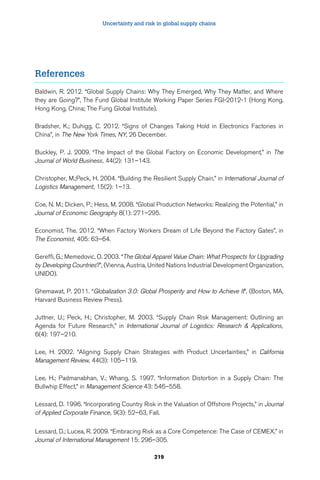
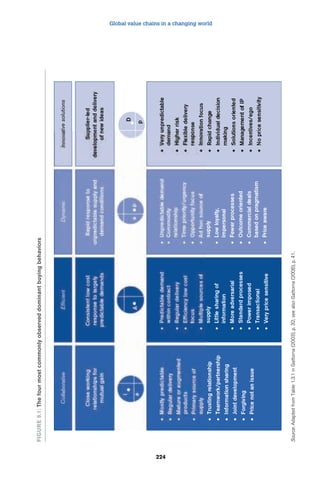
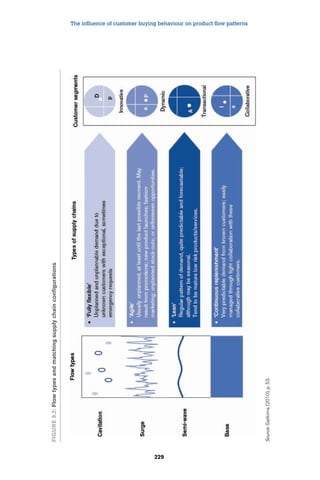
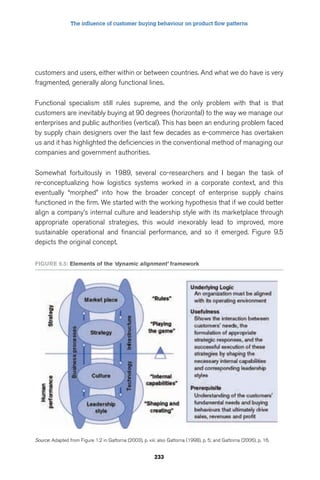
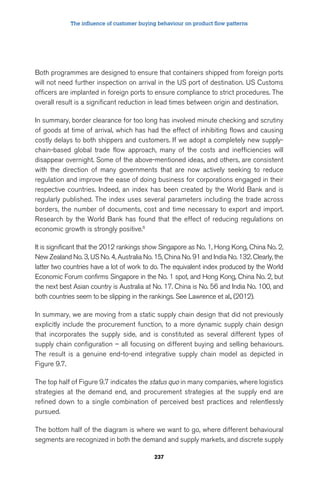
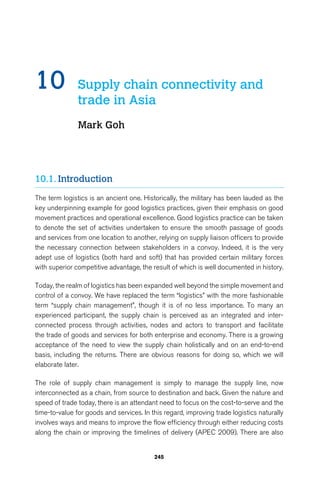
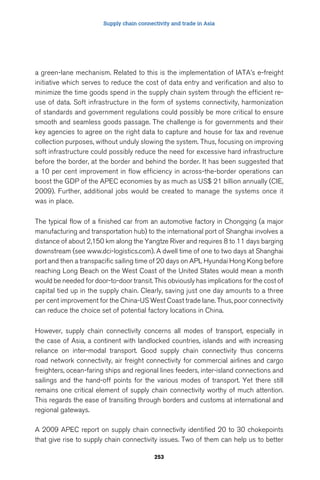
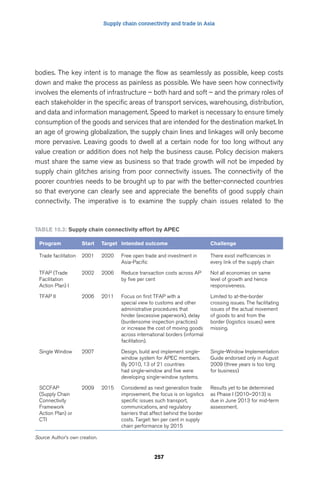
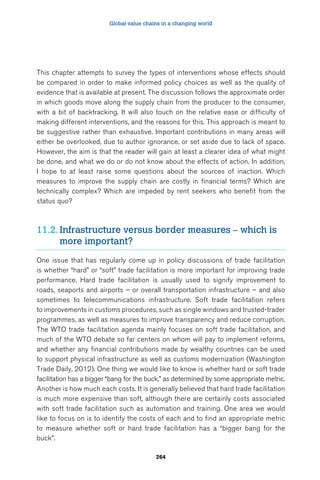
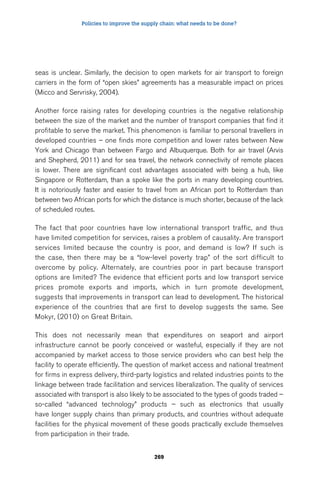
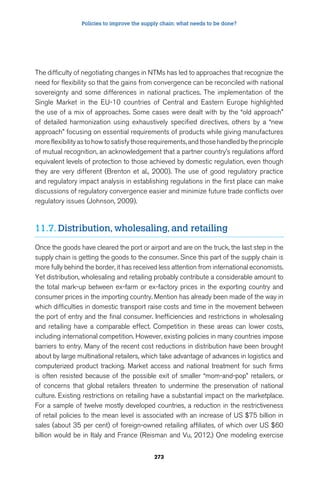
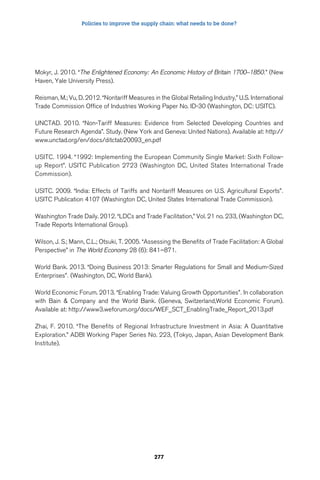
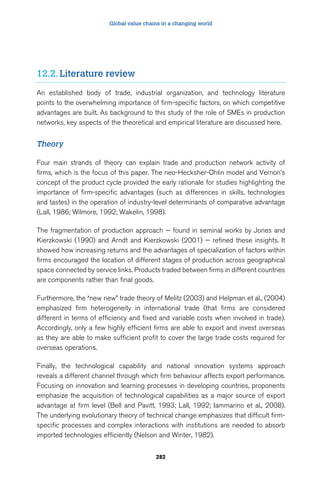
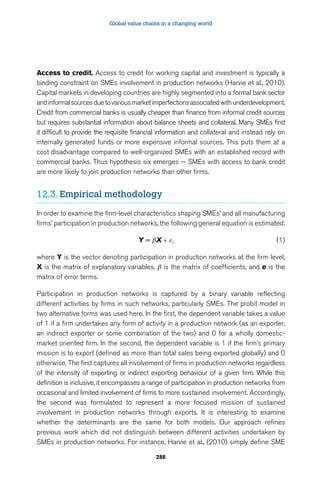
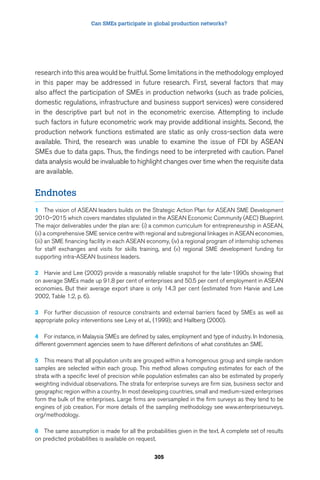
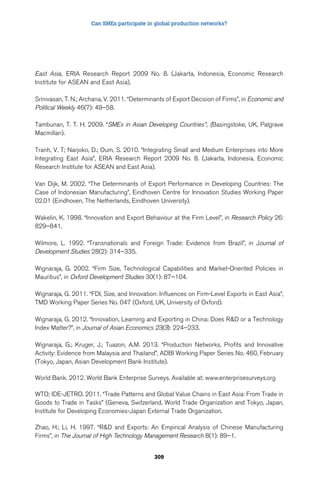
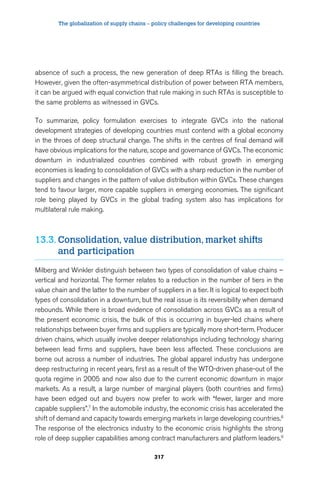
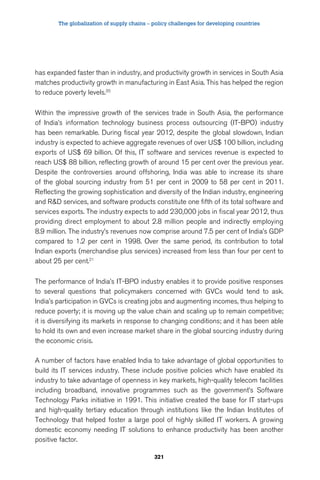
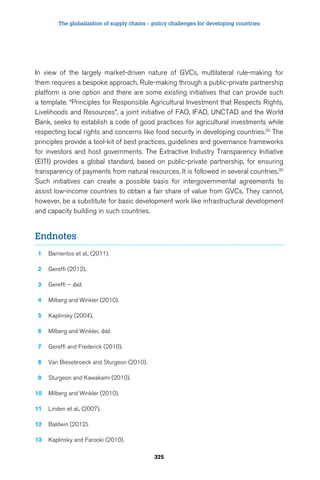
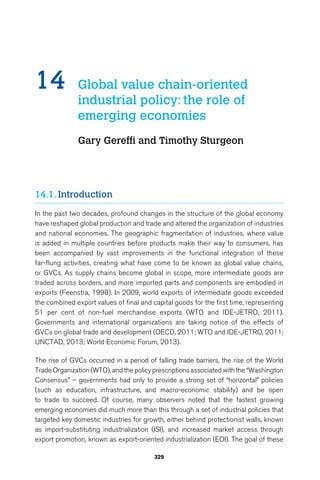
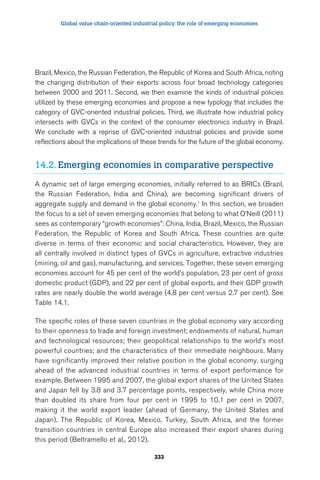
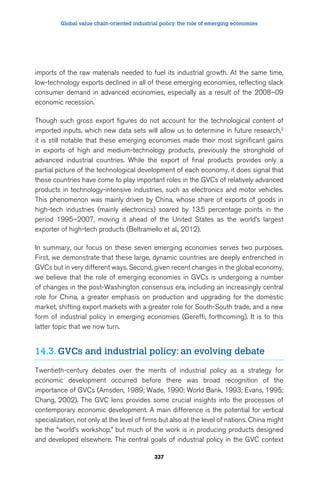
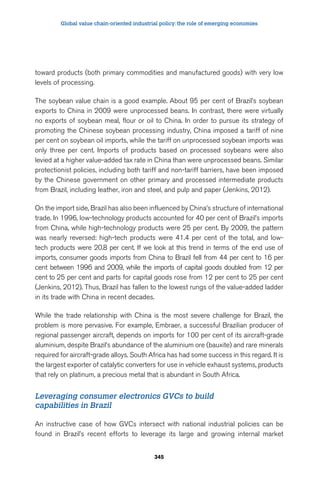
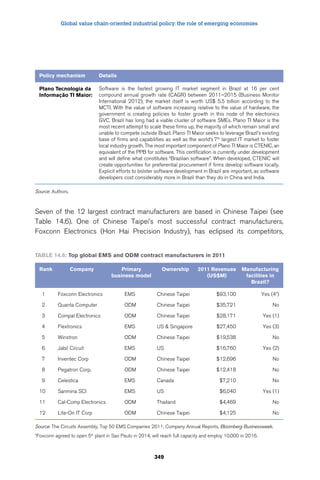
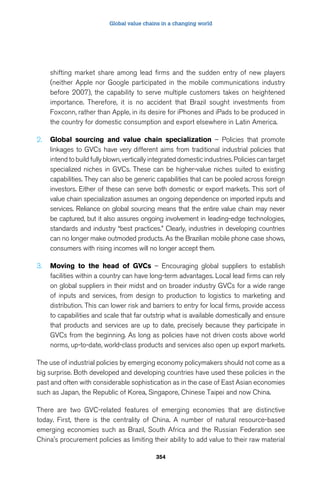
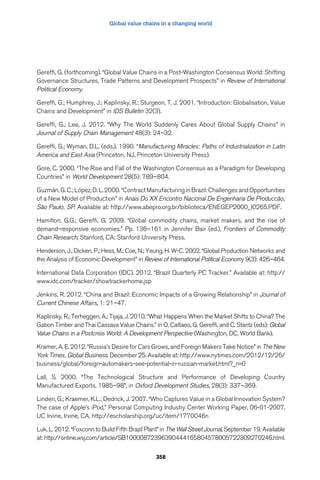
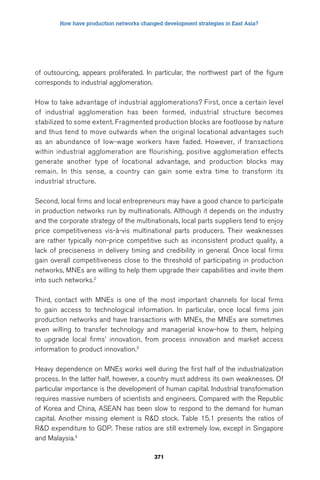
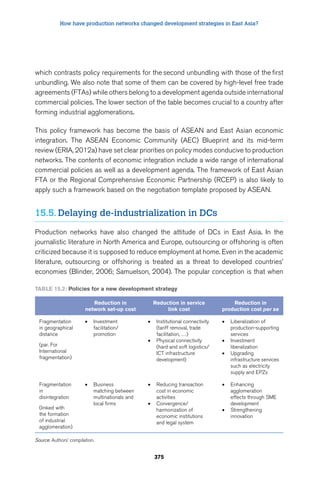
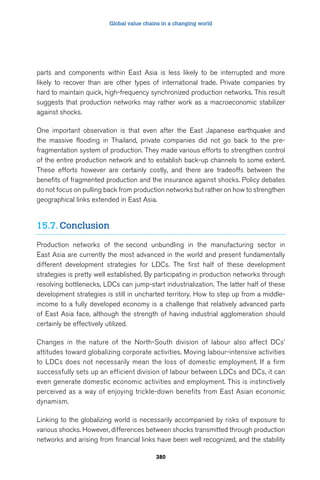
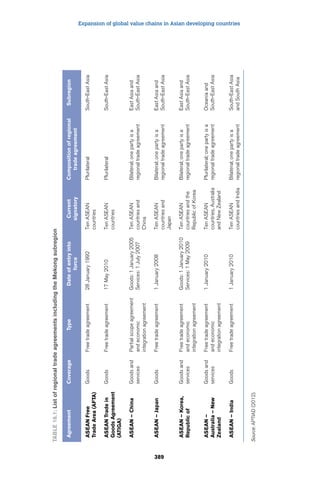
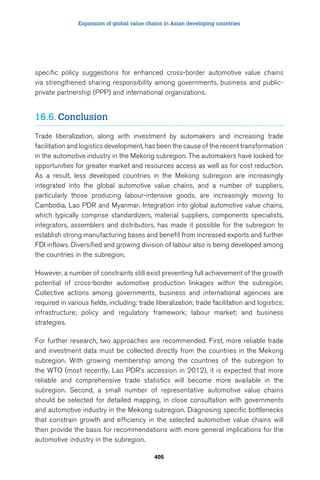
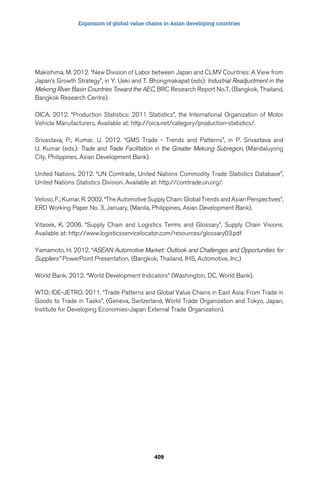
The exercise reveals that the impact of any two-step path, whatever the sequence
of industries, can be given by feeding back a set of direct impacts, A, into the input
coefficient matrix, i.e. A × A = A2. Similarly, the impact of three-step paths is given by
A × A2 = A3, that of four-step paths by A × A3 = A4 and so on, which is evident from
[A2]ij=Σkaikakh, [A3]ij=ΣkΣhaikakhahj, etc. The amount of impacts shown in each layer of Aks
(k=1, 2, 3,...,) is a result of the initial demand injection passing through all k-step paths.
It captures the effect of every direct and indirect linkage that undergoes exactly the
k-round steps/stages of the production process.
Meanwhile, it is mathematically known that the Leontief inverse matrix L, which shows
the total amount of goods and services required for the production of one unit of
output, can be expanded as an arithmetic series, i.e. L = (I – A)–1 = I + A + A2 + A3 +
A4 + ..., where I is an identity matrix (with “1” in diagonal elements and “0” elsewhere).
From what we saw above, it is immediately clear that the equation represents the
decomposition of the total impact on output into its constituent layers according
to the number of production stages involved. Matrix I corresponds to an initial (unit)
demand injection and the following Aks are regarded as progressive impacts of the
initial demand when supply chains are sliced at the kth stage of the production process.
With this preliminary understanding, Average Propagation Lengths are specified as:
APL(j-i) = 1*aij / (lij – δij)+ 2*[A2]ij / (lij – δij) + 3*[A3]ij / (lij – δij)+ ...
A A
153
=
k k
= ij
=
k
k 1 k 1
ij
[2]
where A is an input coefficient matrix, aij is its elements, lij is Leontief inverse
coefficients, δij is a Kronecker delta which is δij=1 if i=j and δij=0 otherwise, and k
is a number of production stages along the path. We also define APL(j-i)=0 when
(lij – δij) =0.
The first term in the right-hand side of the upper equation shows that the impact
delivered through one-step paths (k=1), i.e. direct impact, amounts to aij / (lij – δij)
share of the total impact given by the Leontief inverse coefficients (less unity for
diagonal elements). Similarly, two-step paths (k=2) contribute [A2]ij / (lij – δij) share,
and three-step paths (k=3) give [A3]ij/ (lij – δij) share of the total impact. This is evident
from L = I + A + A2 + A3 + ... which is rearranged as L – I = A + A2 + A3 + ..., and hence
(L – I)ij = (lij – δij) = Aij+ [A2]ij+ [A3]ij+ ....](https://image.slidesharecdn.com/aid4tradeglobalvalue13e-140909015815-phpapp01/85/Aid4tradeglobalvalue13-e-178-320.jpg)
![Global value chains in a changing world
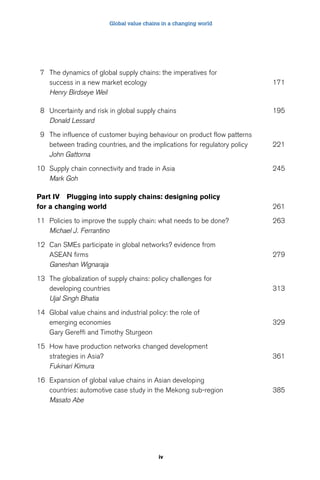
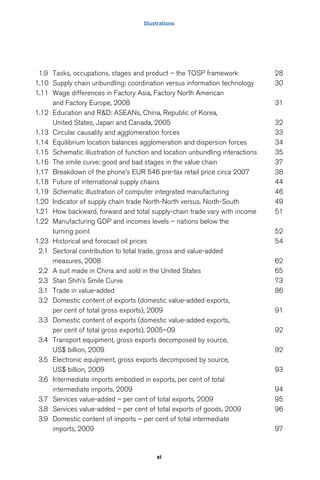
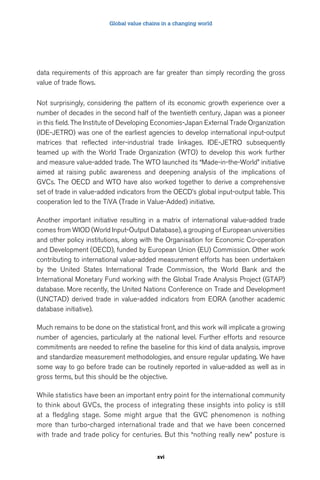
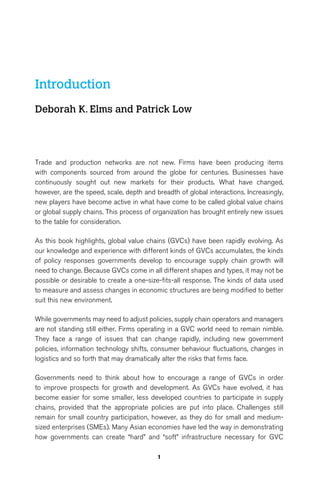
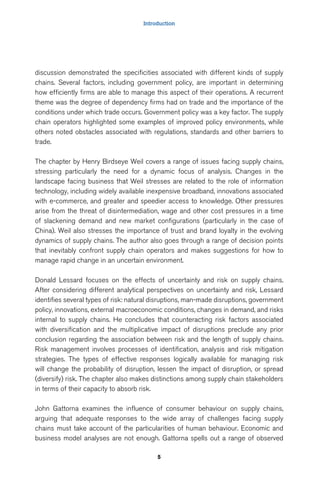
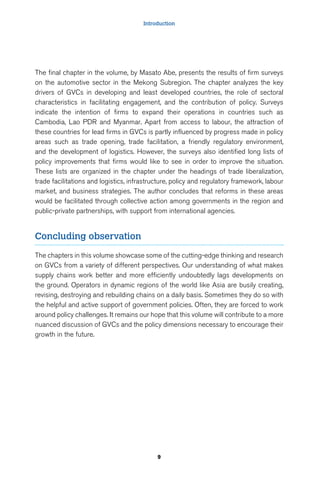
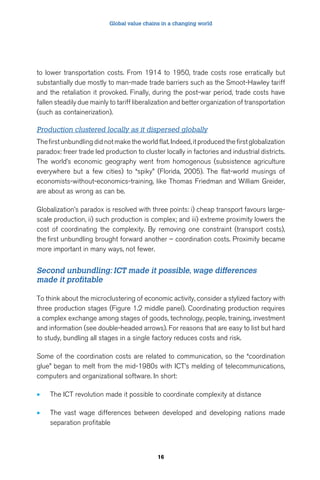
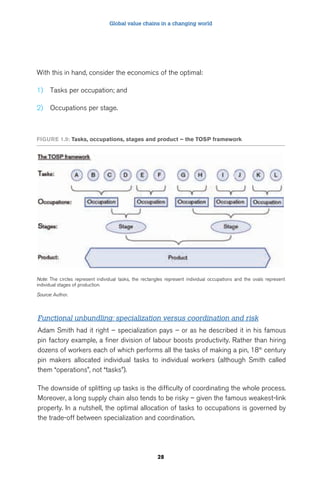
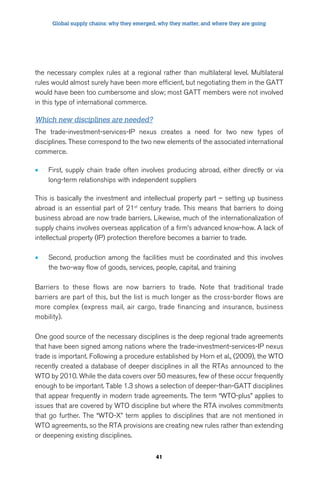
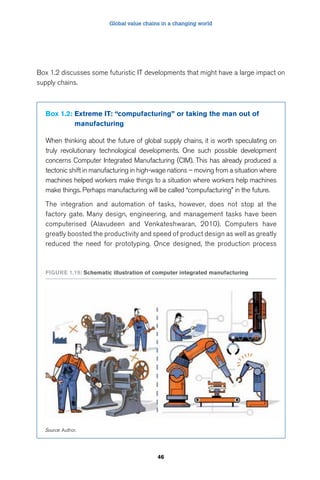
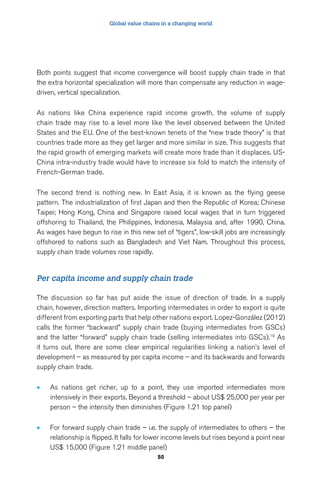
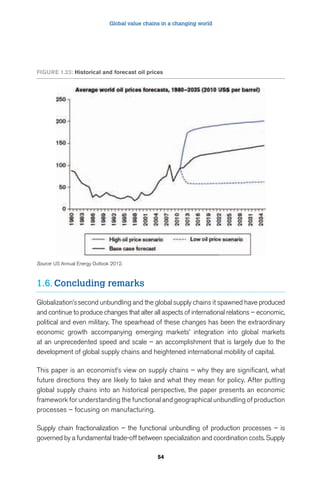
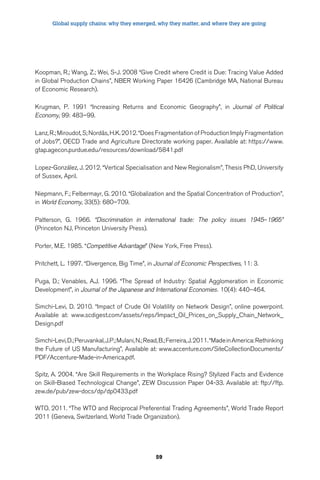
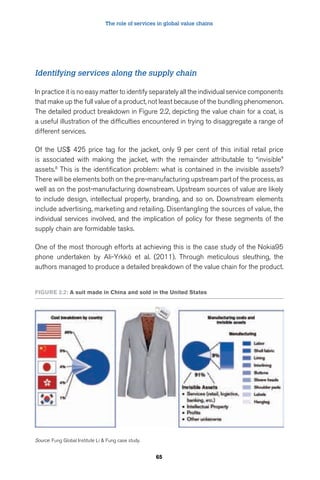
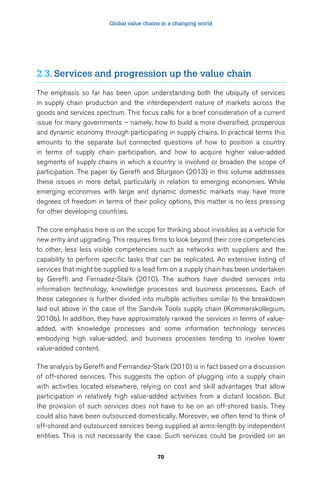
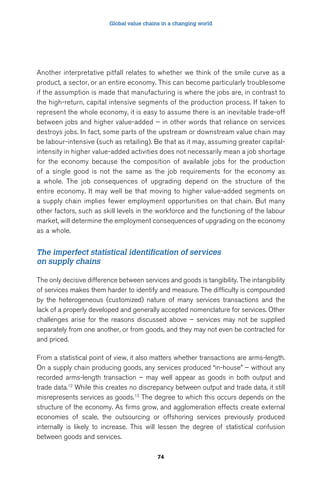
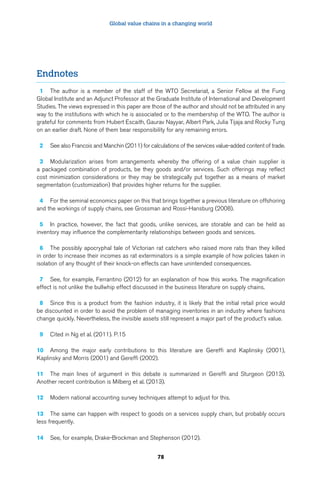
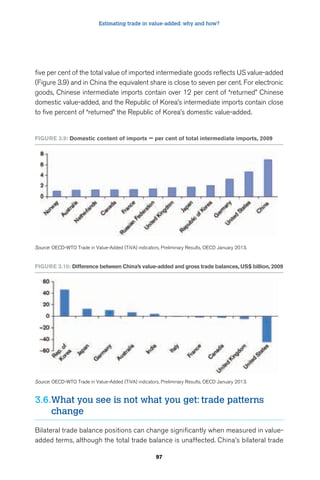
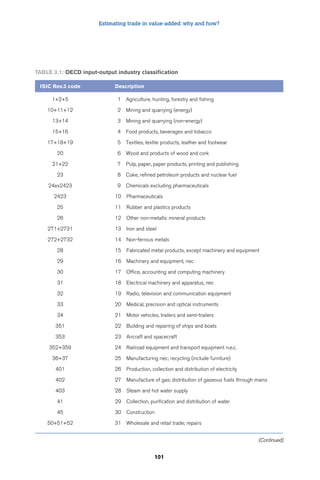
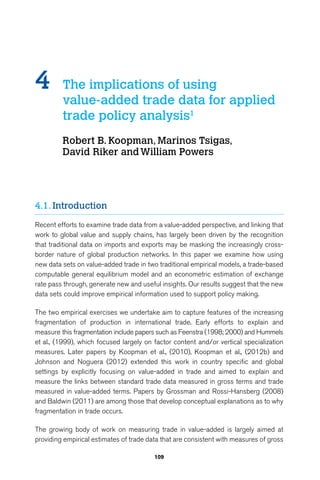
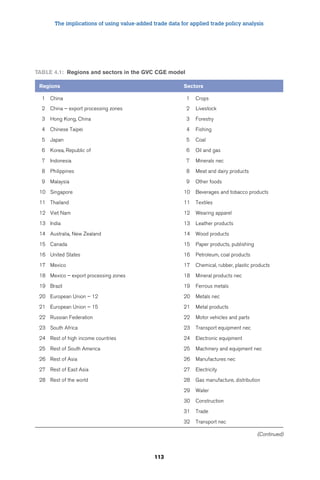
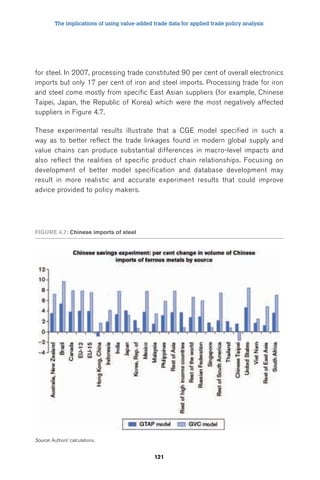
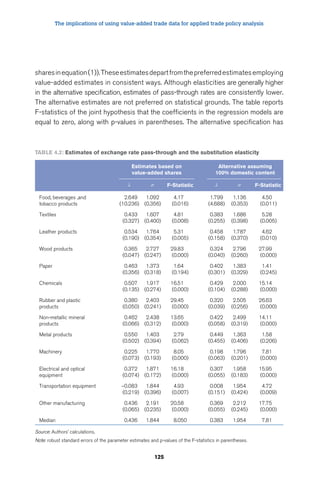
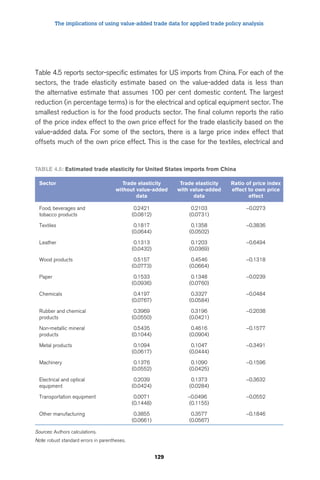
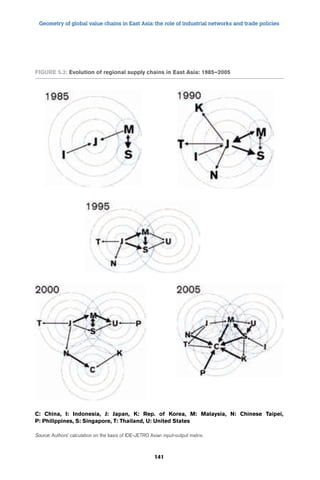
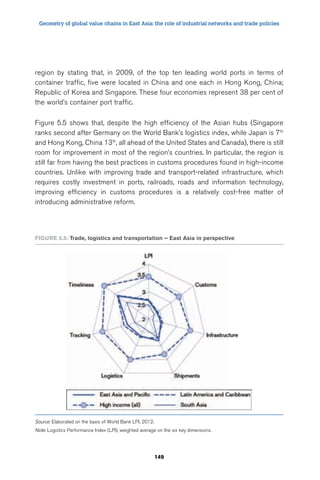
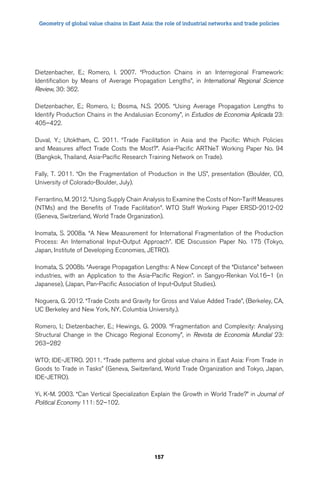
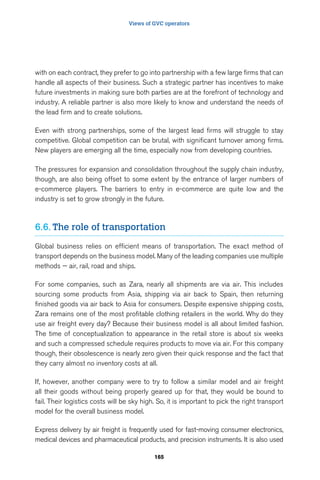
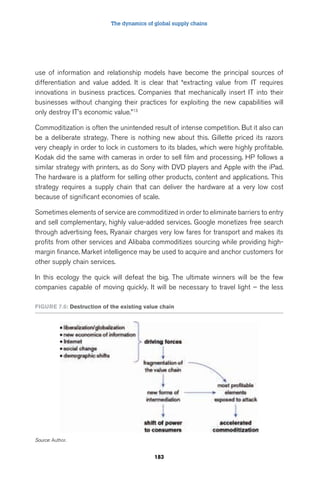
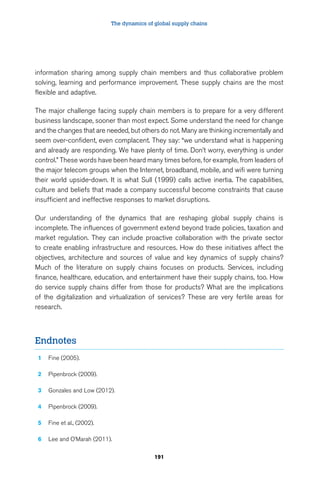
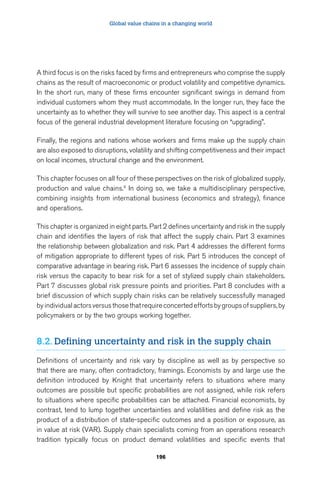
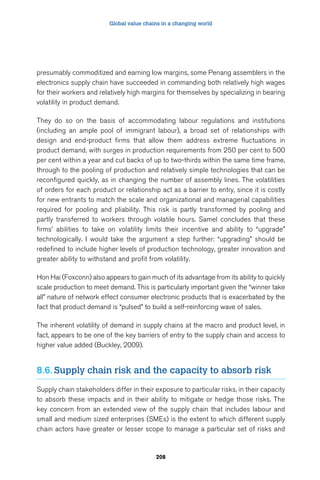
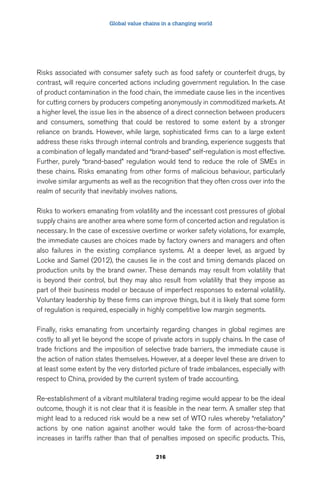
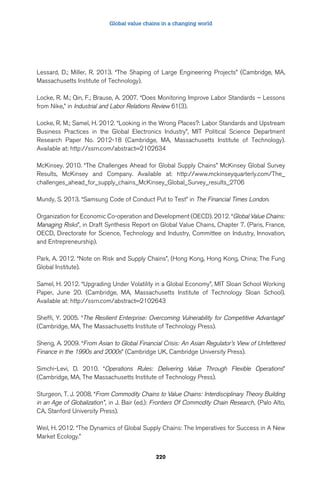
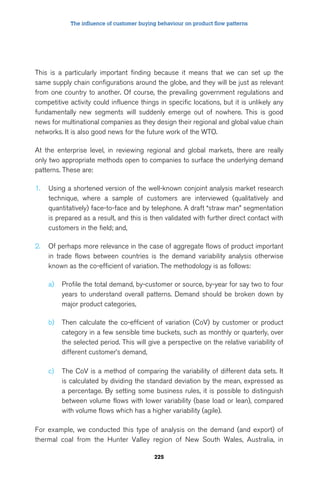
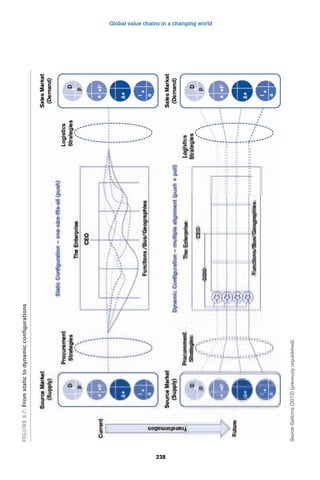
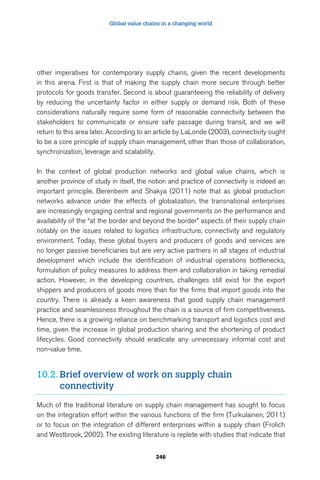
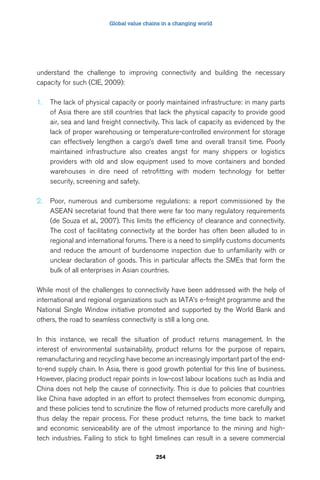
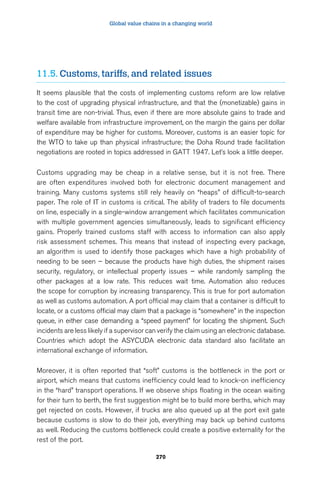
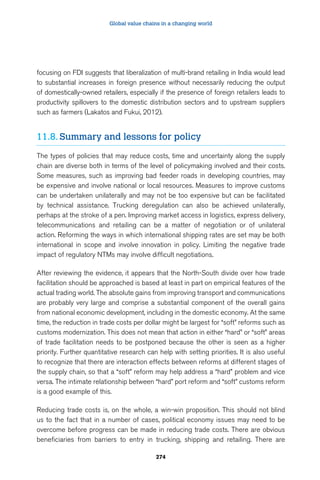
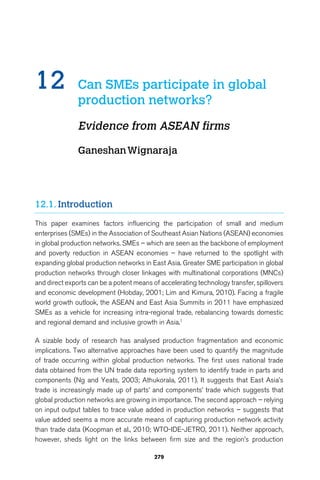
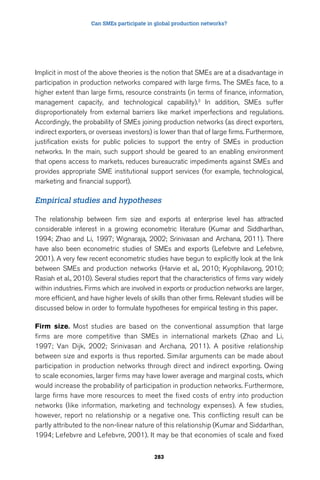
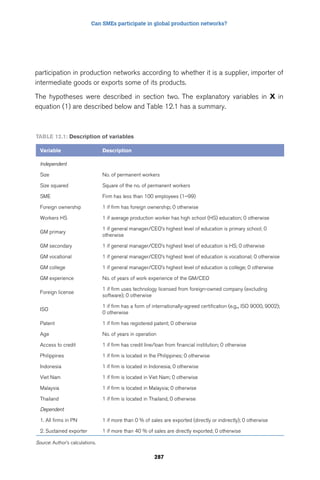
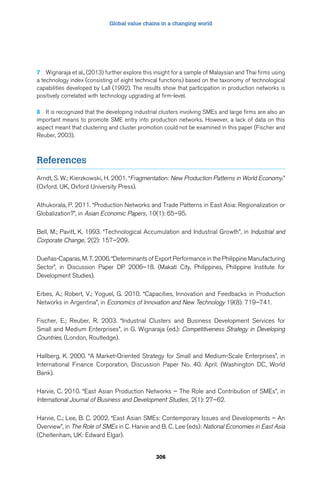
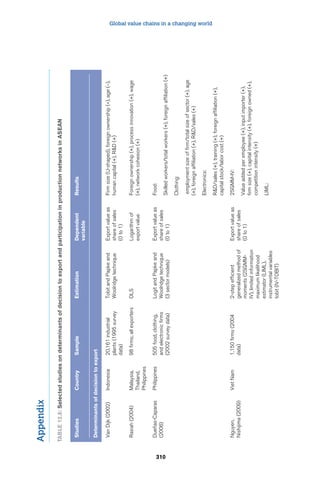
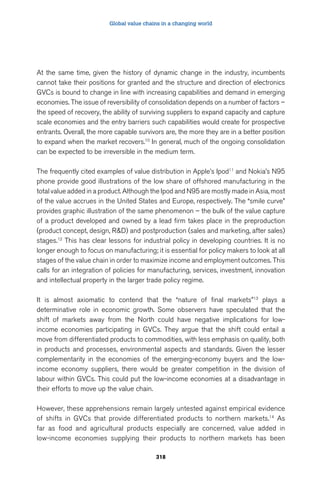
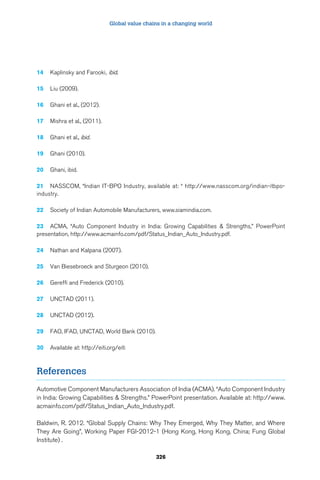
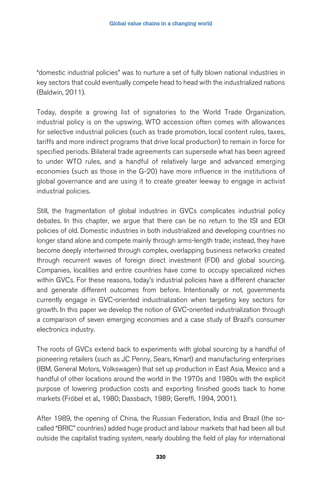
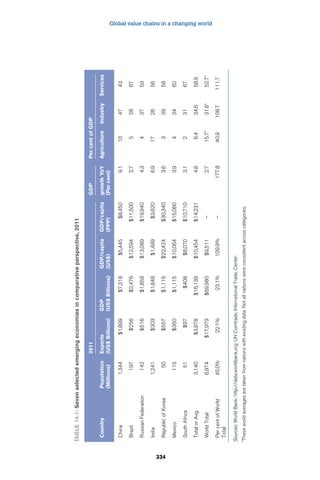
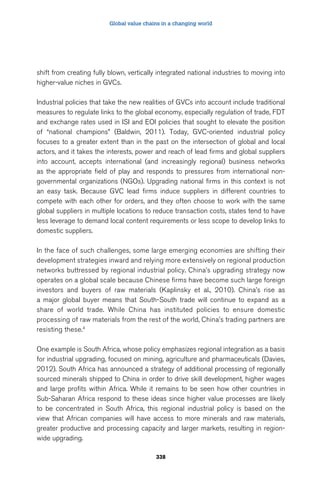
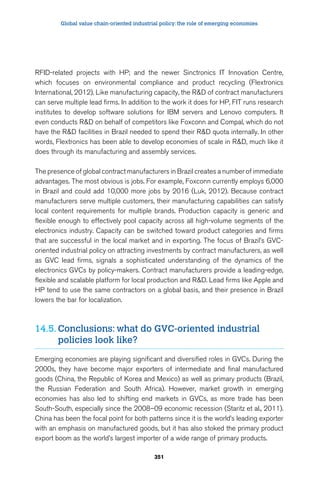
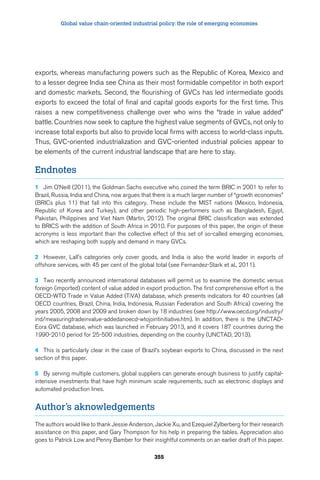
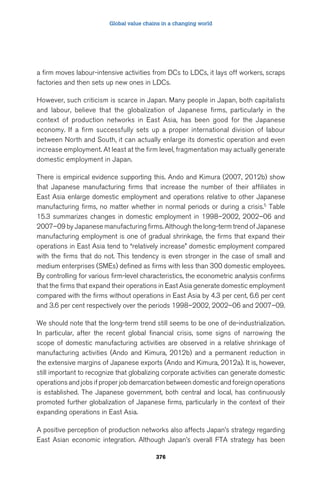
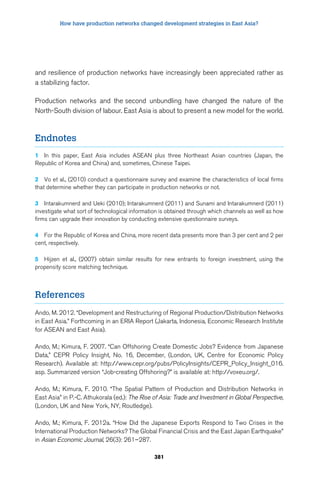
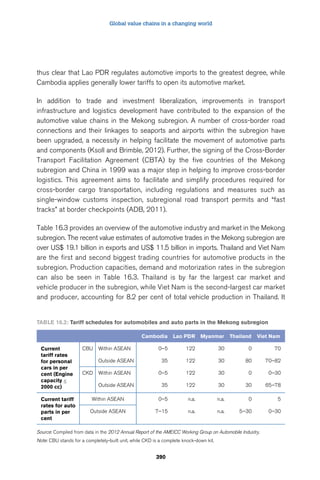
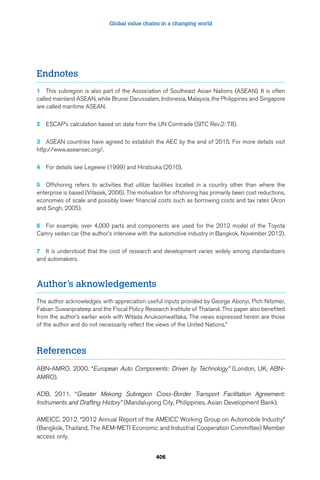
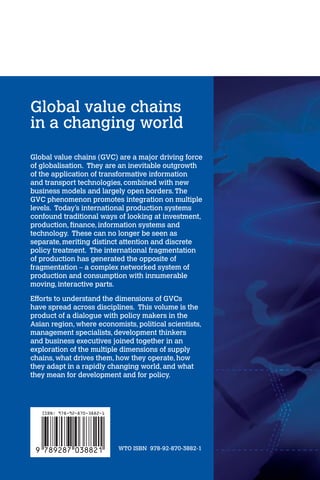
That is, Average Propagation Lengths is formulated as a weighted average of the
number of production stages which an impact from industry j goes through until it
ultimately reaches industry i, using the share of an impact at each stage as a weight.
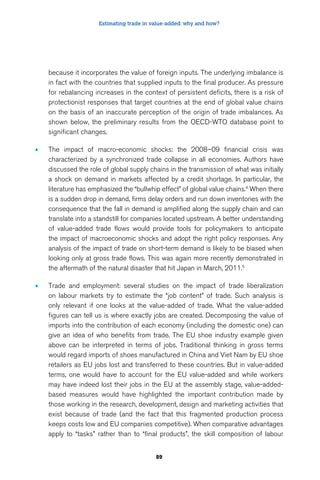
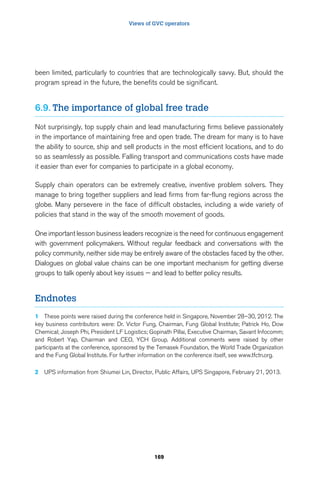
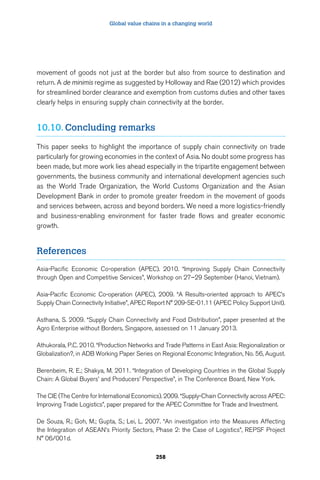
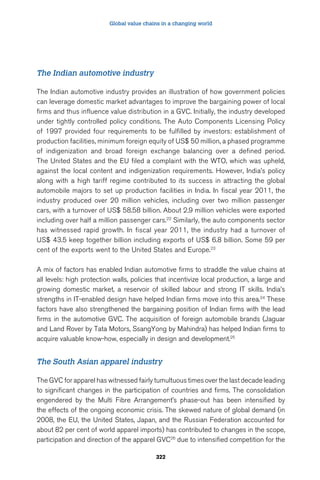
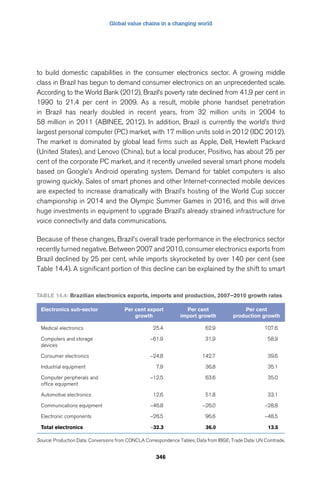
Appendix 5.2. Effective protection rates and anti-export
j i i ij
( )+ ( )
j i i
f
ij i i
. .
154
bias
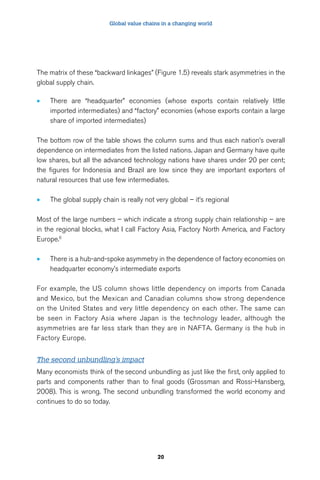
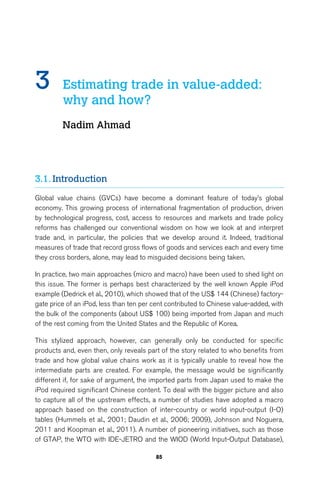
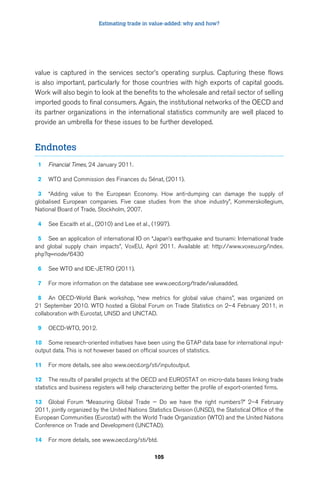
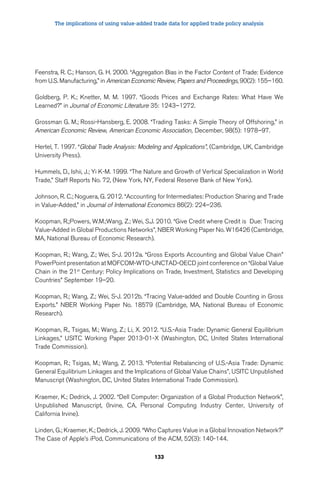
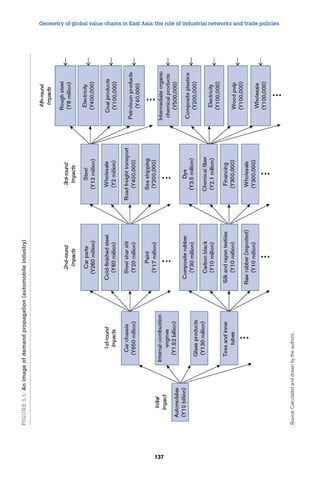
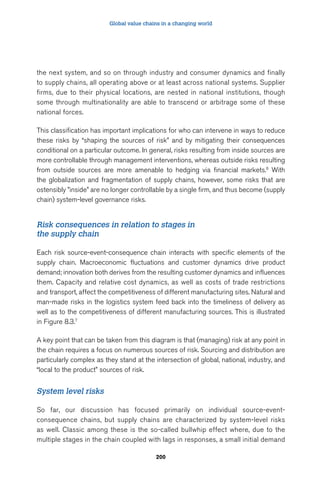
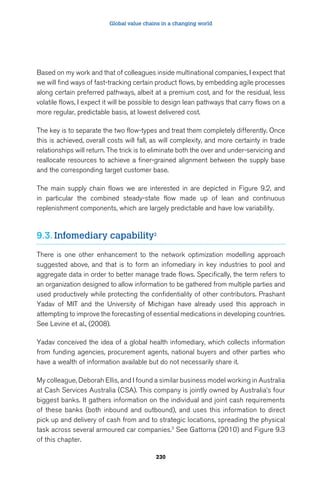
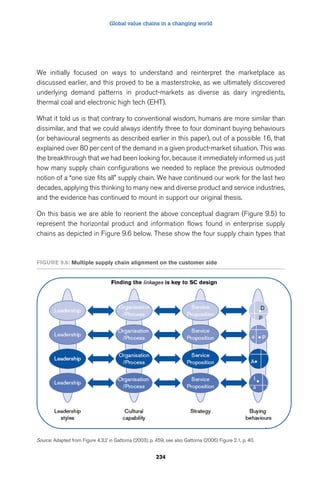
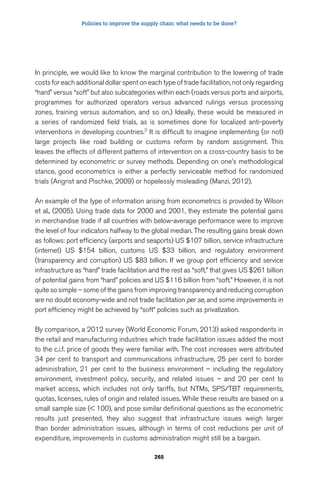
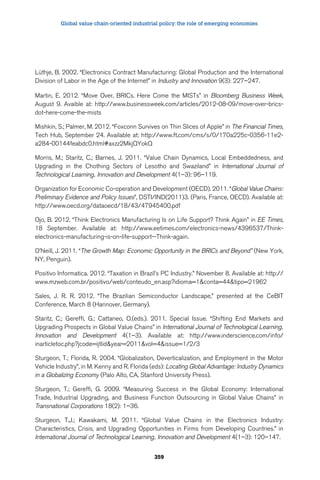
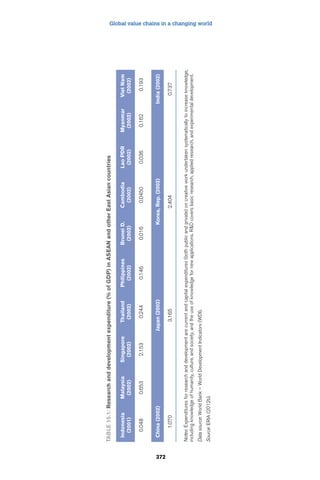
EPR for sector “j” is the difference between the nominal protection enjoyed on the
output minus the weighted average of tariff paid on the required inputs.
It is given by:
EPR
t t a
j a
i ij
=
−
−
( )
1
.
[3]
With aij : elements of the matrix A of technical coefficients in an input-output matrix,
tj : nominal tariff on sector “j”,
ti : nominal tariff on inputs purchased from sector “i”. “i” can be equal to “j” when a firm
purchases inputs from other firms of the same sector of activity. In an inter-country
framework, “i” includes also the partner dimension [c] as inputs from sector “i” might
be domestic or imported.
Note that [1 - Σiaij ] is the rate of sectoral value added per unit of output when there is
no tariff and the domestic prices of tradable goods are similar to the international ones
(free trade). Therefore, EPRs are the ratio of the value added obtained considering
the given (applied) tariff schedules compared to a situation of free trade and no tariff.
It can be negative when firms pay a high tariff on their inputs but have a low nominal
protection on their output.
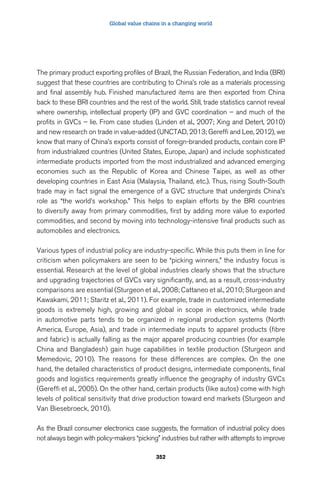
Tariff duties influence the domestic price of all inputs, including domestically produced.
Domestic suppliers of tradable goods will be able to raise their own prices up to the
level of the international price plus the tariff duty, without running the risk of being
displaced by imports. Distinguishing between domestic and foreign inputs, EPR can
therefore be written as:
EPR
t ta t a
j a
h
ij
i ij
=
−
−
1
[4]](https://image.slidesharecdn.com/aid4tradeglobalvalue13e-140909015815-phpapp01/85/Aid4tradeglobalvalue13-e-179-320.jpg)
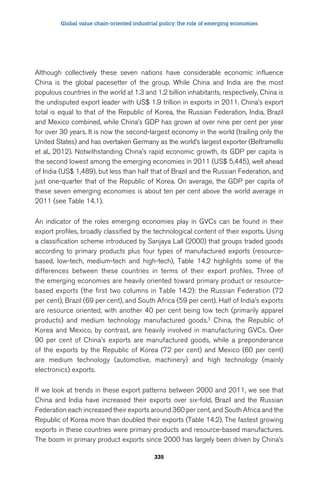
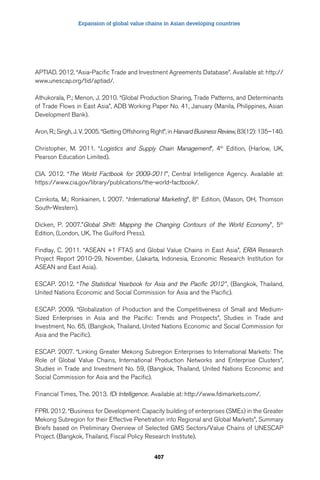
![Geometry of global value chains in East Asia: the role of industrial networks and trade policies
t a t a
a
a ta
a
155
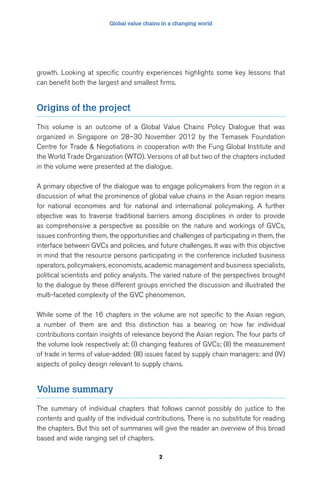
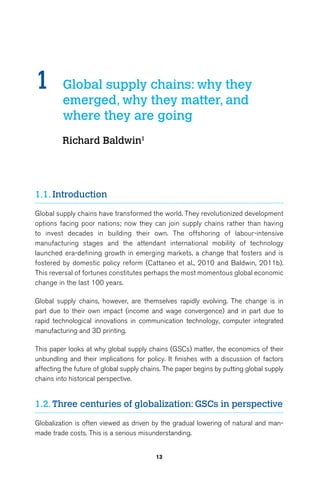
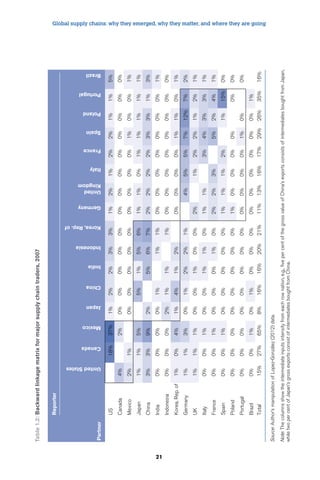
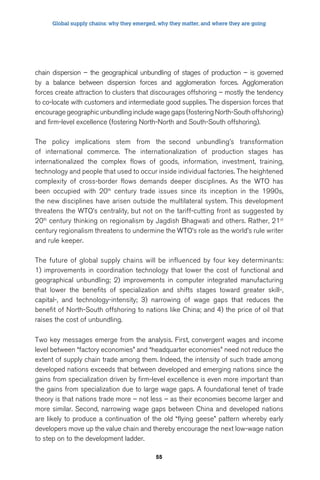
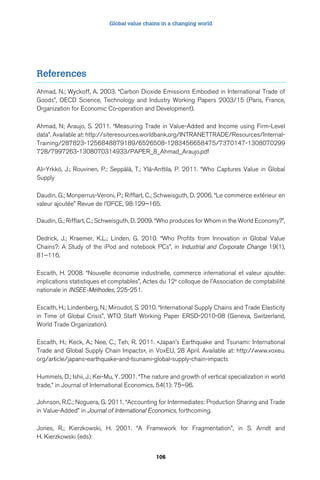
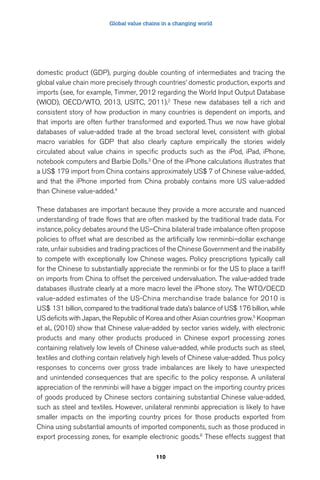
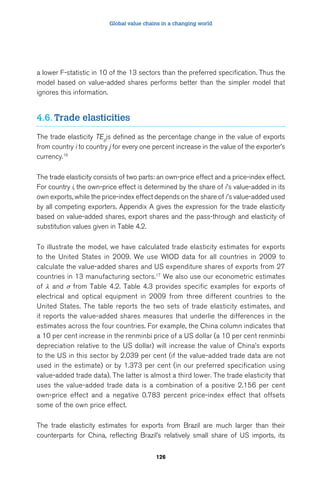
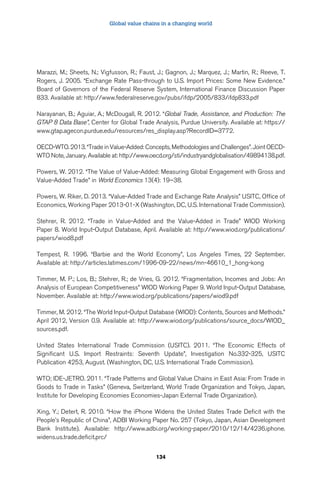
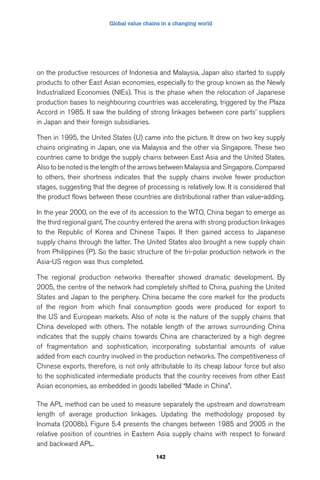
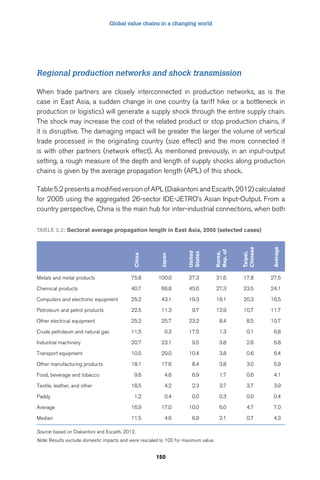
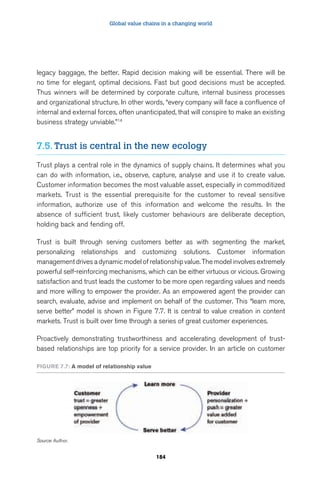
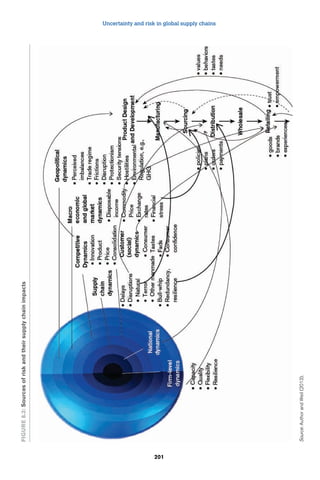
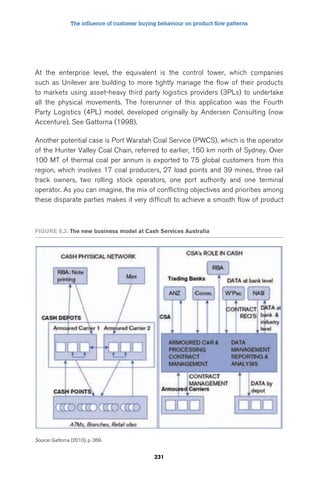
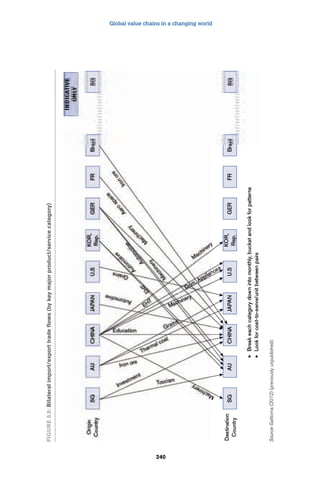
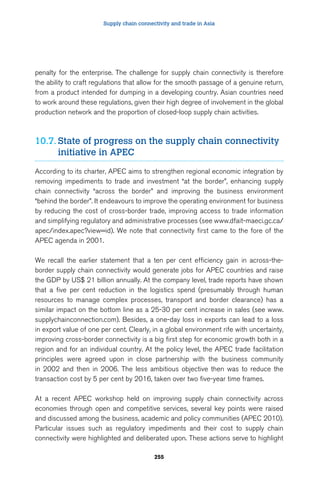
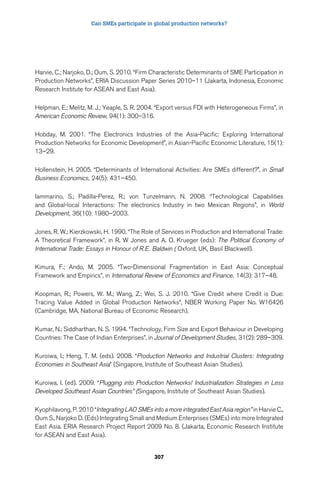
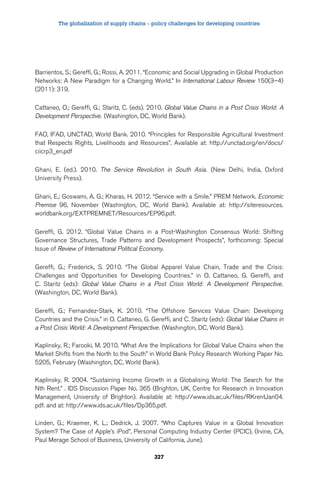
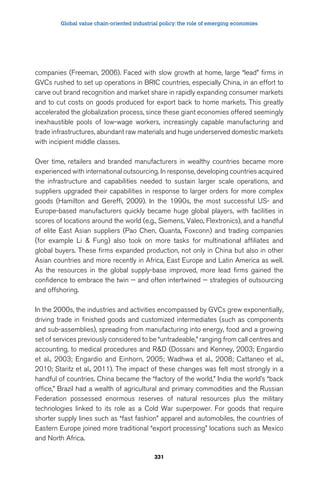
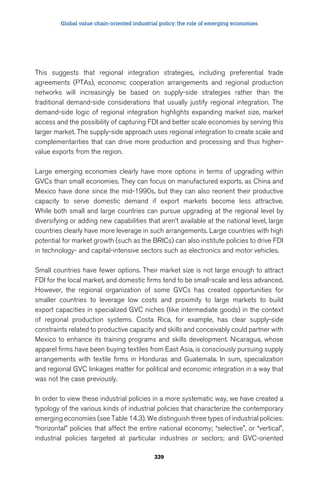
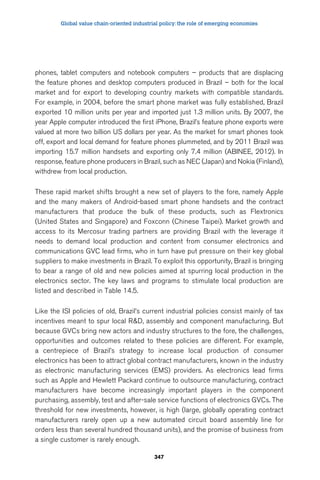
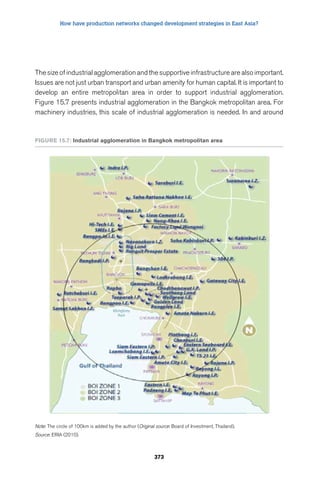
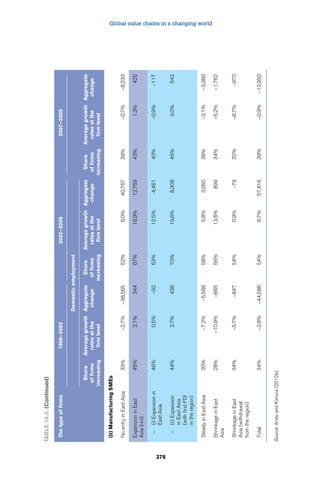
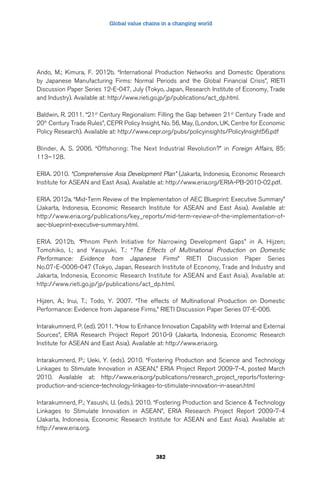
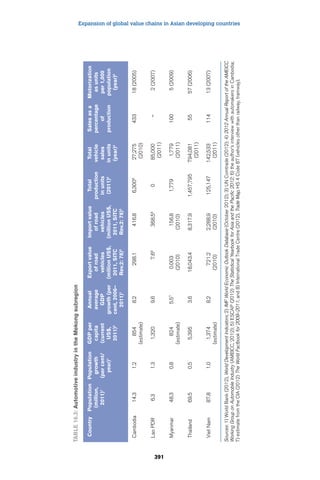
With af
ij and ah
ij the intermediate consumption “i” from, respectively, foreign and home
country required to produce one unit of output “j”.
From a “trade in tasks” perspective, we can deduce two important conclusions from
equation [4]:
(i) A high positive EPR reduces protected sectors’ incentive to export, as their rate
of return on the domestic market is higher than what they can expect on the
international one. Similarly, an exporting firm will be in an inferior position vis à
vis a foreign competitor operating in a free trade environment, as its value-added
when selling at world price is lower than its free-trade competitor, as shown in [5].
1 ( )+ ( )
1
1
. . −
−
i i
f
ij i i
h
ij
i ij
[5]
(ii) When duty draw-backs or tariff exemption (as in export processing zones) correct
for this bias and allow domestic producers to purchase inputs at international
prices, export-oriented firms still have a disincentive to purchase inputs internally
as their second-tier domestic suppliers won’t be able to benefit from the duty
exemption (see [6]).9
1 + ( )
1
1
. −
−
i
f
ij i i
h
ij
i ij
[6]
While the anti-export bias [5] is a well-known result from a traditional trade in final
goods perspective, new corollary [6] is relevant only from a vertical specialization
perspective, where a “buy” decision arising from a “make or buy” assessment implies
arbitraging between domestic and foreign suppliers.
Endnotes
1 The reason for using the impact shares as weights is as follows. If a calculated share is small, this
implies that the corresponding path has a small contribution to the overall circuit of impact delivery;
so this path is considered relatively insignificant in the supply chains and hence the number of
production stages it has should be weighted less.
2 A more extensive analysis was carried out in Romero et al. (2009), in which the effects of
fragmentation on the complexity of the Chicago economy were studied from a set of input-output
tables estimated for the period 1978–2014.](https://image.slidesharecdn.com/aid4tradeglobalvalue13e-140909015815-phpapp01/85/Aid4tradeglobalvalue13-e-180-320.jpg)


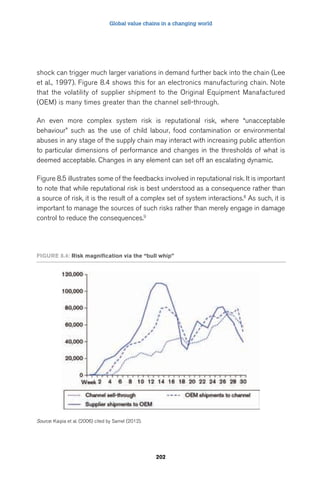

![Global value chains in a changing world
Paradoxically, company executives, thinking that more standardization of processes
and underlying systems would reduce the complexity they face, have in fact made
things worse as the new [more rigid] systems installed have further reduced the
degree of natural “alignment” with customers, and in so doing led to more exceptions,
increased cost-to-serve, and more (rather than less) complexity. This is a good
example of what happens when attempting to fix a problem from the inside out.
At the country level, complexity has arisen simply because of the rate of growth
that has occurred in the process swamping existing capabilities. China is a good
example of this. India is another example that is in an even worse situation because
of its poor infrastructure. At least China has made giant advances in this particular
area. Yet both countries lag in finding solutions to smooth the flow of trade
through their inbound and outbound supply chains as evidenced by their low
standing in the Ease of Doing Business Index referred to later in this paper. See
Lawrence et al., (2012).
Fortunately, we now have at our disposal network optimization modelling techniques
that have the potential to cut through complexity and allow us to in effect find
the lowest cost pathways through nominated networks, from the supply base to
customers, anywhere in the world. These mixed integer mathematical models have
been available for the last few decades, but it has taken the hardware on which
they run time to catch up and achieve the required higher processing speeds. The
best models currently available are designed by Solvoyo (Boston) and Llamasoft
(Ann Arbor).
In addition, instead of running the models against some arbitrary objective function,
we can link them to the behavioural segmentation mentioned above and in the
process find out what the possible pathways and corresponding cost-to-serve are
for any given product-market combinations, under particular operating conditions,
including government taxes or incentives, tariffs and carbon footprint. Indeed, there
is practically no scenario that we cannot model these days, and the result is a whole
new level of more informed decision-making by executives and government officials.
These new Decision Support Systems (DSS) are likely to provide a bright new avenue
for exploring government policy options in the future, especially where constraints
are placed on trading flows across borders. The core concern is to be in a position
to make more informed decisions, and for confirmation of this you only have to look
around the world at the winning sporting teams who benefit by making better, faster
and more timely decisions than their opponents in the heat of competition.
228](https://image.slidesharecdn.com/aid4tradeglobalvalue13e-140909015815-phpapp01/85/Aid4tradeglobalvalue13-e-253-320.jpg)


![Global value chains in a changing world
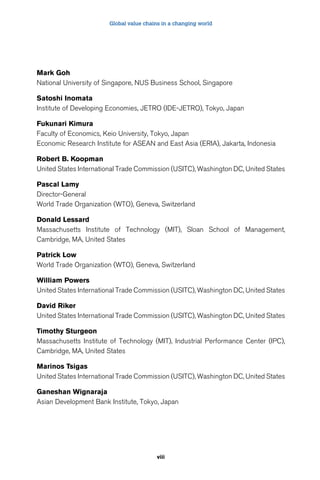
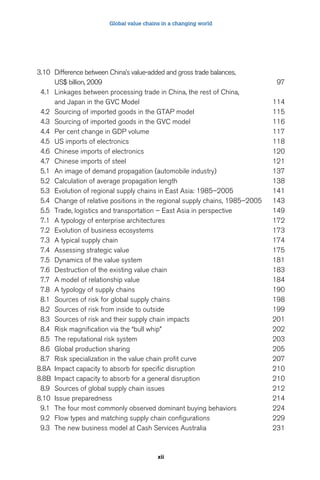
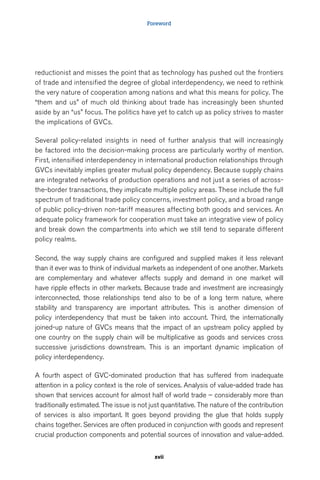
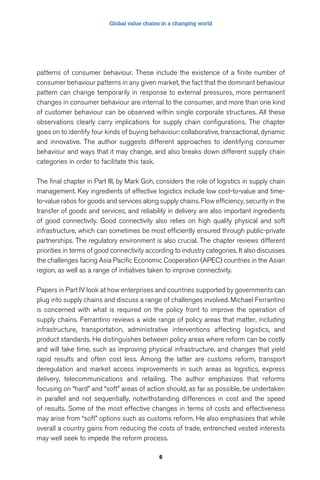
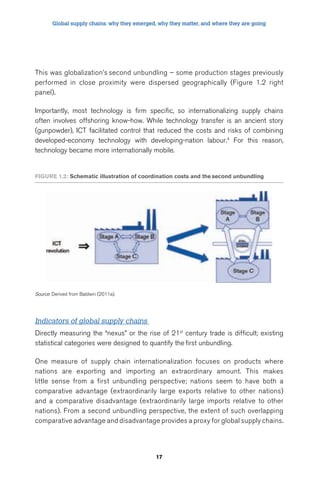
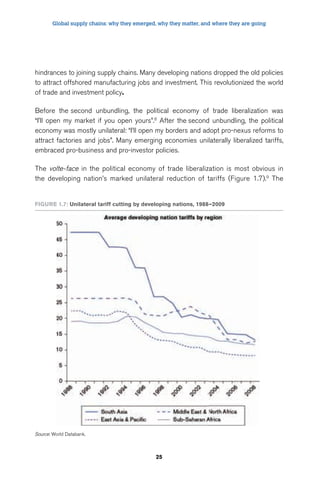
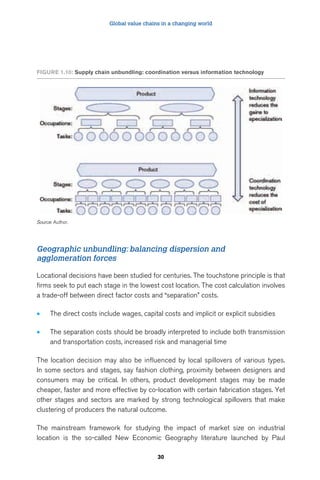
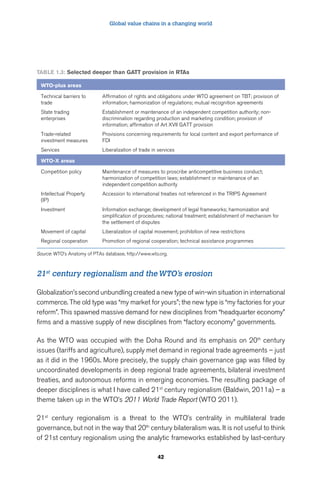
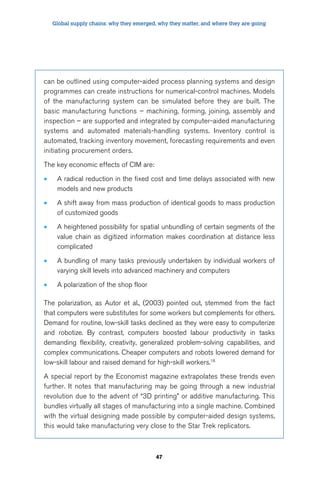
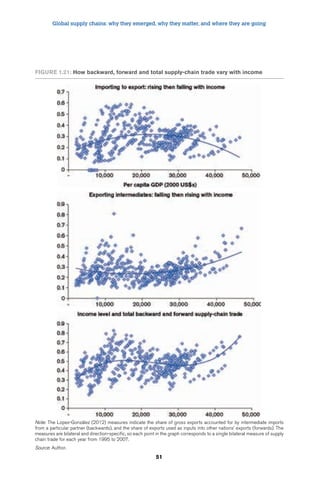
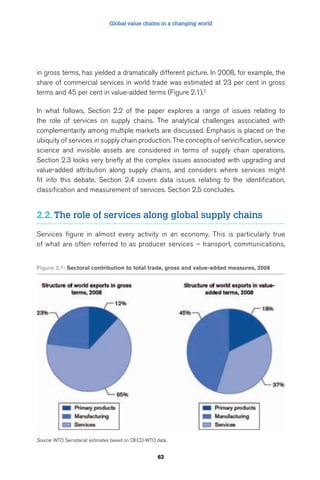
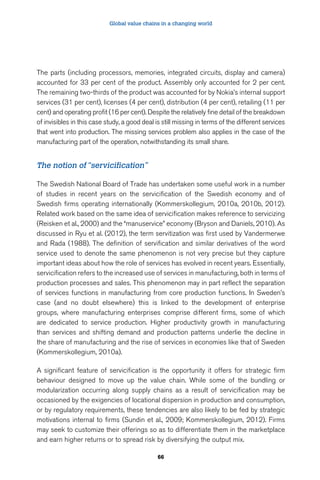
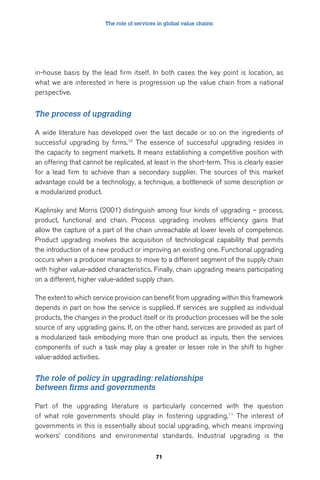
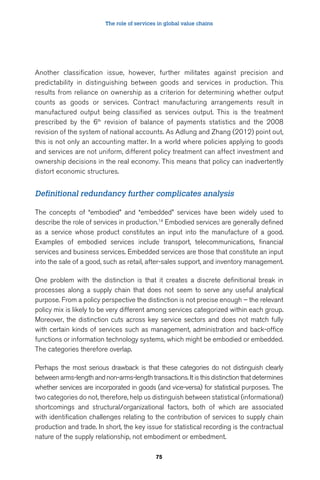
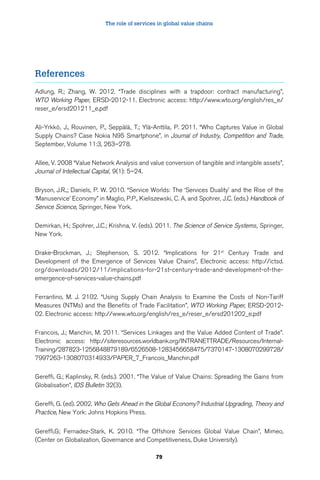
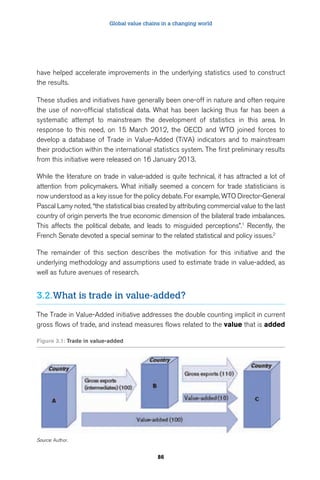
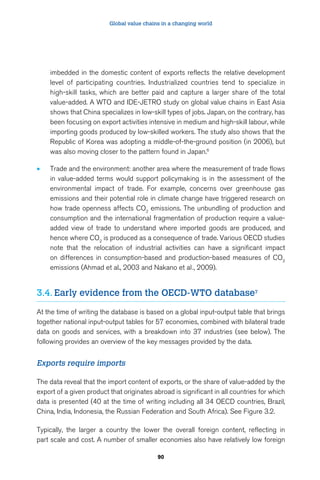
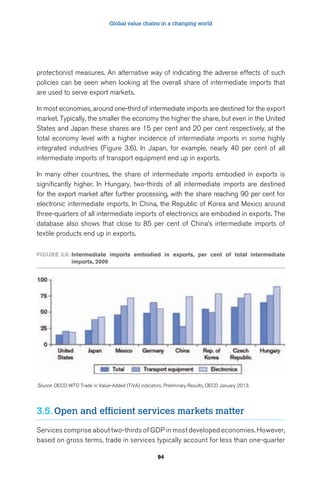
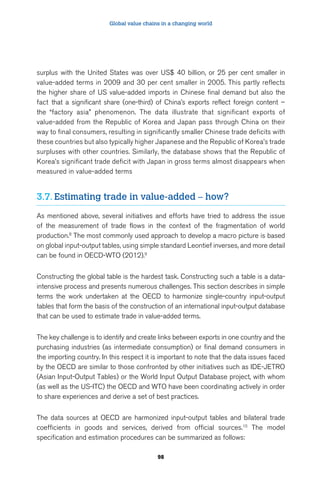
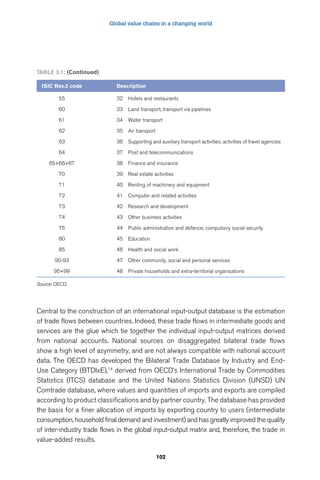
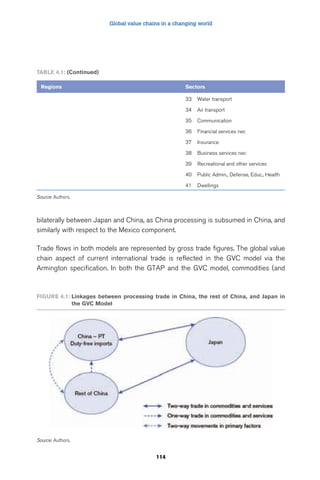
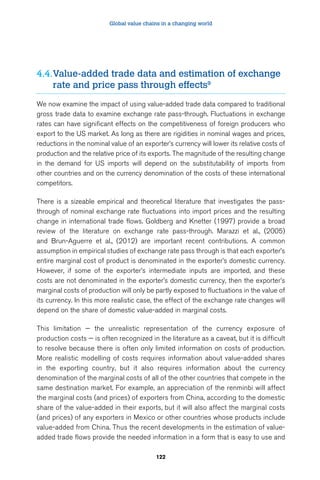
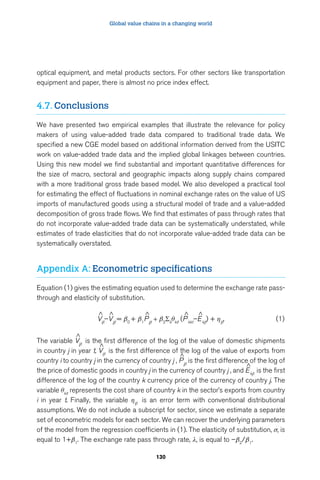
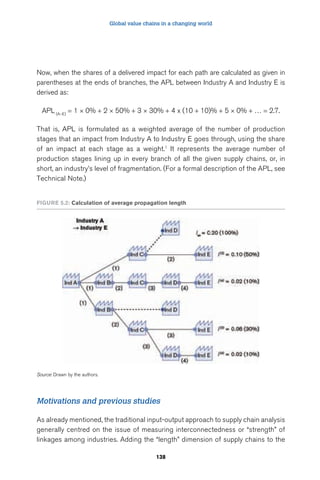
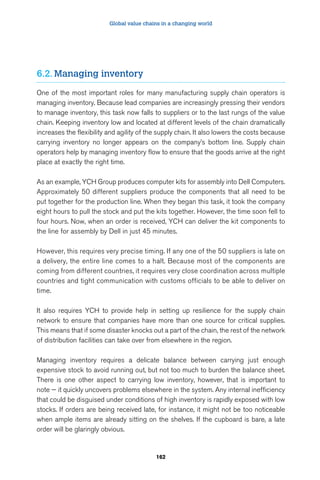
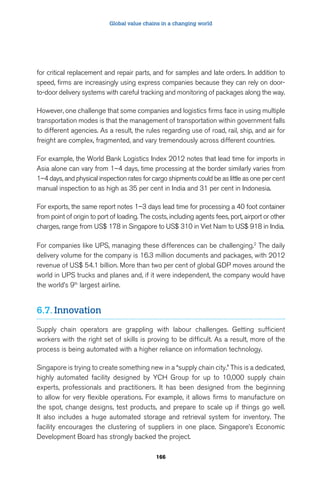
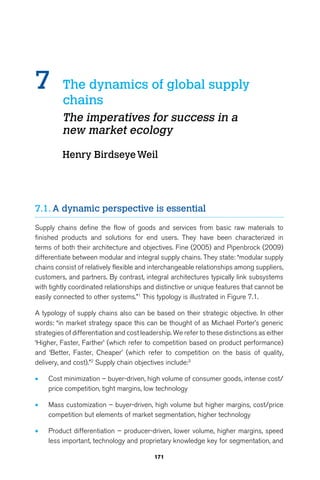
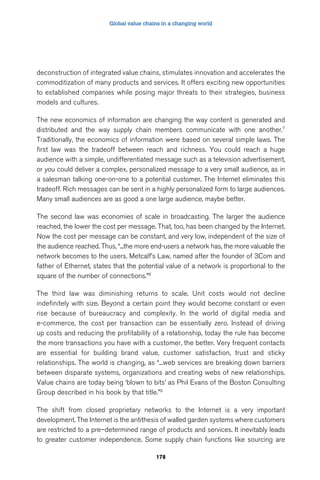
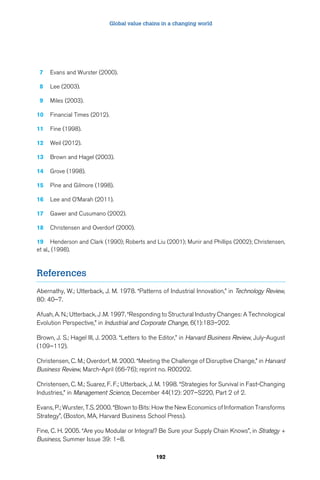
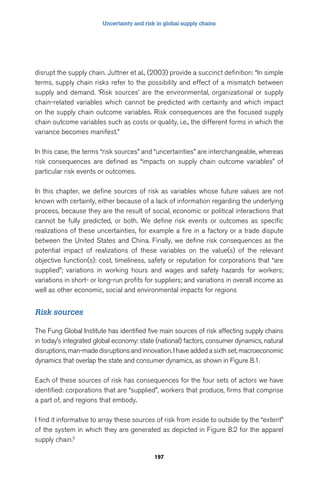
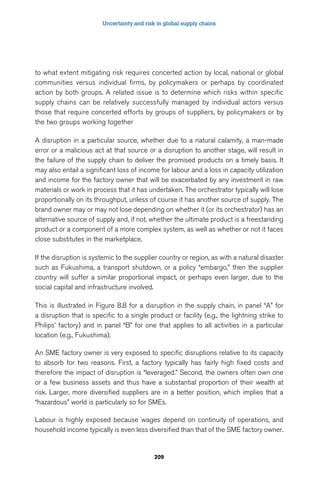
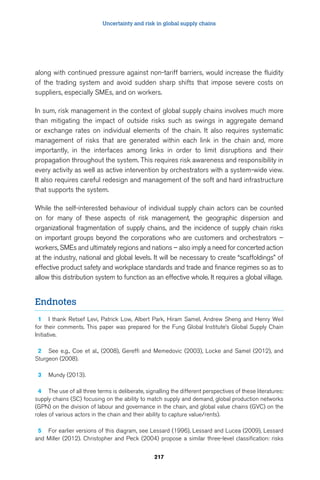
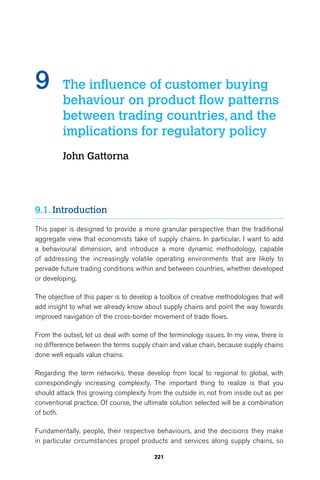
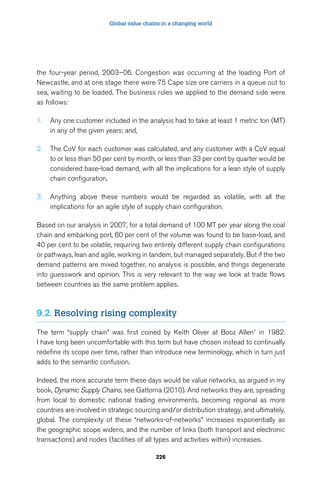
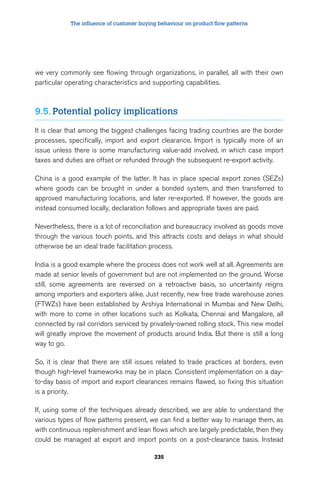
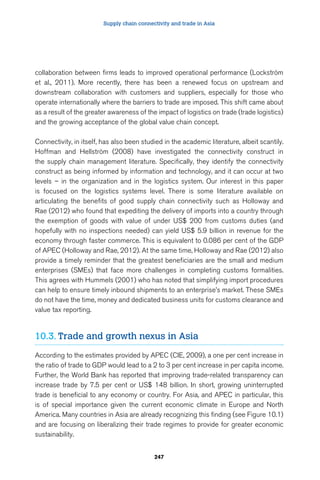
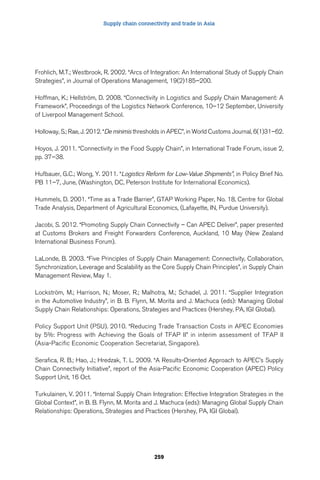
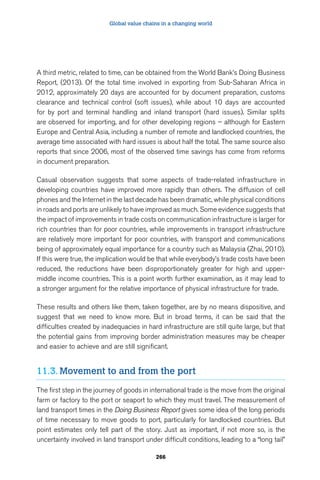
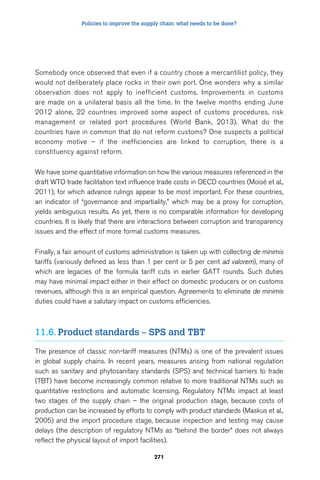
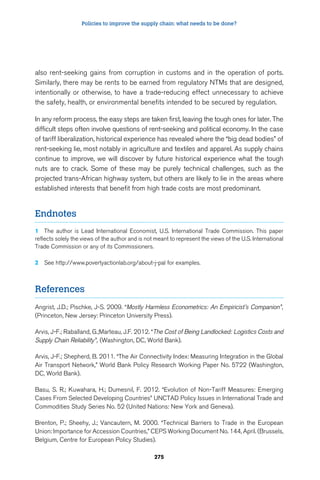
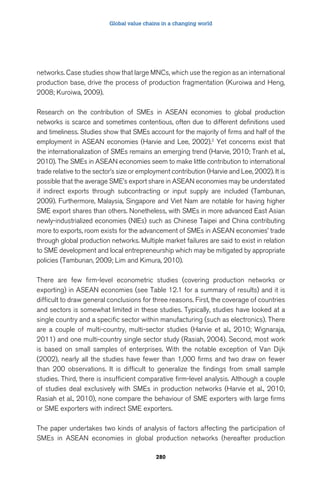
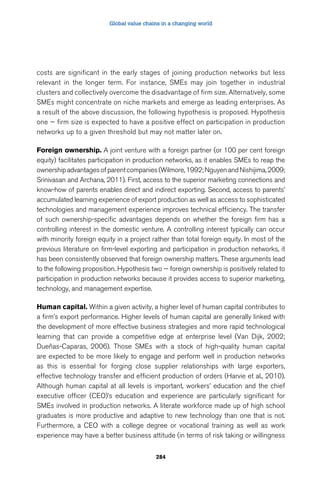
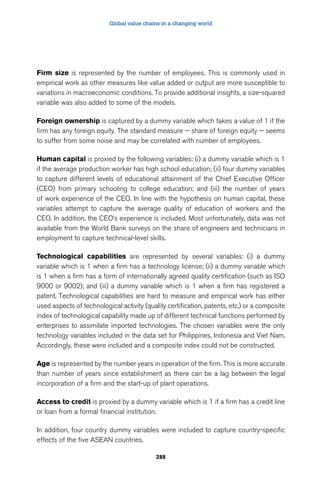
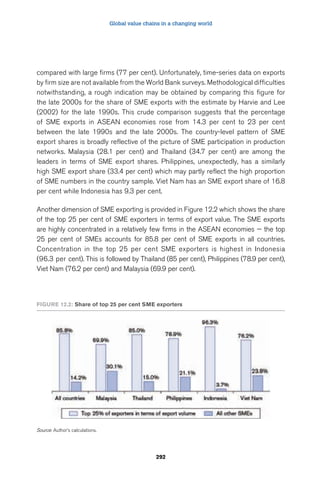
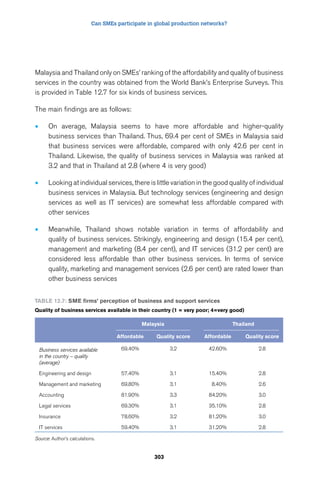
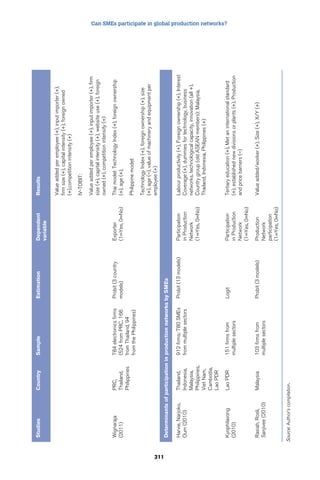
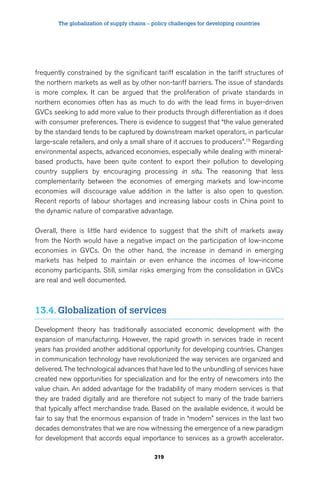
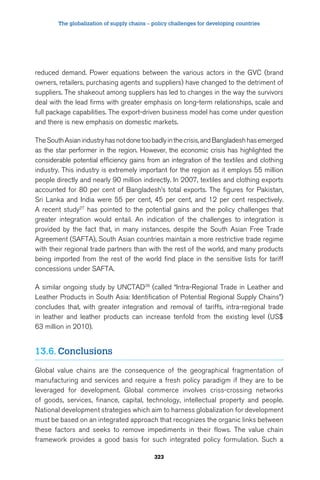
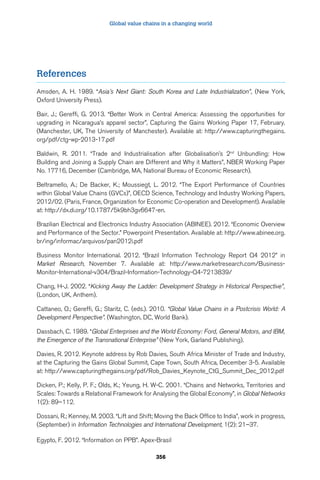
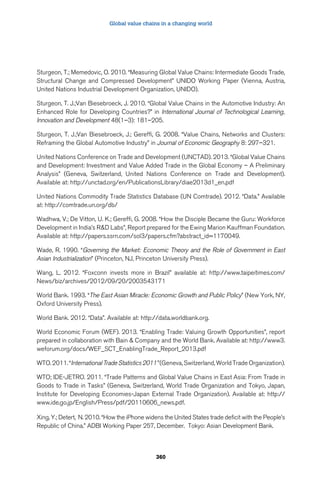
Table 12.5: Probit estimates
Binary Variable: 1 if part of production network, 0 otherwise
SMEs only All firms
All firms in PN Sustained
296
exporter
All firms in PN Sustained
exporter
All All All All
[1] [2] [3] [4]
Firm size 0.012*** 0.010*** 0.002*** 0.001***
(0.001) (0.001) (0.000) (0.000)
Firm size squared -0.000*** -0.000***
(0.000) (0.000)
Foreign ownership 0.547*** 0.500*** 0.566*** 0.533***
(0.071) (0.081) (0.050) (0.053)
GM has primary education 0.329 0.070 0.167 0.131
(0.415) (0.499) (0.285) (0.365)
GM has secondary 0.482 0.086 0.372 0.256
(0.404) (0.487) (0.273) (0.351)
GM has vocational degree 0.538 0.156 0.516* 0.387
(0.407) (0.491) (0.276) (0.354)
GM has college degree 0.515 0.159 0.595** 0.564
(0.403) (0.484) (0.272) (0.349)
GM’s experience 0.003 0.007** 0.003 0.005**
(0.003) (0.003) (0.002) (0.002)
Workers have HS
education
0.255*** 0.162** 0.181*** 0.053
(0.059) (0.071) (0.045) (0.050)
Firm uses foreign licenses 0.196*** 0.093 0.169*** 0.027
(0.073) (0.087) (0.055) (0.061)
Firm is ISO certified 0.311*** 0.144* 0.403*** 0.100*
(0.071) (0.084) (0.049) (0.053)
Firm has registered
patents
0.218*** 0.055 0.331*** 0.063
(0.073) (0.090) (0.056) (0.062)
Access to credit 0.094* -0.005 0.141*** 0.045
(0.054) (0.066) (0.042) (0.046)
Firm Age -0.004* -0.011*** -0.004* -0.009***
(0.003) (0.003) (0.002) (0.002)](https://image.slidesharecdn.com/aid4tradeglobalvalue13e-140909015815-phpapp01/85/Aid4tradeglobalvalue13-e-321-320.jpg)
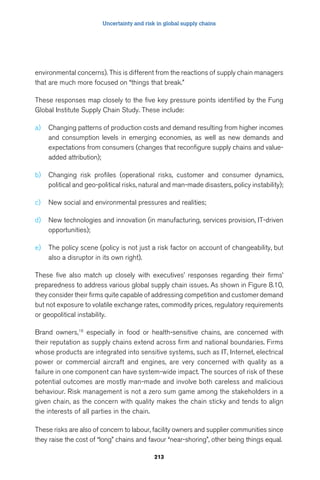
![Can SMEs participate in global production networks?
SMEs only All firms
All firms in PN Sustained
297
exporter
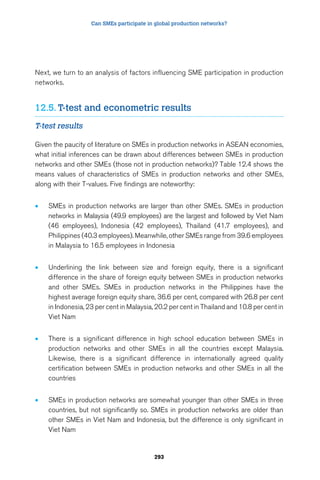
All firms in PN Sustained
exporter
All All All All
[1] [2] [3] [4]
Philippines 0.260** 0.143 -0.201** -0.166*
(0.110) (0.126) (0.080) (0.085)
Indonesia -0.130 -0.322** -0.399*** -0.391***
(0.117) (0.143) (0.082) (0.091)
Viet Nam 0.425*** 0.060 0.156* -0.099
(0.112) (0.133) (0.080) (0.087)
Malaysia 0.841*** 0.526*** 0.634*** 0.452***
(0.094) (0.107) (0.068) (0.070)
Pseudo-R-squared 0.205 0.146 0.267 0.178
N 3,903 3,903 5,641 5,641
* p 0.1, ** p 0.05, *** p 0.01
Robust standard errors in parentheses
Thailand was used as reference.
All firms in PN 1 if more than 0 % of sales are exported (directly or indirectly); 0 otherwise
Sustained exporter 1 if more than 40 % of sales are directly exported; 0 otherwise
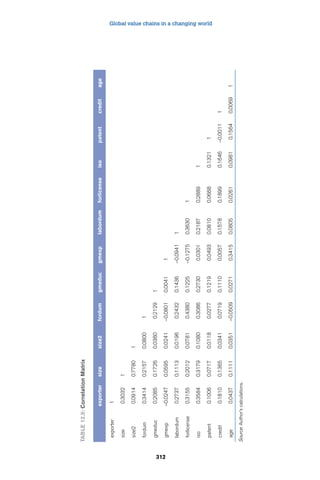
Source: Author’s calculations.
The foreign ownership variable has a positive and significant effect on the probability
of SME participation in production networks in both models. Having any proportion of
foreign equity corresponds to a 31 per cent probability of an SME joining a production
network in the all-SMEs model one (column one). This is double the 15 per cent
figure for a wholly-domestically-owned SME. Access to the superior marketing
connections and know-how of parents enables direct and indirect exporting by
SMEs. Furthermore, access to parents’ accumulated learning experience of export
production as well as access to sophisticated technologies and management
experience improves technical efficiency in SMEs.
The coefficient on workers high school education is positive and significant in both
models. Having a high school-educated workforce increases the probability of an
SME joining a production network from 14 per cent to 21 per cent in the all-SMEs
model one. Furthermore, the CEO’s experience is positive and significant in the](https://image.slidesharecdn.com/aid4tradeglobalvalue13e-140909015815-phpapp01/85/Aid4tradeglobalvalue13-e-322-320.jpg)


This document is an edited volume on global value chains (GVCs) in a changing world. It contains 16 chapters contributed by experts in the field. The introduction provides an overview of the volume, which aims to examine how GVCs are evolving and the implications for policymakers. Part I looks at changing features of GVCs, including their emergence and growth, as well as the increasing role of services. Part II analyzes methods for measuring trade in value-added terms. Part III discusses issues for GVC managers. Part IV explores policies for integrating into GVCs, including the ability of SMEs and developing countries to participate. The conclusion is that GVCs are in flux and policies must adapt to remain relevant


