Aid Effectiveness in Times of Political Change: Lessons from the Post-Communist Transition

In this paper we argue that aid effectiveness may suffer when partnerships with new regimes need to be established. We test this argument using the natural experiment of the break-up of communism in the former Eastern Bloc. We find that commercial and strategic concerns influenced both aid flows and the urgency of entry into new partnerships in the first half of the 1990s, while developmental objectives became more important only over time. These results hold up to a thorough sensitivity analysis, including using a gravity model to instrument for bilateral trade flows. We also find that aid fractionalization increased substantially, and that aid to the region was more likely to be tied, more volatile and less predictable than to aid to other recipients at the time. Overall, these results suggest that the guidelines for aid effectiveness agreed upon in the Paris Declaration are likely to be challenged by the current political transition in parts of the Arab world. Hopefully being aware of these challenges can help donors avoid making the same mistakes.

Recommended
Recommended
More Related Content
What's hot
What's hot (20)
Viewers also liked
Viewers also liked (15)
Similar to Aid Effectiveness in Times of Political Change: Lessons from the Post-Communist Transition
Similar to Aid Effectiveness in Times of Political Change: Lessons from the Post-Communist Transition (20)
More from Stockholm Institute of Transition Economics
More from Stockholm Institute of Transition Economics (20)
Recently uploaded
Recently uploaded (20)
Aid Effectiveness in Times of Political Change: Lessons from the Post-Communist Transition
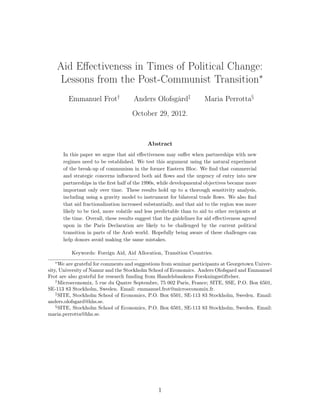
- 1. Aid Effectiveness in Times of Political Change: Lessons from the Post-Communist Transition∗ Emmanuel Frot† Anders Olofsgård‡ Maria Perrotta§ October 29, 2012. Abstract In this paper we argue that aid effectiveness may suffer when partnerships with new regimes need to be established. We test this argument using the natural experiment of the break-up of communism in the former Eastern Bloc. We find that commercial and strategic concerns influenced both aid flows and the urgency of entry into new partnerships in the first half of the 1990s, while developmental objectives became more important only over time. These results hold up to a thorough sensitivity analysis, including using a gravity model to instrument for bilateral trade flows. We also find that aid fractionalization increased substantially, and that aid to the region was more likely to be tied, more volatile and less predictable than to aid to other recipients at the time. Overall, these results suggest that the guidelines for aid effectiveness agreed upon in the Paris Declaration are likely to be challenged by the current political transition in parts of the Arab world. Hopefully being aware of these challenges can help donors avoid making the same mistakes. Keywords: Foreign Aid, Aid Allocation, Transition Countries. ∗ We are grateful for comments and suggestions from seminar participants at Georgetown Univer- sity, University of Namur and the Stockholm School of Economics. Anders Olofsgard and Emmanuel Frot are also grateful for research funding from Handelsbankens Forskningsstiftelser. † Microeconomix, 5 rue du Quatre Septembre, 75 002 Paris, France; SITE, SSE, P.O. Box 6501, SE-113 83 Stockholm, Sweden. Email: emmanuel.frot@microeconomix.fr. ‡ SITE, Stockholm School of Economics, P.O. Box 6501, SE-113 83 Stockholm, Sweden. Email: anders.olofsgard@hhs.se. § SITE, Stockholm School of Economics, P.O. Box 6501, SE-113 83 Stockholm, Sweden. Email: maria.perrotta@hhs.se. 1
- 2. 1 Introduction The global development architecture has changed substantially during the last 10 years. Donor countries outside of the OECD have grown more important, non-state actors such as global NGOs and philanthropists have proliferated, and many aid recipients have also become donors in their own right (Kharas, 2011). At the same time, there has been political turnover in many recipient countries, most dramatically recently in the Middle East and North Africa region. New regimes have come to power, political elites have changed and competition for economic rents has become more open. Altogether this means that many new partnerships between donors and recipients have been established, and often in a setting in which the political and economic future of recipient countries is uncertain. In this paper we argue that the salience of other foreign policy interests in times of political transition can cause a challenge for aid effectiveness in different ways. In particular, commercial and strategic interests may dominate early on in a relationship, whereas development concerns may become more salient only as the relationship matures. Furthermore, ambitions to stop aid fragmentation, to respect ownership and reduce aid volatility and unpredictability may also be frustrated in the rush to establish new political connections and influence the future direction of the country. The Arab Spring has naturally attracted an enormous attention, with Western countries offering foreign aid for governments pursuing democratic reforms and lib- eralizing their economies.1 The EU countries refer to their strategy for the southern neighborhood as ‘more for more’: more financial support but only in exchange for credible de facto political and economic reforms. At the same time, foreign policy is also guided by other priorities, such as commercial ties (in particular with resource rich countries such as Libya), security concerns and fear of mass-migration. There is also a battle for influence in the region, with oil-rich Gulf states supporting a more religiously conservative, authoritarian and inward looking future agenda. The ques- tion is to what extent the broader foreign policy interests will influence aid policy, and whether the focus on effectiveness agreed upon in the Paris Declaration and subsequent High-Level meetings will be upheld. Why should then strategic and commercial influence pose a particular challenge early on in a development cooperation partnership? What we argue is that strate- gic and commercial relationships typically involve competition with other potential donors. In such competition there is a clear ‘first mover advantage’: commercial gains from being the first to establish trade contacts or first to gain exploration rights, or strategic gains from being first to establish political connections with new 1 Another current case that has attracted substantial attention from foreign governments and donors is the opening up of Burma. Canada, EU and Denmark, among others, have announced increased aid and easening of sanctions during the year (Parks, 2012). 2
- 3. regimes. There are several historical cases in which global powers have had con- flicting interests in the future path of aid recipient countries. Think for instance of Western donors versus the Soviet Union during the Cold War, Western donors versus Russia in regards to other members of the Commonwealth of Independent States (CIS) in the 2000s, or Western donors versus the Gulf countries in regards to the current situation in the Middle East and North Africa region. In these cases, foreign powers have used aid as a tool (among others) to gain allies and bolster the power of those with supportive views (Boschini and Olofsgård, 2007; Carothers, 2006)2 . A similar logic applies to commercial relationships. An early foothold into a market with commercial potential can give an investor or an exporter an important advantage relative to its competitors, since it is generally costly to change investor and trade relationships once established. To gain an edge in that competition, donor countries sometimes provide aid as an additional sweetener to seal the deal for a domestic company (Schraeder et al., 1998). Humanitarian concerns, on the other hand, are a public good and largely non- competitive (at least not excludable). As such, there should be less urgency to establish relationships with countries targeted primarily for humanitarian reasons. Rather the opposite; as with all public goods there is a tendency for under-provision of resources since the full cost of the expenditures, but only part of the benefits, are internalized (Stone, 2010). By holding out, donors can also learn from other donors’ mistakes operating in the environment of a particular recipient, and thereby increase the effectiveness of their effort. Over time, as strategic and trade relationships be- come more solid, aid becomes a less essential instrument to achieve commercial ben- efits and ideological loyalty. Certain strategic concerns, such as nuclear containment in the former Soviet Union and access to military bases in countries neighboring con- flict zones, are temporary in nature. Trade relationships become more dependent on actual commercial value as they mature, and alternative ways to maintain the rela- tionship evolve. Aid remains instead the primary and essential tool for promotion of economic development and humanitarian support, also as the relationship matures. We therefore expect that, over time, humanitarian motives become relatively more important, and commercial and strategic ones relatively less so. Commercial and strategic motivations can affect aid effectiveness both directly and indirectly. They have a direct effect if they imply that aid does not flow to the countries or sectors in which it is most likely to have an impact, if they undermine aid conditionality, and if they help incompetent and corrupt regimes stay in power. Stone (2010) finds that the impact of aid depends on its motivation, and argues that this at least partially has to do with the credibility of aid conditionality. If aid is motivated by commercial interests, conditions on economic and political reforms will 2 Egypt turned down a 3 USD billion credit from the IMF in 2011 in anticipation of equally generous loans but with less strings attached from Saudi Arabia and the Emirates. 3
- 4. not carry much clout, and it is no secret that nations of strategic importance have received large flows of aid despite deplorable human rights records in the ages of the Cold War and the war on terror. This is especially relevant for the EU donors in their strategy to offer ‘more for more’ to their southern neighbors. In the end, if aid becomes dominated by commercial interests, stronger conditions on paper will mean nothing. If enforcing conditionality goes against the interests of the donors, it will not be credible. Collier and Dollar (2002) compare actual aid allocation with a model of “efficient” aid allocation emphasizing the role of proper economic policies and need. They argue that a reallocation based on where aid is most likely to contribute to development, could lift 50 million more individuals above the poverty line. There can also be indirect effects in the form of deteriorating aid practices. As stated in Knack and Eubank (2009), "When bilateral donors use aid to advance diplomatic or commercial objectives, incentives to rely on their own parallel systems for aid delivery will be further aggravated. For example, using their own procurement rules will likely advantage donor-country contractors." Commercial interests may also increase pressure for tying aid, and aid may become more fractionalized and volatile as donors rush in, eager to be relevant. The question is if the main themes agreed upon in the Paris Declaration, ownership, alignment, harmonization and results, will survive the onslaught. How these different objectives in the end will shape western aid policy in the MENA region is too early to judge. Instead we focus in this paper on the case of Central and Eastern Europe (CEEC) and the Commonwealth of Independent States (CIS) in the early years of their transition towards market economies. Also then western donors stood ready to offer foreign aid in support of transition towards democracy and open markets, but strategic and commercial interests were in the mix as well. The future path of Russia was uncertain, pushing Western Europe to quickly embrace the Eastern and Central European countries in order to secure their loyalty. Russia, Ukraine, Belarus and Kazakhstan had nuclear arms, and countries such as Russia, Poland, Czechoslovakia (later divided into the Czech Republic and the Slovak Republic) and Ukraine were perceived as having great commercial potential. Despite the common denominator of being part of the Eastern Block, these countries varied substantially in terms of strategic importance, commercial potential, and levels of economic development and poverty. The sudden opening up of these countries therefore serves as a natural experiment to investigate the early motivation behind aid partnerships. In particular, by looking at the allocation of aid across recipients, how that allocation has changed over time, and the urgency by which donors entered certain markets, we get a sense of the relative role of strategic interests, commercial interests, and the ambition to alleviate poverty in the early goings, and how that has changed over time. We can also, though more tentatively due to limited data, look at some aspects of aid practices. For instance, we look at what happened 4
- 5. to aid fragmentation in the early 1990s, and whether aid to CEEC and CIS was different from aid to other recipient countries in aspects such as volatility, tying and predictability. The paper is organized as follows. In the next section we offer a discussion of the relevant literature. In section 3 we look at aid allocation to CIS and CEEC countries in the years 1990 to 1995, and how it compares to the allocation to other recipients at the time. In section 4 we look at trends over a longer time period, showing how aid allocation to the region changed with the maturity of relationships between donors and recipients. Section 5 addresses entry decisions looking at the speed of entry into CIS and CEEC countries. In section 6 we do a sensitivity analysis of our main results, and in section 7 we look at some measures of aid effectiveness directly related to the objectives laid out in the Paris declaration. Finally, we conclude in section 8. 2 The literature on aid allocation There is by now a quite sizable literature on the motivation for aid. Most of this literature uses a ‘revealed preferences’ argument and studies the allocation of aid across recipients with different characteristics to derive an idea of what donors really prioritize. If aid was predominantly motivated by the ambition to alleviate poverty, we would expect to see donors predominantly target poor countries. Given that the chances that aid will reduce poverty also depend on the economic and political environment in the recipient country, we may also expect that the quality of macroe- conomic policies, level of political accountability, and the strength of institutions matter (Burnside and Dollar, 2000; Svensson, 1999). It has long been argued, though, that the purpose of development aid goes far be- yond the warm glow effect from giving to people in need (McKinlay and Little, 1977; Maizels and Nissanke, 1984). Aid is often (though not always) found to decrease with an increase in income, but the economic significance of poverty is typically trumped by strategic and commercial concerns. For instance, Alesina and Dollar (2000) find that aid decreases when comparing middle income to low income countries, but that within the group of low income countries, income has no significant effect. Instead measures of historical ties (former colonial status), strategic alliances (as measured by the correlation of voting records in the UN general assembly) and the Israel- Palestine conflict have a much greater explanatory power and larger economic effects on the margin. This is true also compared with measures of political openness and the quality of macroeconomic policies. Other proxies of strategic importance that have been used in the literature, and found to be significant, include arms imports (Hess, 1989; Maizels and Nissanke, 1984), arms expenditures (Schraeder et al., 1998), and membership in the UN Security Council (Kuziemko and Werker, 2006; Dreher et al., 2009). Studies on the impact of the Cold War (Boschini and Olofsgård, 2007) 5
- 6. and the ‘war on terror’ (Fleck and Kilby, 2010) suggest that strategic motives have been of particular importance in certain time periods. Commercial interests, in particular captured by trade flows or exports, have also been shown to be important in several studies. Berthélemy and Tichit (2004) find that trade flows became a more important determinant of aid allocation after the end of the Cold War. Fleck and Kilby (2010) find that exports have a significant and positive effect on US bilateral aid in the period 1955 to 2006. This is confirmed by Neumayer (2003), who finds similar results for most major bilateral donors.3 Younas (2008) finds that aid is positively correlated to imports of capital goods, but no other category of goods. He interprets this as evidence of the importance of commercial interests for aid allocation from OECD donors, since they are major producers and exporters of capital goods. Finally, some studies have also investigated the impact of geographical distance between donors and recipients, arguing that certain donors can have a particular interest in supporting a neighboring region for strategic and/or commercial reasons. The US has been shown to favor Latin America, Japan East Asia, Australia and New Zealand the Pacific nations, and Germany, Austria and Switzerland countries in the near East or South (Neumayer, 2003). Our paper is also related to the recent literature on aid effectiveness focusing on the Paris declaration. This literature uses survey responses from donors and recipients to gage progress towards the objectives. Knack et al. (2010), Easterly and Williamson (2011) and Birdsall and Kharas (2010) build a number of different indicators following the stated objectives of the Agenda. The main outcome is then a rank of the donors according to their performance along these indicators. The results are quite sobering. OECD (2011) find that only one of thirteen targets had been met by 2010. Other studies have been concerned with motivating and supporting policy action. For example, Bigsten and Tengstam (2011) quantify the gains that can be made through the full implementation of the Paris Declaration by the EU members. Frot (2009) studies a simple reform that would drastically reduce fragmentation by eliminating "small" partnerships, although leaving unaffected donors’ aid budgets and developing countries receipts. A forthcoming study by the OECD (OECD, forth. b) focuses instead on the issue of aid orphans. Knack and Eubank (2009) focus on what explains the variation in the use of country systems by donors. They find that donors trust country systems more when the quality of public financial management systems are deemed higher, when donors have more domestic support for aid among their population, and when they provide a larger share of total aid 3 Interestingly, Stone (2010) finds that, conditional on receiving aid in the first place, aid flows from France, UK, Germany and EU are all positively and significantly correlated with exports, whereas for the US the result is the opposite. A possible explanation could be that, in the US case, exports matter more for the selection of which countries to give to, rather than how much to give to those selected. 6
- 7. to that recipient (they then internalize a larger part of the cost of providing to the public good of institutional development). All in all, this literature provides criteria and in some cases explicit indicators to evaluate the quality of aid, in accordance to what donors themselves have deemed desirable and agreed upon. Some of these criteria can be applied retrospectively to the time period we focus on, to follow the changes in development cooperation under the specific circumstances. Very little has been written about the evolution of development partnerships over time. Some studies have illustrated how the emergence of sudden strategic concerns can lead to a dramatic increase in aid, or how events like the end of the Cold War can shift donor priorities and leverage more generally (Fleck and Kilby, 2010; Boschini and Olofsgård, 2007). The only paper we know of that explicitly identifies a systematic difference between early and mature partnerships is Frot (2009), who shows how aid quantities depend critically on the length of the partnership. The impact on the predicted level of aid from entering a partnership roughly seven years later is a drop in aid by approximately USD 20 million (or equivalent to the effect of having a GDP per capita level around USD 5 000 higher). Hence, Frot (2009) illustrates a significant difference between early and mature relationships, but it does not discuss how motivation behind aid may vary depending on the maturity of the relationship.4 To our knowledge, our study is the first to address this in a systematic way. The quantitative analysis that we perform serves as a test of theories on the motivation of aid disbursement that we use as a starting point, and at the same time allows us to compare the relative importance of different coexisting motivations and especially how this relative importance changed over time. In the next section, we start by identifying which factors were most important at the beginning of new aid partnerships for the case of CIS and CEEC countries. 3 Aid to CIS and CEEC from 1990 to 1995 The end of communism in the former Eastern Bloc suddenly opened up a new set of low and middle income countries for western aid. These countries varied substantially in levels of underdevelopment, strategic importance and commercial potential. In this sense, the fall of the Berlin Wall constitutes almost a unique natural experiment to test how the motivation for aid may be different in the beginning of a partnership compared to the later period. We first estimate a parsimonious aid allocation model using all recipient countries and a CIS-CEEC group interaction, for the years 1990 to 1995. Based on the existing 4 Based on this finding, Frot and Perrotta (2010) use time of entry as an instrument to reevaluate the impact of aid on economic growth. They find a more robust positive effect than is usually found using alternative instruments. 7
- 8. literature (Alesina and Dollar, 2000; Fleck and Kilby, 2010), we assume that aid depends on income per capita, level of democracy, population size, colonial status, commercial and strategic importance and exposure to natural disasters. Some parts of aid flows to the region in the early goings were explicitly strategic, such as military aid for nuclear disarmament. What we are interested in is to analyze whether aid that officially is disbursed for purposes of development and directly or indirectly (through aid fungibility) is used at the discretion of the recipients is also correlated with strategic and commercial motives. We therefore use Country Programmable Aid (CPA) as our dependent variable, an alternative to Official Development Assistance (ODA), to better capture the portions of aid expenditures over which the recipient countries actually do have some authority (Benn et al., 2010). CPA excludes from ODA debt relief, humanitarian aid, in-donor costs and aid from local governments, core funding to international NGOs, aid through secondary agencies, ODA equity investments and aid which is not possible to allocate by country.5 Income per capita, included to capture need, is measured in purchasing power parity terms and in logarithms to reduce the impact of outliers. The level of democ- racy is measured using the polity2 indicator from the Polity IV project, and the log of population size is included to capture the well-known fact that more populous countries tend to get more aid in total but less in per capita terms. Colonial status is a dummy that takes on the value of 1 for all countries previously being western colonies, and disasters is the number of natural, biological or technological disasters that the country experienced during the previous year.6 Finally, to capture commer- cial interests we control for trade volumes between each recipient and the aggregate of donors, measured as total export and import flows over GDP.7 The standard in the aid allocation literature is to use the log of total aid as the dependent variable, and then use a linear estimator such as the OLS, with or without fixed effects. The drawbacks of this approach are that observations receiving no aid are dropped unless some ad hoc alteration is done to the data, and calculations of 5 In this paper we do not analyze differences in behavior across different donors but instead focus on aggregate aid flows. Exploring such differences would be an interesting avenue for future research. It should be emphasized, though, that aid policy of individual donors depends to a large extent on what other donors do. Frot and Santiso (2011) find support for herding behavior among donors even when carefully controlling for external sources of aid correlation, such as natural disasters, debt relief programs etc. On the other hand, recent policies to mitigate aid fractionalization, such as the EC 2007 Code of Conduct, should cause aid flows across donors to be negatively correlated. Analyzing individual donors’ behavior must thus still take the actions of other donors into consideration, suggesting that aid cannot so easily be analyzed donor by donor. 6 Data from EM-DAT: The OFDA/CRED International Disaster Database, www.emdat.be, Uni- versité Catholique de Louvain, Brussels, Belgium. 7 Just looking at exports over GDP, as is done in some papers, leads to similar results. Ideally we would have liked to include also investments from the donors, but such data is very spotty in the early period. 8
- 9. predicted values are complicated by an additive term (the appendix provides a formal comparison of the two estimators). Instead it has been recommended (e.g. (Ai and Norton, 2000; Santos Silva and Tenreyro, 2006, respectively)) to use a Poisson model with the absolute level of aid as the dependent variable and robust standard errors. Nevertheless we replicate Table 1 using the log of aid and the OLS estimator in the appendix. The results are very similar. If anything, our key results come out slightly stronger in the linear model. Column (1) of Table 1 shows the results from the Poisson regression on aid, with a dummy for CEEC and CIS countries included linearly and interacted with all inde- pendent variables. As expected, aid increases with population size, but the marginal effect is significantly larger in the CEEC and CIS countries, with an elasticity not far from 1 (suggesting that aid per capita is almost unaffected by population size in the CEEC and CIS countries, but falls with population size in the other set of recipients). There is no significant difference in the impact of income per capita, which across both groups has a negative correlation with aid inflows. As in earlier studies, former colonies receive more aid while natural disasters have no significant effect (CPA does not include humanitarian aid, so this is not as surprising as it may seem). The effect of trade is insignificant in the control group, but positive and significant in the CIS and CEEC countries, suggesting a more prominent role of commercial interests. The coefficient on the Polity index turns from negative to positive, indicating that aid may have been used more proactively in the CIS and CEEC group to encourage countries that early on reformed their political institutions. Finally, the regional dummy itself is negative and significant suggesting that aid to these countries on average was lower than to other recipients with similar levels of income, democracy, and so on. The results in column (1) highlight average differences across the two groups, but there is of course also a lot of individual variation within groups. In Figure 1 we show for each CIS and CEEC country the difference between actual aid inflows and expected aid inflows had they been like other aid-recipient countries.8 Results are ordered from the largest to the smallest difference. There are a couple of things to note just eyeballing the figure. First, among CIS countries there is a clear distinction between Russia, Ukraine and Belarus and the countries in the Caucasus and Central Asia. Second, countries closer to the core of Western Europe seem to be getting more aid than countries further away. Third, Russia gets substantially more aid than expected. Given these observations, we first rerun the regression in column (1) but only with the sample of CEEC-CIS countries (presented to simplify comparisons in column (2)), but then in column (3) we include two variables that may explain the 8 Expected aid inflows are derived based on the estimated non-interacted coefficients from column (1) and the average value of the independent variables for each country during the 6 years. This is compared to the actual average aid inflows during the same years. 9
- 10. patterns from above; a dummy for nations in possession of nuclear arms at the time of the dissolution of the Soviet Union (Russia, Ukraine, Belarus and Kazakhstan) and a measure of the average distance between the capitals of the recipient and Table 1: Aid allocation in 1990-95 (1) (2) (3) (4) (5) (6) All recipients CEEC-CIS CEEC-CIS No Russia No Germany 3-yrs av. ln_gdpc -.11** -.15 -.61** -.73*** -1.24*** -.98*** (.054) (.27) (.25) (.22) (.19) (.29) CCC_lngdpc -.046 (.27) ln_pop .43*** .86*** .79*** .82*** .76*** .78*** (.045) (.11) (.13) (.17) (.15) (.12) CCC_lnpop .43*** (.12) trade .0012 .026** .034*** .021 .091*** .022** (.0022) (.010) (.012) (.019) (.027) (.011) CCC_trade .025** (.010) polity2 -.015* .067*** -.064* -.059* -.053 -.058 (.0088) (.021) (.034) (.032) (.037) (.041) CCC_polity .082*** (.023) disasters .012 -.027 -.054 -.096 -.059 .055*** (.011) (.025) (.035) (.10) (.056) (.019) CCC_disasters -.040 (.027) colony .33*** (.12) CISCEEC -7.46** (3.26) distcap -.0013*** -.0015*** -.0016*** -.0020*** (.00028) (.00030) (.00030) (.00027) nuclear .28 .076 -1.84*** .12 (.25) (.33) (.34) (.25) Chi2_p-value 1.5e-321 4.2e-93 4.6e-94 4.0e-45 1.2e-69 4.5e-145 Countries 117 24 24 23 24 21 N 627 98 98 94 97 42 Note: Dependent variable is aid flows. Yearly observations for the period 1990-1995, 3-year averages in column (6). Robust standard errors in parentheses. * p < 0.10, ** p < 0.05, *** p < 0.01. 10
- 11. −2000200400600800 Actualminuspredictedaid Serbia Uzbekistan Kazakhstan Azerbaijan Tajikistan Turkmenistan Moldova Estonia Georgia KyrgyzRepublic Romania SlovakRepublic Bulgaria Croatia Armenia CzechRepublic Slovenia Latvia Macedonia,FYR Lithuania Hungary Albania Belarus Ukraine Bosnia−Herzegovina Poland Russia Figure 1: Aid allocation in CEEC and CIS countries as compared to other aid recipients, 1990-1995 its donors.9 In Western Europe, there was a strong desire to help in particular countries in the eastern neighborhood, i.e. Eastern and Central Europe including the Baltic countries, to transition toward democratic and liberal market economies. The motivation behind this was complex, and cannot be attributed to one single reason. An important motivation was security concerns: instability, violent conflicts or outright civil wars could spill over into neighboring countries, at a minimum in the form of mass migration. A friendly geographic cushion against a nuclear armed and unstable Russia was also desired, and for Germany there was the desire to reunite West Germany with East Germany. Part of the motivation was also commercial, though. The potential demand for western goods was particularly high in the region, and low costs and high levels of human capital made it an attractive hub for export processing. Finally, there was probably a sense of responsibility among Western European governments to make right what was perceived as a historical failure dating from the end of the Second World War, the division of Europe into a prosperous and politically open West and a poor and authoritarian East. Another great concern at the end of the Cold War was political chaos in countries with nuclear warheads. Military aid was offered in exchange for dismantling these warheads and measures were taken to reduce the risks that the technology would 9 Using as an alternative the distance to Brussels, interpreted as the center of Europe, did not make any significant difference in any of the tables. 11
- 12. spread to other countries. This might have resulted in more development aid. Geographic distance turns out highly significant and negative suggesting that donors favored countries in proximity to Western Europe. Note also that the negative effect of income now becomes much larger and the coefficient on polity switches sign to become negative, suggesting that the previous results were driven by the fact that geographically close countries also tended to be economically wealthier and more politically open. That aid is negatively correlated with level of democracy once distance is controlled for does not mean, though, that democracy promotion was not part of the motivation. As argued above, part of the reason for focusing on the CEEC was the desire to promote democracy in that region. Also, it is not obvious that a donor that wants to promote democracy should give more aid to those who are relatively more open. Aid targeted to the civil society in more authoritarian regimes may be an alternative strategy that favors less open countries. The nuclear dummy turns out positive as expected, but insignificant. In column (4) we drop Russia from the sample in order to see how excluding the by far largest market affects in particular the role of trade. Not surprisingly the estimated effect is somewhat weakened both economically and statistically, but the coefficient on trade is still positive and significant.10 Another possible reason for the differences across the sets of countries in col- umn (1) may be that different donors carry different weights in the two groups of recipients. It is known from previous studies that some donors are more motivated by commercial interests than others (Stone, 2010). Maybe those donors stand for a larger share of aid in the CIS and CEEC countries than in the other group? To reduce this bias we eliminate one by one donors that have a strongly disproportionate relative size in one or the other recipient group. Germany stands for as much as 61 percent of total aid to the CIS and CEEC countries in this time period, but only 12 percent to the other group. The role of Germany is also special due to the necessity to calm worried neighbors in the face of the political consequences of a reunification between East and West Germany. After eliminating Germany, Japan stands for 30 percent of total aid to the more mature recipients, but only 11 percent to the CEEC and CIS countries. After eliminating Japan, Austria stands for 11 percent of total aid to CIS and CEEC but only 0.4 percent to the other group. After having elim- inated these three donors, the relative weights among the remaining donors across the two groups of recipients look much more similar. In column (5) we show the results using the same model as in column (3) but excluding Germany (this seems to be what matters, results are very similar excluding also Japan and Austria). Two results stand out compared to column (3). First, the nuclear dummy is now nega- tive and significant. This suggests that Germany took on the prime responsibility of 10 Moreover, the coefficient on trade remains significant even after excluding Russia in the other two specifications in column (5) and (6). 12
- 13. providing aid to the strategically important nuclear powers. To the extent that aid was in exchange for nuclear disarmament, this was essentially an international public good providing increased security for all donor countries. The negative coefficient may then reflect free-riding on behalf of the other donors in response to the role taken by Germany11 . Secondly, the size of the coefficient on trade increases by a factor of almost three (compared to column (3)), while that on income doubles (in absolute terms) suggesting that the previous findings were not driven by the inclu- sion of Germany; if anything the opposite.12 Another interpretation is that Germany dominated the by far largest market, Russia, and that other donors instead focused primarily on other countries with great trade potential, and these were not primarily the other nuclear powers. Finally, in column (6) we show the results using averages for the three-year periods 1990-92 and 1993-95. Yearly disbursements fluctuate a lot so maybe our results are driven by a few extreme observations. By looking at this short panel with three- year averages, we take one step towards reducing potential bias from high yearly volatility. The trade-off is that we are now down to only 42 observations. The results largely confirm the previous findings, except for the effect of disasters that now turns positive and significant. This suggests that CPA may still be affected by disasters but this effect kicks in only with a lag, i.e. after the actual disaster, and as part of reconstruction. Overall the picture that emerges from the analysis above is that development aid in the early stages may have been partly driven by ambitions to alleviate poverty: countries with lower per capita income did get more aid, in particular when we control for geographical proximity and nuclear warheads. However, commercial and strategic interests did clearly loom large. A one standard deviation increase in trade volume, taking the conservative estimate from column (3), yields an increase in aid corresponding to a sixth of a standard deviation (16%) of the log of aid in the sample. Doing the same for distance to capital yields a reduction by 64% of the standard deviation, while the effect of the nuclear dummy corresponds to a 15% increase. The corresponding number for log of income is a 25% reduction. In other words, 11 We have also run regressions including a dummy for countries belonging to the former Soviet Union (FSU). This does not change any of the other results, but the effect of the FSU dummy depends on whether Germany is included or not. When Germany is included, the FSU dummy is negative, but only significant when controlling also for the nuclear weapons dummy (which is positive). When Germany is excluded, the FSU is always strongly significant and negative while the nuclear weapons dummy is significant only when the FSU variable is excluded. This further suggests that other donors generally prioritized CEEC, while Germany took responsibility for the nuclear armed former Soviet Union states. The negative coefficient on nuclear in column (4) does thus reflect more a general bias against FSU countries, rather than a bias against nuclear powers. 12 Both Germany and Japan have been found to be motivated by commercial interests in other papers, e.g. Stone (2010). 13
- 14. the trade volume matters less than income but only slightly, and about as much as having nuclear armaments. However, distance has by far the strongest influence on aid allocations to this group of countries in this period. 4 Trends over time in aid to CIS and CEEC In Table 2 below we focus exclusively on CIS and CEEC recipients, and examine trends over time between 1990 and 2007. In column (1) we show the results from a naïve regression in which we constrain the marginal effects to be identical across different time periods. As can be seen, results are dramatically different compared to the previous section. The coefficient on per-capita income is now positive, although statistically insignificant. The effect of the democracy level is positive and significant. On the other hand, geographic distance, trade and the nuclear indicator become insignificant. In columns (2) to (5) we test our argument that the motivation for aid is different in the early going by introducing two dummies for the time periods 1990 to 1995 and 1996 to 2001 respectively. These dummies are introduced separately and interacted with all independent variables. Columns (2) and (3) pool the yearly data, using both cross-country and time-series variation. The only difference between column (2) and (3) is that we exclude Russia in column (3). In column (4) we introduce country fixed effects, and in column (5) we use three-year averages of the data to diminish the effect of random yearly variation. Throughout we use the Poisson model. The results show that the effects of trade, geographic location, democracy, income and disasters have changed substantially over time. Looking at the pooled regressions, the overall effect of trade was positive in the first part of the 1990s, basically zero in the latter part of the 1990s and, when excluding Russia, negative between 2002 and 2007.13 Geographic distance shows a similar pattern, with countries close to the donors (i.e. close to Western Europe) getting more aid in the early 1990s, and less aid after that. More democratic countries receive less aid in the early period and more aid in the subsequent periods using the pooled data. In the fixed effects model countries got more aid as they became more democratic in the early and intermediary periods, while this effect tapers off with time to become insignificant in the last period. Taken together these results suggest that aid over time has been used more to reward countries opening up politically, but we cannot rule out that causality also run in the other direction. That is, countries receiving more aid for whatever reason may also have been more successful in implementing political reforms. In the 2000s the within country standard deviation of democracy is substantially lower than 13 In the fixed effects regressions, trade is insignificant in the early and late periods and negative in the intermediary period. 14
- 15. Table 2: Aid to CIS and CEEC over time (1) (2) (3) (4) (5) Pooled Pooled No Russia Fixed Effects 3-yrs av. ln_gdpc_90-95 -.62** -1.05*** .65* -1.26*** (.28) (.26) (.38) (.39) ln_gdpc_96-01 .091 -.065 .36*** -.27 (.17) (.20) (.12) (.32) ln_gdpc .079 -.044 .23 -.60* .29 (.13) (.13) (.16) (.33) (.27) ln_pop_90-95 1.02*** 1.15*** -.23 .23 (.28) (.27) (.39) (.24) ln_pop_96-01 .089 .073 -.070 .026 (.15) (.16) (.13) (.24) ln_pop .73*** .40*** .68*** -3.75 .54*** (.080) (.100) (.12) (2.46) (.21) trade_90-95 .040*** .057** -.0093 .044** (.014) (.024) (.0096) (.017) trade_96-01 .0094 .020* -.010** .026* (.0065) (.012) (.0042) (.015) trade -.0032 -.0051 -.033*** -.0045 -.022* (.0036) (.0044) (.0095) (.0048) (.013) polity_90-95 -.13*** -.15*** .071* -.13*** (.038) (.035) (.041) (.045) polity_96-01 -.017 -.027 .036** -.012 (.022) (.021) (.016) (.029) polity2 .037** .069*** .089*** .0059 .072*** (.014) (.016) (.016) (.048) (.021) disasters_90-95 -.15*** -.040 -.045 -.15** (.042) (.11) (.034) (.069) disasters_96-01 -.10*** -.072 -.065** -.19*** (.023) (.047) (.028) (.069) disasters .025 .11*** .012 .069** .21*** (.017) (.022) (.036) (.032) (.067) distcap_90-95 -.0016*** -.0019*** -.0023*** (.00031) (.00032) (.00031) distcap_96-01 -.000096 -.00016 -.000089 (.00016) (.00017) (.00022) distcap -.0000049 .00027** .00034*** .00030** (.00014) (.00012) (.00013) (.00015) nuclear_90-95 -.13 .092 .17 (.34) (.41) (.49) nuclear_96-01 .055 .26 .43 (.24) (.28) (.46) nuclear .055 .32 -.18 -.047 (.15) (.21) (.23) (.42) TD_90-95 5.83 14.8*** -13.1*** 16.1*** (4.27) (4.66) (3.86) (6.20) TD_96-01 -3.48 .75 -7.99*** 1.76 (3.17) (3.77) (1.71) (6.08) Chi2_p-value 7.6e-121 0 2.6e-117 0 0 Countries 25 25 24 24 25 N 332 324 311 322 126 Note: Dependent variable is aid flows. Robust standard errors in parentheses. * p < 0.10, ** p < 0.05, *** p < 0.01. 15
- 16. Table 3: Aid to other recipients over time (1) (2) ln_gdpc_90-95 .11** (.054) ln_gdpc_96-01 .058 (.057) ln_gdpc -.094*** -.15*** (.027) (.033) ln_pop_90-95 -.043* (.024) ln_pop_96-01 -.035 (.026) ln_pop .42*** .43*** (.019) (.024) ln_trade_90-95 .0014 (.0018) ln_trade_96-01 .0017 (.0016) trade -.00027 -.00038 (.00041) (.00040) polity_90-95 -.0028 (.010) polity_96-01 .0073 (.011) polity2 -.0056 -.0041 (.0047) (.0074) disasters_90-95 .0079 (.0093) disasters_96-01 -.0043 (.0099) disasters -.000084 .00070 (.0042) (.0040) Chi2_p-value 2.5e-292 0 Countries 102 102 N 1674 1674 Note: Dependent variable is aid flows. Robust standard errors in parentheses. * p < 0.10, ** p < 0.05, *** p < 0.01. 16
- 17. in the previous periods of often rapid political change. This may explain why results turn insignificant in the latter period in column (4), as there is too little within- country variation in this period. Income has a negative correlation with aid in the early period in the pooled data, turning insignificant after that. In the fixed effects regressions, income plays initially no or little role, but becomes negative over time, suggesting that donors started phasing out of recipients that became richer. Finally, disasters are positively correlated with aid since 2002, but negatively before that. The time dummy for 1995 itself is positive in column 3 and negative in column 4. This suggests that a few strategically and commercially important countries like Russia and Poland got a lot of aid early on, which then over time fell substantially, while the majority of smaller aid recipients have seen a moderate increase in aid inflows over time. Overall the results suggest that the motivation for development aid to the CEEC and CIS countries changed over time, and in particular that strategic and commercial interests were of greater relevance early on in the partnership. Comparing pooled and fixed effects regressions suggest that cross-country vari- ation is what mainly drives our results. The difference in results between the two models is to some degree a concern, since pooled regressions may be biased by time invariant and country specific factors correlated with both aid and trade or other independent variables. On the other hand, that results primarilly are driven by variation across countries seems consistent with our argument that aid is used as an initial instrument to open the doors for relationships with countries of particu- lar strategic and commercial importance. Using only the within variation instead tests within already established relationships if aid is used to reward a gradual in- crease in, for instance, trade. This is different from what we argue, and we find it less likely since over time purely commercial instruments become more important in determining trade patterns. At this point it might be argued that the end of the Cold War not only meant the emergence of a new set of recipients, but also a more general shift in aid motivation and allocation. The end of the battle over the ‘hearts and minds’ of developing and emerging countries in the bipolar world order led to an overall reduction in aid levels, but also an opportunity to reallocate aid in order to better target altruistic, commercial or other objectives (Boschini and Olofsgård, 2007). It is therefore possible that the pattern that we see above for CEEC and CIS countries also holds true for other recipients, which would invalidate our argument that motivations depend on the maturity of the relationship. To rule out that the effect observed above is driven by a more general pattern valid for all aid recipients at the time, we rerun the regressions from columns (1) and (2) on all other recipients. As can be seen in Table 3, no such pattern can be found in the other group of aid recipients. 17
- 18. 5 Entry decisions As an additional test of our argument we here apply an alternative approach to gage aid motivation in the early stages: which countries are donors in the most hurry to enter? If aid is primarily motivated by poverty alleviation then donor countries should be in the most hurry to enter the poorest countries (maybe conditional on political institutions and economic policies). On the other hand, if donors were predominantly motivated by commercial interests, then they should be in the most hurry to enter relatively better off countries, and in particular those with which they trade. 05101520 Percent 0 5 10 15 20 Years to entry Figure 2: Distribution of years to entry As dependent variable we construct a measure of the number of years it took before a donor entered into an aid relationship with a recipient country. The Berlin Wall fell on November 9, 1989, whereas the Union of Soviet Socialist Republics (USSR) was formally dissolved on December 25, 1991. All former states of the Soviet Union (except Russia of course) declared their independence earlier than so, but except for Lithuania who declared independence already in 1990, they all declared independence during the year 1991. The opening up towards Western donors was thus taking place around the same time, but with a lag of roughly two years for the republics of the former Soviet Union. Taking 1989 as the benchmark, we therefore define the dependent variable as the year of entry minus 1989, and use a dummy 18
- 19. for former Soviet Union countries as a control in all regressions.14 Figure 2 above shows the distribution of time of entry. The data is over-dispersed, so in accordance with the convention in the literature we use the negative binomial model with robust standard errors. We report the results using the Poisson model with robust standard errors, which are almost identical, in the appendix. Results are presented in Table 4 below. Table 4: Years to entry (1) (2) (3) gdpc_ppp_co -.044** -.046** -.048** (.021) (.021) (.022) pop -.0049 -.0054 .0028 (.011) (.013) (.013) polity2 -.016** -.018** -.022*** (.0075) (.0084) (.0083) FSU .57*** .51*** .58*** (.13) (.15) (.15) FossilFuels -.067 -.086 (.092) (.088) nucweapons .094 .10 (.098) (.097) distcap -.0090 (.0075) trade -.018*** (.0068) Chi2_p-value 4.1e-22 1.3e-20 1.2e-40 Countries 19 19 19 N 369 369 362 Note: Dependent variable is years to entry after 1989 for each donor in each recipient. Robust standard errors in parentheses. * p < 0.10, ** p < 0.05, *** p < 0.01. 14 We exclude the countries of the former Yugoslavia, the Czech Republic and the Slovak Republic from the set of recipients since they did not come into existence until later. From the set of donor countries we exclude those who did not emerge as donors until after 1989, including some CEEC countries such as Poland and the Czech Republic. 19
- 20. In column (1) we test a parsimonious model with just income, level of democracy, population size and a dummy taking on the value of 1 if the country was once part of the Soviet Union. The results suggest that the OECD/DAC donors entered into partnership earlier with countries that were relatively richer and politically more open.15 The coefficient value on the FSU dummy suggests that entry into countries of the former Soviet Union is expected to be delayed by 1.77 years, holding the other variables constant. In column (2) we add a dummy for countries with nuclear arms and another dummy for countries rich in oil, gas or coal (Azerbaijan, Kazakhstan, Poland, Romania, Russia, Turkmenistan, Ukraine and Uzbekistan). None of these variables comes out significant. In column (3) we also add trade and distance between capitals, two variables that vary not only across recipients but also at the recipient- donor pair level. We measure trade as the total volume of trade between 1990 and 1995 to better capture commercial potential. We find distance to capital to be insignificant, while trade potential spurred earlier entry. It should be noted, though, that the FSU dummy probably captures part of the effect of distance. The results for entry decisions largely confirm those for aid allocation. Donors have entered earlier into countries with greater commercial potential as captured by income levels and trade flows. On the other hand, donors also entered quicker into countries with more democratic institutions, somewhat contradicting the effect found using the aid allocation data. One interpretation may be that donors entered earlier into more democratic countries to support a swift and clean break with the old autocratic socialist system, not primarily through offering more aid but by quickly offering political support for the democratic transition. 6 Sensitivity analysis To check further for the robustness of our results, we introduce some additional tests in this section. In Table 5, we first replace Country Programmable Aid (CPA) with Official Development Assistance (ODA). Recall that we used CPA in our base specification because it is the narrowest definition of development aid, so we expect a stronger focus on strategic and commercial interests when looking at the ODA flows instead. This is indeed what we find. In column (1) we replicate column (3) from Table 1, using only the early time period. The effect of trade and geographic 15 We use GDP per capita at year of entry. This could bias the effect of income since almost all of these countries suffered from a substantial output drop during the first half of the 1990s. The negative coefficient can then be due to the fact that income had shrunk more at stages of later entry, rather than because donors favored early entry into higher income countries. To test this we have also run all regressions using GDP per capita in 1992 (earliest year for which we have data for all our countries) irrespective of time of entry. The results (available upon request) were very similar and did not change any substantial findings. 20
- 21. Table 5: Sensitivity analysis - ODA (1) (2) ln_gdpc_90-95 -1.18*** (.29) ln_gdpc_96-01 -.015 (.24) ln_gdpc -1.06*** .013 (.20) (.20) ln_pop_90-95 1.51*** (.29) ln_pop_96-01 .12 (.17) ln_pop .94*** .59*** (.13) (.13) trade_90-95 .079*** (.015) trade_96-01 .011 (.0097) trade .90*** -.0038 (.12) (.0075) polity_90-95 -.097*** (.029) polity_96-01 -.034* (.020) polity2 -.025 .071*** (.025) (.015) disasters_90-95 -.26*** (.064) disasters_96-01 -.048* (.026) disasters -.17*** .057** (.045) (.024) distcap_90-95 -.0017*** (.00023) distcap_96-01 -.00022 (.00016) distcap -.0013*** .00025** (.00020) (.00011) nuclear_90-95 -.032 (.38) nuclear_96-01 .015 (.32) nuclear -.18 -.15 (.27) (.26) TD_90-95 11.2** (4.39) TD_96-01 -.85 (4.26) Chi2_p-value 8.1e-114 1.5e-318 Countries 24 25 N 99 327 Note: Dependent variable is aid flows, using ODA rather than CPA. Robust standard errors in parentheses. * p < 0.10, ** p < 0.05, *** p < 0.01. 21
- 22. distance are measured with even more precision, and in particular the coefficient for trade increases substantially in size.16 In column (2) we look at data from 1990 to 2007, using interactions for the three different time periods. The results largely confirm those from using CPA, that is, the importance of trade and distance in the early period is not matched as the relationships mature. The positive correlation between trade and aid is typically interpreted in the literature as an indication that aid is used to push current donor country’s exports or secure imports of vital interest (energy or rare earth metals for instance). We argue that this commercial motive may be particularly important in the early stage of the partnership, not only to promote current trade, but rather to gain a competitive advantage that can help promote trade also in the future. If this is correct, then we should expect also future trade flows to be correlated with aid in the first years of the partnership. To the extent that trade in those early years only reflects a part of the potential for trade in the future, the estimated effect of future trade may be even stronger. In Table 6 we re-run column (3) from Table 1 replacing current trade with trade in five years time. This makes almost no difference, which is not very surprising given that these measures are correlated almost at a level of 0.95. Statistical significance is higher, while the estimated coefficient is slightly lower, but not significantly different. Introducing both current trade and trade five years later makes current trade insignificant, while trade five years later retains statistical significance. The little variation there is between the two measures indicates thus that trade potential may be more important than current trade. Another indication of the role of trade in the early period comes from looking at bilateral rather than aggregated data. If donors use aid to increase their chances of trade deals at the expense of other potential trading partners, then one would expect the correlation at the dyadic level to be even stronger.17 In Table 7 we use dyadic data from 1990 to 1995 and once again replicate column (3) from Table 1 to test if this is true. Trade comes out highly significant, with the size of the coefficient almost eight times as large as in Table 1. This suggests that donors are primarily concerned with their own trading partners, not just countries that trade much in general. In principle, donors can support a viable business and investment environment for development purposes, and this may be more effective in a setting in which the geographical potential for trade and FDI is higher to start with. However, then they would have no reason to focus particularly on their own trading partners. 16 One standard deviation increase in trade volume is associated with an increase by 36% of a standard deviation in ODA, more than double what we observed for CPA. The effect of income is also almost doubled, from 25% with CPA to 46% with ODA, while the effect of distance goes from 64% to 72%. 17 If the trade potential of different recipients differs across donors, then one would expect the aggregated data to show a smaller effect than the dyadic data. 22
- 23. Table 6: Sensitivity analysis - Trade potential (1) (2) ln_gdpc -.67*** -.66*** (.23) (.24) ln_pop .67*** .63*** (.13) (.13) f5_trade .027*** .045** (.0079) (.020) trade -.028 (.029) polity2 -.068** -.071** (.032) (.032) disasters -.018 .022 (.033) (.052) distcap -.0013*** -.0013*** (.00026) (.00025) nuclear .45* .52** (.23) (.22) Chi2_p-value 2.5e-92 2.2e-88 Countries 24 24 N 98 98 Note: Dependent variable is aid flows. Robust standard errors in paren- theses. * p < 0.10, ** p < 0.05, *** p < 0.01. 23
- 24. Instead, the results suggest that donors have used aid to gain benefits for domestic companies or the domestic economy more generally. Aid for the purpose of making sure that trade ties are established with donor A instead of donor B do not serve the purpose of developing the recipient country’s private sector. In the worst case, aid money could tilt the deal in favor of inferior commercial contracts if recipient country governments impose undue pressure on private companies. In column (2) we again replace current trade with trade five years later. The effect is similar but slightly smaller The coefficients are almost identical when controlling, in column (3), for two additional factors that might also be correlated with trade and aid: (i) a dummy indicating whether, for each pair, the two countries were, at some point in time, part of the same country, and (ii) for each pair, the number of migrants from one country that in 1990 were present in the other country. The latter is not significant, while the former has a positive effect on aid flows. Perhaps the most consistent result in our analysis is the correlation between aid and trade. We have been arguing that trade potential motivates aid flows because aid can function as a sweetener for trade deals. However, the causal link between aid and trade may well be bidirectional: more generous aid disbursements can gener- ate foreign connections, provide technological and management know-how, and help support a business environment more conducive to export-oriented industries in gen- eral. To deal with this potential endogeneity bias we follow Frankel and Romer (1999) and specify a gravity model for bilateral trade using both countries’ land area, donor country population, a dummy for shared borders, and the latter’s interaction with the others as external instruments.18 As in other studies using the gravity model, the predicted trade share in our sample is highly correlated with actual trade share, suggesting that it is a strong instrument. Whether it is a valid instrument depends on the exclusion restrictions. In column (1) of Table 8 we display an OLS regression, specified as column (3) of Table 1, without instrumentation (for reference). In col- umn (2) we instrument with predicted trade from the gravity model. As shown in the table, the results do not change much; if anything the coefficient for trade becomes somewhat larger with instrumentation.19 It could be the case, though, that a shared 18 Recipient country population is included as a regressor already in the original specification, and is thus not an external instrument. Table A.6 in the Appendix reports the first stage. 19 The table also reports two statistics that inform about instrument strength. The first is the p- value of the Angrist and Pischke (2009) test of excluded instruments. The second is the Kleibergen and Paap (2006) Wald statistic. Both are tests of instrument weakness. The null hypothesis of the Angrist and Pischke test is rejected at 5% level, and the Kleibergen and Paap Wald statistic is quite high. Although critical values only exist for the Cragg-Donald Wald statistic, which is not robust to heteroskedasticity, the 25% maximal IV size value is 5.53. In the limit of weak instruments, there would be no improvement of IV over OLS and the bias would be 100% of OLS; in the other limit, the bias would be zero. The test says, in our case, that we can strongly reject a bias larger than 25%. 24
- 25. Table 7: Sensitivity analysis - Dyadic data (1) (2) (3) ln_gdpc -.27 -.28 -.27 (.18) (.20) (.22) ln_pop .75*** .61*** .59*** (.14) (.16) (.18) trade .28*** (.030) f5_trade .20*** .17*** (.020) (.033) polity2 .043* .030 .030 (.025) (.027) (.027) disasters -.065 .019 .029 (.054) (.056) (.061) distance -.000098*** -.00011*** -.00010*** (.000035) (.000037) (.000035) nuclear .41 .71* .79* (.39) (.42) (.44) samecountry 1.26* (.72) migrant1990 .00043 (.00046) Chi2_p-value 1.5e-89 3.1e-63 2.9e-67 Recipients 24 24 24 Donors 20 20 20 N 2124 2124 2124 Note: Dependent variable is aid flows at the partnership level. Robust standard errors in parentheses. * p < 0.10, ** p < 0.05, *** p < 0.01. 25
- 26. Table 8: Sensitivity analysis - IV for trade (1) (2) (3) OLS OLS IV OLS IV ln_gdpc .18** .17* .19* (.079) (.089) (.10) ln_pop .28*** .29*** .29*** (.048) (.051) (.051) trade .48*** .62*** .46 (.051) (.12) (.36) polity2 .0054 .0068 .0069 (.0090) (.0098) (.0099) disasters -.027 -.031 -.0090 (.028) (.035) (.060) distance -.000031*** -.000031*** -.000033*** (.0000082) (.0000089) (.000011) nuclear -.41*** -.43*** -.42*** (.13) (.14) (.13) samecountry .80 (.51) migrant1990 .00093 (.0017) R2 .14 .14 .16 AP test (p-val) 1.1e-15 .041 KP F stat 63.9 4.14 Countries 24 23 23 N 2124 1892 1892 Note: Dependent variable is aid flows at the partnership level. AP: Angrist-Pischke. KP: Kleibergen-Paap. Robust standard errors in paren- theses. * p < 0.10, ** p < 0.05, *** p < 0.01. 26
- 27. border makes it more likely that two countries have been part of the same country historically, and that migration flows are larger for neighboring countries. In other words, the exclusion restrictions may not hold, trade may not be the only channel through which shared borders affect aid flows. We therefore include also migrants and samecountry as control variables in column (3). None of these variables turn up significant in the instrumented model but their inclusion inflates the standard errors on the estimated effect of trade, though the coefficient is still positive and of similar size to the OLS coefficient. Moreover, the Cragg-Donald Wald statistic is much lower, suggesting the instrumentation is indeed weaker in column (3). This suggests that part of the effect of shared borders may indeed go through these other channels. 7 Aid Practices The evidence so far suggests that donors put a disproportionate weight on commercial and strategic factors when new countries emerged as potential aid partners after the end of the Cold War. As argued above, this has implications for aid effectiveness as it may skew the allocation of limited budgets away from where aid is most likely to favorably impact development. This may not be the only way, though, through which aid effectiveness suffers. The commitments to good aid practices made in the Paris Declaration (and confirmed in the following High Level meetings in Accra and Busan) may also suffer. The measures now used to evaluate progress with the Paris Declaration (e.g. Knack et al., 2010 and OECD, forth. b) are generally not available for the 1990s, so we are quite restricted in what we can do. But below follows some indicative evidence, comparing aid practices in the CEEC and CIS countries in the 1990s to practices in other recipients during the same time period. As part of the commitment to harmonization, donors have pledged to reduce aid fragmentation in the Paris Declaration, the Accra Agenda and the European Council 2007 Code of Conduct. We show below a graph of how the number of recipient countries for the average DAC member has changed over time. As can be seen, fragmentation increased slowly from 1976 to 1985, stayed constant until 1990, and then steadily increased up until 1995. The end of the Cold War is thus associated with a substantial increase in donors aid portfolios as new recipients emerged in the CEEC and CIS while very few established relationships were terminated. Fragmentation can also be measured from the point of view of the recipient countries. Figure 4 below shows how the number of donors that each of the new countries established partnerships with increased rapidly to catch up to the standards of previous aid recipients within only a few years. By 1999 all of the major donors had entered the 27 new countries. Looking at the average number of donors across sectors, Figure 5 reveals a similar pattern. 27
- 28. 020406080 Recipientsperdonor 1960 1961 1962 1963 1964 1965 1966 1967 1968 1969 1970 1971 1972 1973 1974 1975 1976 1977 1978 1979 1980 1981 1982 1983 1984 1985 1986 1987 1988 1989 1990 1991 1992 1993 1994 1995 1996 1997 1998 1999 2000 2001 2002 2003 2004 2005 2006 2007 Figure 3: Average number of recipients per DAC donor over time 05101520 Donorsperrecipient 1990 1991 1992 1993 1994 1995 1996 1997 1998 1999 0 1 0 1 0 1 0 1 0 1 0 1 0 1 0 1 0 1 0 1 Figure 4: Average number of donors per recipient in CEEC-CIS countries and other recipients Another indicator of fragmentation is what the OECD (OECD, 2009) refers to as non-significant relationships, something that donors are encouraged to reduce. The 28
- 29. 0246 Donorspersector 1990 1991 1992 1993 1994 1995 1996 1997 1998 1999 0 1 0 1 0 1 0 1 0 1 0 1 0 1 0 1 0 1 0 1 Figure 5: Average number of donors per sector in CEEC-CIS countries and other recipients characterization of a partnership as non-significant is based on two evaluations: i) how concentrated the donor is in this recipient, i.e. how big a share of its aid goes to this recipient in relation to the donor’s contribution to total global aid; and ii) how important the donor is for the recipient, in particular whether it belongs to the set of largest donors jointly contributing 90% of the country’s aid receipt. Partnerships that fail one or both of these criteria are judged as non-significant. Figure 6 shows that this type of partnerships were far more common in this region than in the rest of the world during the first half of the 90s. This can be interpreted as a result of the strong incentives among donors to be quickly part of the action when new regimes came to power, perhaps before considering the possibility and opportunity of a more substantial long-run commitment. 29
- 30. 10 15 20 25 30 35 40 45 ComputedbyWolframAlpha Figure6:Non-significantaidpartnerships,1990-1995 30
- 31. Another priority in the Paris Declaration is to make aid less volatile and more predictable. Among other things, high volatility complicates public financing, shifts resources from investment to consumption and exacerbate business cycles (Desai et al., 2010), and has therefore been a major concern for many years (see Bulíř and Hamann, 2008). Figure 7 shows that, indeed, aid seems to be more volatile in CEEC and CIS countries compared with other recipients over the period 1990-1995, and also within the same group of recipients volatility is higher in this period compared with the following 5 years, although these differences are not statistically significant.20 1020304050 volatility Other recipients CEEC−CIS 95% confidence intervals Different recipient groups, 1990−1995 1020304050 volatility 1990−1995 1996−2001 95% confidence intervals CEEC−CIS, over time Figure 7: Aid volatility across recipient groups and over time In Table 9 we look at some other measures of aid effectiveness related to the objectives of the Paris Declaration. By running simple correlations with a CEEC- CIS dummy we capture average differences between this group and other recipients. Column (1) offers another indication of the urgency to establish some kind of re- lationship before a fully-fledged engagement in the partnership could be evaluated: the fraction of aid disbursed relative to that committed is significantly lower in the CEEC-CIS countries. Such a lack of long-term planning may be a factor contribut- ing to aid volatility. In column (2) we look at the proportion of aid that is tied, something we may expect to go up as commercial interests become more important for aid decisions. The fraction of aid that was tied was also significantly higher in CEEC-CIS compared to other recipients at the time. The average size of project, 20 Volatility could be high simply because aid flows to the region are constantly increasing from zero in this period after entry. But this does not seem to be the case here. 31
- 32. around 3.3 million USD as shown in column (3) , is slightly smaller in CEEC-CIS, but not-significantly so (smaller projects imply more fragmented aid). Finally col- umn (4) compares the share disbursed through program-based approaches. Program aid refers to the disbursement of funds broadly earmarked to a sector and managed by the recipient country, as opposed to the direct implementation of specific projects managed by the donor. Program aid and budget support contribute more directly to the recipient government’s budget, and are therefore in line with the focus on ownership. It is also argued that this approach can contribute to reduce aid frag- mentation. According to the available data, a rather small sub-sample, around 20% of aid during this period was disbursed according to these modalities, and the share is not significantly different in CEEC and CIS recipients.21 Table 9: Measures of aid quality, differences in means (1) (2) (3) (4) Fraction disbursed Fraction tied Mean project Program-based CEEC-CIS -.18*** .052*** -.47 .054 (.020) (.0088) (.38) (.033) Constant .49*** .62*** 3.31*** .19*** (.013) (.0057) (.21) (.0077) Donors 26 26 26 17 Recipients 176 176 177 165 Observations 15751 16076 17132 4597 Note: Yearly observations for the period 1990-1999. All regressions include donor fixed effects. Standard errors clustered at the recipient level in parentheses. * p < 0.10, ** p < 0.05, *** p < 0.01. 8 Conclusions Looking at the countries in Central and Eastern Europe and the Commonwealth of Independent States we find that donors’ commitments to aid effectiveness are partic- ularly challenged when new bilateral partnerships need to be established. Strategic and commercial interests can always influence the allocation and practices of aid disbursements, but we find that this was particularly true during the first part of the 1990’s.22 We argue that this may be because strategic influence and commer- 21 20% is actually quite a big share even for today standards, but since these data are based on (voluntary) reports from donor administrations, the smaller the sample, the stronger the concern about selection. It might well be that only the "best" donors take the trouble to report, and they are the ones that also have better quality of aid in other respects. 22 That commercial and strategic motives influence aid allocation is not very surprising, but what is new to the literature is that we find that the role of commercial and strategic interests weakens 32
- 33. cial contracts are typically won in competition with others, and there is often a first mover advantage in establishing such relationships with a new regime or government. Promoting development, on the other hand, is a public good, suffering from the usual problems of underprovision and free-riding. Skewed priorities and time pressure also influenced aid practices negatively. The rush to establish new partnerships lead to a surge in aid fractionalization, both from the donor’s and the recipient’s perspective, and high levels of aid volatility and unpredictability. A larger fraction of aid was also tied to procurement from the donor country, as compared to other recipient countries. The case of foreign aid during the Eastern transition is important in itself, but we also think it provides some crucial lessons for donor countries looking ahead.23 The current events in the Middle East and North Africa (MENA) region are sometimes pitched as the potential for a new economic and political transition (Meyersson et al., 2011). A new political leadership has emerged in countries such as Tunisia, Libya, Egypt and Yemen, and more may come. With the new political leadership also comes a gradual change in economic ownership and control, and the region is opening up for more foreign investments and trade as the social contract in the region becomes less dependent on the state, and more on the private sector. Strategic concerns related to terrorism, migration and access to oil and gas also guarantee that governments in western countries will have an interest in the transformation taking place. Based on the experience of Eastern transition, there is a great risk that aid will be "captured" for purposes other than promoting development and alleviating poverty when many, sometimes conflicting, foreign policy objectives are at stake. The practices for aid effectiveness agreed upon in the Paris Declaration are also likely to suffer, leading to an increase in the fractionalization, volatility and unpredictability of aid. Respect for ownership and alignment to recipient country objectives may also come under over time. It is thus primarily in the beginning of a partnership with a new regime, when future commercial and political orientation is largely determined, that aid gets to serve as a carrot to sweeten the deal. It is also worthwhile to note that we get these results using the most restrictive definition of development aid, country programmable aid. This definition excludes not only military aid, but also debt relief, humanitarian aid, in-donor costs and other components that are outside the control of the recipient government. 23 The fall of the Berlin Wall and the process of transition that followed was indeed a unique event. It is therefore reasonable to question to what extent the experience of these countries has any bearing for other countries going through regime change. It is always difficult to offer definitive answers to questions of external validity, and replication studies looking at other cases in other parts of the world would be a great future research agenda. However, the group of countries in our sample vary substantially across dimensions of poverty, commercial potential, historical ties with donor countries and strategic importance, variables typically found to be relevant for aid allocation. We have also shown that the results hold up when excluding Russia (the most obvious ‘special case’ among the recipients) and donors being either more or less involved in these countries compared to other aid recipients, such as Germany, Austria and Japan. 33
- 34. question, in particular if new governments move in an ideological direction alien to western donors. Of course we can only speculate at this time, but if the experience of the CEEC and CIS countries repeats itself, then we should expect that aid initially flows predominantly to countries with a relative commercial potential, like Libya and Egypt. Yemen, despite being the poorest country, should expect to see less aid flows, except for the strategic interest in containing the local affiliates of Al Qaeda, whereas Tunisia, despite having the strongest political and economic institutions, should have the hardest time attracting aid flows. Hopefully in a few years time, a follow up study on the MENA region can be used to test the generality of our current findings. In the meanwhile, however, being aware of these tendencies might help donor countries to actively resist them, to the extent that they produce undesirable outcomes. References Ai, C. and E. Norton (2000). Standard errors for the retransformation problem with heteroscedasticity. Journal of Health Economics 19(5), 697–718. Alesina, A. and D. Dollar (2000, March). Who gives foreign aid to whom and why? Journal of Economic Growth 5(1), 33–63. Angrist, J. D. and J.-S. Pischke (2009). Mostly Harmless Econometrics: An Em- piricist’s Companion. Princeton: Princeton University Press. Benn, J., A. Rogerson, and S. Steenson (2010). Getting closer to the core– measuring country programmable aid. Technical Report 1. Berthélemy, J. and A. Tichit (2004). Bilateral donors’ aid allocation decisions - a three-dimensional panel analysis. International Review of Economics & Finance 13(3), 253–274. Bigsten, A. L., J. P. P. and S. Tengstam (2011). The aid effectiveness agenda: The benefits of going ahead. Technical report, European Commission. Birdsall, N. and H. Kharas (2010). Quality of Official Development Assistance Assessment. Center for Global Development. Boschini, A. and A. Olofsgård (2007). Foreign aid: An instrument for fighting communism? Journal of Development Studies 43(4), 622–648. Bulíř, A. and A. Hamann (2008). Volatility of development aid: From the frying pan into the fire? World Development 36(10), 2048–2066. Burnside, C. and D. Dollar (2000). Aid, policies, and growth. The American Eco- nomic Review 90(4), 847–868. Carothers, T. (2006). The backlash against democracy promotion. Foreign Affairs, 55–68. 34
- 35. Collier, P. and D. Dollar (2002). Aid allocation and poverty reduction. European Economic Review 46(8), 1475–1500. Desai, R., H. Kharas, et al. (2010). The determinants of aid volatility. Economy & Development Working Paper 42. Dreher, A., J. Sturm, and J. Vreeland (2009). Development aid and international politics: Does membership on the UN Security Council influence World Bank decisions? Journal of Development Economics 88(1), 1–18. Easterly, W. and C. Williamson (2011). Rhetoric versus reality: The best and worst of aid agency practices. World Development Issue 11 39, 1930Ű1949. Fleck, R. and C. Kilby (2010). Changing aid regimes? US foreign aid from the Cold War to the War on Terror. Journal of Development Economics 91(2), 185–197. Frankel, J. and D. Romer (1999). Does trade cause growth? American Economic Review 89, 379–399. Frot, E. (2009). Early vs. late in aid partnerships and implications for tackling aid fragmentation. SITE Working Paper Series, No. 1. Frot, E. and M. Perrotta (2010). Aid Effectiveness: New Instrument, New Results? SITE Working Paper Series, No. 11. Frot, E. and J. Santiso (2011). Herding in aid allocation. Kyklos 64(1), 54–74. Hess, P. (1989). Force ratios, arms imports and foreign aid receipts in the devel- oping nations. Journal of Peace Research 26(4), 399–412. Kharas, H. e. a. (2011). From aid to global development cooperation. In From Aid to Global Development Cooperation. Brookings Blum Roundtable. Kleibergen, F. and R. Paap (2006, May). Generalized reduced rank tests using the singular value decomposition. Journal of Econometrics 133(1), 97–126. Knack, S. and N. Eubank (2009). Aid and trust in country systems. World Bank Policy Research Working Paper 5005. Knack, S., F. Rogers, and N. Eubank (2010). Aid quality and donor rankings. World Bank Policy Research Working Paper No. 5290. Kuziemko, I. and E. Werker (2006). How much is a seat on the Security Council worth? Foreign aid and bribery at the United Nations. Journal of Political Economy 114(5), 905–930. Maizels, A. and M. Nissanke (1984). Motivations for aid to developing countries. World Development 12(9), 879–900. 35
- 36. McKinlay, R. and R. Little (1977). A foreign policy model of US bilateral aid allocation. World Politics 30(01), 58–86. Meyersson, E., A. Olofsgård, and J. Roine (2011). Transition All Over? Lessons from the Experience of the Post-Communist Countries for the Countries of the Arab Spring. In IEMed (Ed.), PapersIEMed. Neumayer, E. (2003). The pattern of aid giving: the impact of good governance on development assistance, Volume 34. Psychology Press. OECD (2009). 2009 OECD Report on Division of Labour. OECD (forth. b). Aid Orphans: a Collective Responsibility? Improved Identi- fication and Monitoring of Under-aided Countries. Technical report, OECD, Paris. OECD (forth. c). Has donors’ behaviour changed after the paris declaration? in- sights from dac peer reviews. Technical report, OECD, Paris. Parks, T. (2012, May). How Can International Assistance to Burma Avoid Mis- takes of the Past? In Asia, The Asia Fundation. Santos Silva, J. and S. Tenreyro (2006). The log of gravity. The Review of Eco- nomics and Statistics 88(4), 641–658. Schraeder, P., S. Hook, and B. Taylor (1998). Clarifying the foreign aid puzzle: A comparison of American, Japanese, French, and Swedish aid flows. World Politics 50(02), 294–323. Stone, R. (2010). Buying Influence: Development Aid between the Cold War and the War on Terror. Unpublished Working Paper. Svensson, J. (1999). Aid, growth and democracy. Economics & Politics 11(3), 275–297. Younas, J. (2008). Motivation for bilateral aid allocation: Altruism or trade ben- efits. European Journal of Political Economy 24(3), 661–674. 9 Appendix 9.1 Data appendix ln_pop. Natural log of population, thousands. Source: World Development Indica- tors. ln_gdpc. Natural log of GDP per capita, constant 2000 USD. Source: World Devel- opment Indicators. 36
- 37. trade. Sum of imports and exports as a share of recipient’s GDP. Source: Barbi- eri, Katherine and Omar Keshk. 2012. Correlates of War Project Trade Data Set Codebook, Version 3.0. Online: http://correlatesofwar.org. polity2. Polity score, -10 to 10. Source: PolityIV Project. disasters. Number of any kind of events classified as natural or technological disas- ters, lagged one period. Source: EM-DAT. colony. Dummy variable equal to 1 if the recipient was a former colony, alt. if the pair has ever had a colonial link (in dyadic data). Source: CEPII. Online: ttp://www.cepii.fr/anglaisgrap/bdd/distances.htm distance. Distance in 100,000 of kilometers between the two main cities of the two countries (in dyadic data). Source: CEPII. distcap. Average distance in 100,000 of kilometers between each recipient and the donors’ capitals. Source: CEPII. nuclear. Indicator for the presence of nuclear armaments. Source: U.S. State De- partment. td95. Indicator for the period 1990-1995. td95. Indicator for the period 1996-2001. FossilFuels. Indicator for the presence of natural gas, coal or oil resources. Source: BP Statistical Review of World Energy, Historical data. FSU. Indicator for former Soviet Union members. samecountry. Dummy variable equal to 1 if the pair was part of the same country in the past (in dyadic data). Source: CEPII. migrant1990. Stock of international migrants from recipient country living in the donor country in 1990 (in dyadic data). Source: World Bank. 9.2 Summary statistics Table A.1: Summary statistics based on data from CIS and CEEC from 1990 to 2007 Variable Mean Std. Dev. N aid 139.648 219.626 411 ln_pop 15.785 1.059 431 ln_gdpc 8.436 0.789 421 distcap 4375.786 911.757 429 disasters 1.195 2.248 401 polity2 3.462 6.442 392 trade 8.596 15.831 395 37
- 38. Table A.2: Correlation table based on data from CIS and CEEC from 1990 to 2007 Variables ln_pop ln_gdpc distcap disasters polity2 trade ln_pop 1.000 ln_gdpc 0.034 1.000 distcap 0.089 -0.726 1.000 disasters 0.516 0.072 0.010 1.000 polity2 -0.135 0.554 -0.757 0.079 1.000 trade 0.566 0.517 -0.291 0.576 0.321 1.000 Table A.3: Summary statistics based on dyadic data from 1990 to 2007 Variable Mean Std. Dev. N cpa_net_cu 6.140 39.062 9344 ln_pop 15.784 1.057 9344 ln_gdpc 8.439 0.789 9133 distcap 4736.179 4106.804 5799 disasters 1.201 2.251 8696 polity2 3.456 6.445 8503 trade 0.363 1.78 9344 samecountry 0.011 0.102 8280 migrant1990 15396.911 102878.743 8280 Table A.4: Correlation table based on dyadic data from 1990 to 2007 Variables ln_pop ln_gdpc distcap disasters polity2 trade samecountry migrants1990 ln_pop 1.000 ln_gdpc 0.032 1.000 distcap 0.041 -0.148 1.000 disasters 0.517 0.072 0.017 1.000 polity2 -0.136 0.554 -0.152 0.080 1.000 trade 0.221 0.180 -0.131 0.237 0.116 1.000 samecountry -0.030 0.101 -0.086 -0.016 0.065 0.073 1.000 migrants1990 0.151 0.088 -0.041 0.081 0.086 0.595 0.019 1.000 38
- 39. 9.3 The Poisson and OLS estimator As mentioned in section 3, we use a Poisson model as main specification. In a general model of aid allocation, the conditional mean can then be written as E[ln(aidit)|xit] = b0 + xitb (1) where subscripts i and t signify country and year, x signify a vector of explanatory variables and b a vector of corresponding parameters. This approach has been crit- icized in other contexts, though, in particular in the context of health expenditures and trade (Ai and Norton, 2000; Santos Silva and Tenreyro, 2006, respectively). Firstly, it is not possible, without questionable alterations, to include observations in which the dependent variable is 0. Secondly, calculating predicted values of the dependent variable requires a transformation since E[aidit|xit] = eb0+xitb ∗ E[e it ] (2) where E[e it ] = e σ2 2 (3) when it ∼ N(0, σ2 ). The recommended alternative is to use the Poisson model for the level of aid, with the Huber/White/Sandwich linearized estimator of variance (robust standard errors).24 The Poisson model, most commonly applied to count data, assumes that E[aidit|xit] = eb0+xitb . (4) This solves the aforementioned concerns, the only remaining difference being the distinction between lnE(aidit|xit) and E[ln(aidit)|xit]. A very restrictive assumption with the conventional Poisson model is that it assumes that E(yit) = V ar(yit), which only holds true in quite special cases. However, the Huber/White/Sandwich estimator for the variance-covariance matrix does not need this assumption, it does not even require that V ar(yit) be constant across i (homoscedasticity). Table A.5 below replicates the same models as Table 1 estimated using OLS. 24 An alternative to the use of robust errors is to cluster the errors at the recipient level. This is generally not recommended when the number of clusters falls below 35, since clustered standard errors are only valid asymptotically, and the asymptotic properties are based on the number of clusters, not the number of observations (as is the case with robust standard errors). Since we have fewer than 35 clusters for most of our regressions, we choose to use robust standard errors throughout. 39
- 40. Table A.5: Aid allocation in 1990-95, OLS (1) (2) (3) (4) (5) (6) All recipients CEEC-CIS CEEC-CIS No Russia No Germany 3-yrs av. ln_gdpc -31.6** -50.4** -122.2*** -96.8*** -66.3*** -98.0** (13.2) (21.5) (28.1) (23.2) (21.4) (42.0) CCC_lngdpc -18.8 (24.8) ln_pop 76.6*** 72.0*** 39.9 73.3** 54.6** 31.6 (15.8) (23.0) (30.1) (28.6) (21.9) (34.9) CCC_lnpop -4.68 (27.5) trade 1.18 20.6*** 24.0*** 11.6*** 10.8*** 12.9** (1.23) (4.34) (4.87) (3.57) (4.04) (4.91) CCC_trade 19.4*** (4.42) polity2 -6.32*** 4.09** -4.37 -3.93 -3.18 -5.48 (2.12) (1.91) (3.76) (3.43) (2.93) (4.32) CCC_polity 10.4*** (2.83) disasters 41.1*** 40.4*** 27.9** -1.46 -16.4* 68.5*** (5.76) (12.8) (12.6) (11.8) (9.52) (23.7) CCC_disa CISCEEC 142.5 (521.9) colony 70.1** (35.3) distcap -.094*** -.10*** -.073*** -.13*** (.033) (.030) (.027) (.039) nuclear 151.7** 47.2 -92.4** 87.9 (62.2) (51.5) (40.2) (74.4) CCC_disasters -.72 (13.8) Chi2_p-value 5.2e-75 4.8e-16 5.3e-15 5.8e-09 .00017 .00000019 Countries 117 24 24 23 24 21 N 627 98 98 94 97 42 Note: Replication of Table 1 using the OLS estimator and log of aid as dependent variable. Robust standard errors in parentheses. * p < 0.10, ** p < 0.05, *** p < 0.01. 9.4 Additional tables 40
- 41. Table A.6: First stage (1) trade ln_pop -.0074 (.026) ln_gdpc .20*** (.023) polity2 -.0054*** (.0020) disasters .13*** (.038) distance -.000021*** (.0000027) nuclear -.17*** (.041) trade_iv .53*** (.066) _cons -1.39*** (.39) N 1892 R2 .47 Note: First stage of Table 8 , column (2). Dependent variable is trade. The external instru- ment trade_iv is obtained from a gravity model. Robust standard errors in parentheses. * p < 0.10, ** p < 0.05, *** p < 0.01. 41
- 42. Table A.7: Years to entry, Poisson (1) (2) (3) DepVar gdpc_ppp_co -.042* -.045** -.047** (.023) (.023) (.023) polity2 -.016** -.018** -.022** (.0078) (.0088) (.0087) pop -.0048 -.0065 .0015 (.012) (.013) (.014) FSU .58*** .52*** .58*** (.14) (.15) (.15) FossilFuels -.053 -.070 (.090) (.087) nucweapons .093 .10 (.097) (.096) distcap -.0099 (.0078) trade -.019** (.0076) Countries 19 19 19 N 369 369 362 Note: Replication of Table 4 using the Poisson model with robust standard errors. Depen- dent variable is years to entry after 1989 for each donor in each recipient. Robust standard errors in parentheses. * p < 0.10, ** p < 0.05, *** p < 0.01. 42