The document examines pension fund investments in real estate, highlighting the significant growth in real estate allocations and the volatility of performance over time. Key findings include that larger pension funds tend to invest more internally, while smaller funds often outsource investments to external managers, and that real estate investment costs vary significantly by region and investment approach. The study utilizes a comprehensive database to analyze the impact of fund size, investment strategies, and market dynamics on real estate performance and costs.


![Introduction
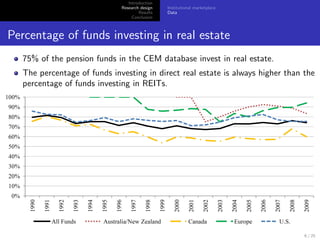
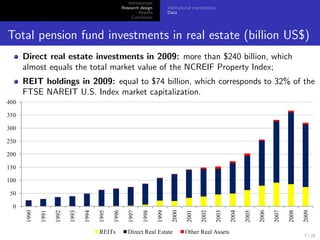
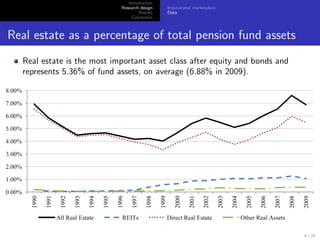
Allocation to real estate
Research design
Investment costs
Results
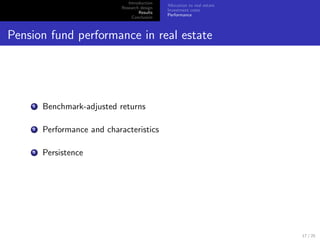
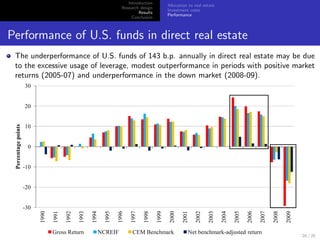
Performance
Conclusion
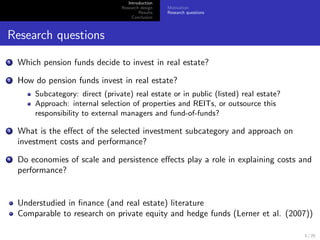
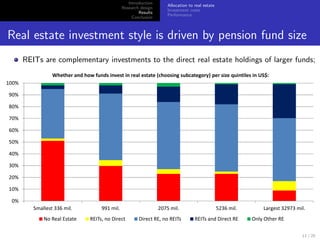
How pension funds invest in real estate - approach
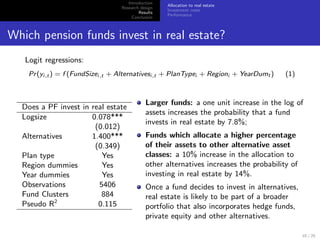
Larger funds are more likely to invest internally; smaller funds are more likely to invest
externally and via fund-of-funds;
Funds with greater allocation to other alternative assets are more likely to invest
externally in real estate.
Logit regressions: choosing an investment approach
Internal Internal External External FoF FoF
Fund size 0.075*** 0.100*** -0.015 -0.026** -0.005* -0.005**
[0.013] [0.016] [0.010] [0.010] [0.003] [0.002]
Alternatives -1.200*** -0.397 1.064*** 0.507** 0.033 0.015
[0.309] [0.279] [0.280] [0.215] [0.024] [0.015]
%REITs 0.138** 0.192*** -0.104** -0.123*** -0.016 -0.016*
[0.055] [0.050] [0.046] [0.033] [0.016] [0.010]
Canada 0.467*** -0.284*** -0.018**
[0.062] [0.050] [0.008]
Europe 0.409*** -0.232*** 0.021
[0.101] [0.087] [0.017]
Aus/Nzd 0.180 0.018 0.027
[0.137] [0.071] [0.028]
Plan type No Yes No Yes No Yes
Year dummies Yes Yes Yes Yes Yes Yes
Observations 3928 3928 3928 3928 3928 3928
Fund clusters 668 668 668 668 668 668
Pseudo R2 0.093 0.253 0.042 0.160 0.109 0.215
12 / 25](https://image.slidesharecdn.com/aekslidesnk052712-120527112559-phpapp02/85/The-Performance-of-Pension-Funds-Investments-in-Real-Estate-12-320.jpg)
![Introduction
Allocation to real estate
Research design
Investment costs
Results
Performance
Conclusion
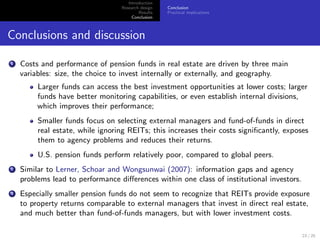
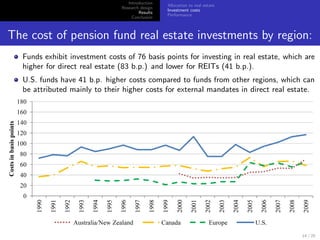
Regression results: real estate investment costs
yi,t = βMandatei,t + γInvApproachi,t + δYearDumt + ci + ui,t , t = 1, 2, ..., 20 (2)
Cons. Mandate %Ext %Act %FoF %LP FE R2
Panel A: Costs regressions for all funds and by region
All funds 185.96*** -32.25** 21.36** 122.03*** Yes 0.25
[65.96] [14.24] [9.31] [41.95]
U.S. 222.76** -41.51** 30.87 151.48*** Yes 0.20
[97.62] [20.91] [21.15] [52.75]
Canada 71.57*** -10.71*** 23.43** -28.31 Yes 0.43
[16.73] [3.93] [11.09] [26.81]
Europe 154.03 -20.04 15.85** 72.79** Yes 0.76
[133.85] [22.10] [6.76] [35.82]
Aus/Nzd -10.65 1.79 23.75 131.28*** Yes 0.83
[27.83] [4.59] [16.53] [35.60]
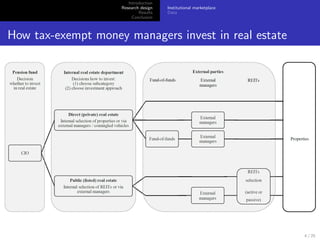
Panel B: Costs regressions by real estate subcategory
REITs 185.22 -32.99 33.27** 10.88 Yes 0.47
[151.45] [27.44] [16.07] [17.58]
Direct 164.89*** -25.82* 17.76** 135.81*** 111.42* Yes 0.61
[62.37] [13.33] [8.82] [44.68] [62.76]
Panel C: Costs regressions by investment approach
Internal 58.34*** -6.84** Yes 0.65
[16.43] [3.06]
External 218.12*** -34.92** Yes 0.21
[63.15] [15.68]
15 / 25](https://image.slidesharecdn.com/aekslidesnk052712-120527112559-phpapp02/85/The-Performance-of-Pension-Funds-Investments-in-Real-Estate-15-320.jpg)
![Introduction
Allocation to real estate
Research design
Investment costs
Results
Performance
Conclusion
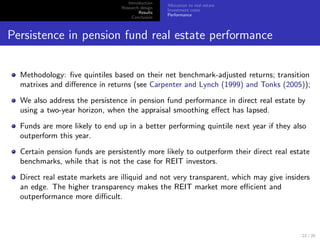
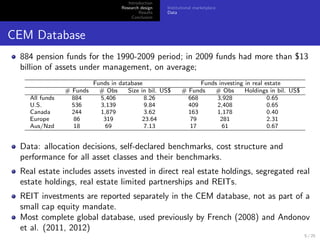
Benchmark-adjusted returns
Self-declared benchmarks (usually market indexes); random coefficient model;
All Assets REITs Direct RE Internal External FoF
Panel A: Gross benchmark-adjusted returns (percent)
All funds -0.10 1.13** -0.18 1.08** -0.20 -1.71
[0.26] [0.52] [0.30] [0.49] [0.31] [3.21]
U.S. -0.38 1.06 -0.47 0.47 -0.38 -2.08**
[0.34] [0.67] [0.40] [0.90] [0.38] [0.91]
Canada 0.40 1.92 0.31 1.20* 0.28 -
[0.50] [1.48] [0.50] [0.72] [0.61] -
Europe 0.42 1.56 0.40 1.75** -0.25 -
[0.75] [1.23] [1.10] [0.89] [1.43] -
Aus/Nzd 0.02 -0.06 -0.04 - 0.14 -
[1.45] [0.35] [1.58] - [1.64] -
18 / 25](https://image.slidesharecdn.com/aekslidesnk052712-120527112559-phpapp02/85/The-Performance-of-Pension-Funds-Investments-in-Real-Estate-18-320.jpg)
![Introduction
Allocation to real estate
Research design
Investment costs
Results
Performance
Conclusion
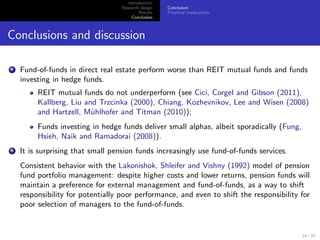
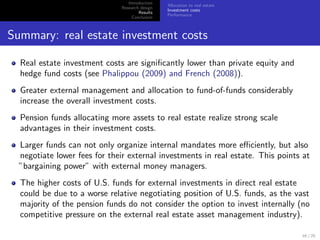
Benchmark-adjusted returns
Self-declared benchmarks (usually market indexes); random coefficient model;
All Assets REITs Direct RE Internal External FoF
Panel A: Gross benchmark-adjusted returns (percent)
All funds -0.10 1.13** -0.18 1.08** -0.20 -1.71
[0.26] [0.52] [0.30] [0.49] [0.31] [3.21]
U.S. -0.38 1.06 -0.47 0.47 -0.38 -2.08**
[0.34] [0.67] [0.40] [0.90] [0.38] [0.91]
Canada 0.40 1.92 0.31 1.20* 0.28 -
[0.50] [1.48] [0.50] [0.72] [0.61] -
Europe 0.42 1.56 0.40 1.75** -0.25 -
[0.75] [1.23] [1.10] [0.89] [1.43] -
Aus/Nzd 0.02 -0.06 -0.04 - 0.14 -
[1.45] [0.35] [1.58] - [1.64] -
Panel B: Net benchmark-adjusted returns (percent)
All funds -0.86*** 0.70 -0.98*** 0.81* -1.05*** -3.90
[0.27] [0.52] [0.30] [0.49] [0.32] [3.39]
U.S. -1.27*** 0.56 -1.43*** 0.21 -1.29*** -3.76***
[0.35] [0.66] [0.41] [0.90] [0.39] [0.92]
Canada -0.17 1.59 -0.28 0.89 -0.45 -
[0.51] [1.52] [0.51] [0.72] [0.62] -
Europe 0.00 1.33 -0.10 1.55* -0.98 -
[0.78] [1.23] [1.12] [0.90] [1.45] -
Aus/Nzd -0.41 -0.31 -0.59 - -0.30 -
[1.47] [0.33] [1.61] - [1.66] -
19 / 25](https://image.slidesharecdn.com/aekslidesnk052712-120527112559-phpapp02/85/The-Performance-of-Pension-Funds-Investments-in-Real-Estate-19-320.jpg)
![Introduction
Allocation to real estate
Research design
Investment costs
Results
Performance
Conclusion
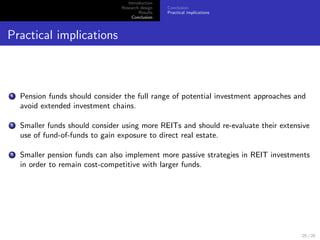
Performance and fund characteristics
We use Fama and MacBeth regressions on the net benchmark-adjusted returns and
correct for autocorrelation and heteroskedasticity using Newey-West with three lags.
Cons. Mandate Costs %Ext %Act %FoF %LP
Panel A: Performance and characteristics for all funds and by region
All funds -0.28 0.32** -1.03*** -1.02** -2.02***
[0.97] [0.15] [0.36] [0.48] [0.69]
U.S. -2.27* 0.40** -0.66 -0.10 -0.38
[1.30] [0.20] [1.01] [0.50] [0.99]
Canada -0.70 0.59*** -1.74*** -0.40 3.17
[1.42] [0.20] [0.66] [0.32] [3.08]
Europe -4.49* 1.05** -6.16 -0.45 0.66
[2.34] [0.41] [5.20] [1.07] [0.87]
Panel B: Performance and characteristics by real estate subcategory
REITs -6.38* 0.70** 0.13 2.42 1.61
[3.21] [0.32] [1.22] [1.47] [1.57]
Direct RE -0.02 0.31*** -1.11*** -1.22** -2.63*** 1.00
[1.05] [0.12] [0.34] [0.56] [0.78] [1.50]
Panel C: Performance and characteristics by investment approach
Internal -0.71 0.43 -2.56
[2.09] [0.28] [2.96]
External -1.07 0.30** -1.13***
[0.70] [0.14] [0.41]
21 / 25](https://image.slidesharecdn.com/aekslidesnk052712-120527112559-phpapp02/85/The-Performance-of-Pension-Funds-Investments-in-Real-Estate-21-320.jpg)